Assessing Projection Bias in Consumers
’
Food
Preferences
Tiziana de-Magistris1,2
*, Azucena Gracia1,2
1Unidad de Economía Agroalimentaria, Centro de Investigación y Tecnología Agroalimentaria de Aragón Zaragoza, Zaragoza, Spain,2Instituto Agroalimentario de Aragón-IA2 (CITA-Universidad de Zaragoza), Zaragoza, Spain
Abstract
The aim of this study is to test whether projection bias exists in consumers’purchasing deci-sions for food products. To achieve our aim, we used a non-hypothetical experiment (i.e., experimental auction), where hungry and non-hungry participants were incentivized to reveal their willingness to pay (WTP). The results confirm the existence of projection bias when consumers made their decisions on food products. In particular, projection bias existed because currently hungry participants were willing to pay a higher price premium for cheeses than satiated ones, both in hungry and satiated future states. Moreover, partici-pants overvalued the food product more when they were delivered in the future hungry con-dition than in the satiated one. Our study provides clear, quantitative and meaningful evidence of projection bias because our findings are based on economic valuation of food preferences. Indeed, the strength of this study is that findings are expressed in terms of will-ingness to pay which is an interpretable amount of money.
Introduction
Empirical evidence on food choice has shown that consumers are subject to projection bias when making intertemporal decisions. In their seminal paper, [1] coined the term‘projection bias’to refer to a general bias which arises whenever preferences change over time, causing individuals to project their current state into the future incorrectly. In particular, when people predict future preferences, they understand the direction in which their preferences will change, but they tend to underestimate the degree to which their future preferences will resem-ble their current preferences [1]. Moreover, the presence of a visceral factor influence, such as hunger, is considered one of the factors that can cause projection bias [1–3].The term‘visceral factor’refers to a wide range of negative emotions (anger, fear, etc.) which drive states that can motivate people to engage in impulsive behaviour called‘out of control’, characterized by unplanned and unconscious cognitive mediation [2–4]. In particular, projection bias is well illustrated when hungry people overspend in the supermarket because they tend to think that their current hunger will endure into the future. However, after having eaten a meal, they real-ize that if their hunger had been satisfied when they were shopping in the supermarket, they would not have overspent on these items.
OPEN ACCESS
Citation:de-Magistris T, Gracia A (2016) Assessing Projection Bias in Consumers’Food Preferences. PLoS ONE 11(2): e0146308. doi:10.1371/journal. pone.0146308
Editor:Pablo Brañas-Garza, Middlesex University London, UNITED KINGDOM
Received:August 13, 2015
Accepted:December 14, 2015
Published:February 1, 2016
Copyright:© 2016 de-Magistris, Gracia. This is an open access article distributed under the terms of the
Creative Commons Attribution License, which permits unrestricted use, distribution, and reproduction in any medium, provided the original author and source are credited.
Data Availability Statement:All relevant data are via figshare10.6084/m9.figshare.2057991.
Funding:This study has been funded by the EU Marie Curie Project, FOODLABELS_PIOF-GA-2009-253323, entitled“Do consumers value food labels? An assessment of the impact of information and personality traits on the demand for food labels.”
The objective of this study is to provide quantified evidence of projection bias by incentiviz-ing people to reveal their truthful preferences for different cheese products. We assessed truth-ful preferences using an experimental auction, asking individuals the maximum price they would pay (in other words, their willingness to pay, WTP) for various cheese products.
To our knowledge, there are at least three studies that have examined the projection bias in food choices. The first is by [5] who approached either hungry or satiated office workers, and asked them to choose between a healthy snack and a less nutritious snack (e.g. fruit vs candy bars) to be delivered one week later, either at a specific time of the day when they expected to be hungry (i.e. late in the afternoon) or when they expected to be satiated (i.e. immediately after lunch). Results of this experiment confirmed that advance choices were influenced by cur-rent hunger, because workers with anticipatedfuture hunger chose unhealthier snacks than satiated workers. On the other hand, hungry subjects chose unhealthy snacks more often for future consumption in comparison to the currently satiated subjects, leading to evidence of projection bias.
Along the same lines, [6] conducted a field experiment at a local grocery store and partici-pants were asked to list the items they intended to purchase. The authors found that if a hungry shopper received a small piece of food right before entering the food market, they were able to limit their shopping to the initial items on their shopping list.
Finally, the study carried out by [7] approached the issue of projection bias using a home-grown experimental auction when bidding on a ham and cheese sandwich. The authors reported the existence of projection bias when subjects had to predict their future tastes versus when they bid for a product intended for immediate consumption.
Although the studies of [5][6] and [7] bear important information to the literature,they present some limitations.
Firstly, in the studies of [5] and [7], the appetite of subjects was manipulated by varying the time of day when their choices were made. Therefore, hungry and satiated states of individuals were supposed to depend on the time of day (i.e. before and after lunchtime, respectively). Consequently, those people who were invited to participate at different times of day (i.e. before and after lunchtime), might be more likely to come before lunch and others after, and then they might be influenced by a time-of-day effect.
Secondly, [5] and[6] did not provide clear, quantitative and meaningful evidence of projec-tion bias because their findings were not based on the economic valuaprojec-tion of food preferences. To illustrate, the study by [5] was conducted in a hypothetical setting where participants were required to choose between a healthy and an unhealthy product. However, individuals were not asked to reveal their willingness to pay for this product. Moreover, [6] reported only differ-ences in‘unplanned purchases’, and‘listless’shoppers spent a larger proportion of their total amount on unplanned food items when they were hungry rather than when they were satiated. However,‘lustful’shoppers spent the same proportion of their total amount on unplanned food items both when they were hungry and when they were satiated. Hence, a limitation of the study is that the experiment design considered only the proportion of unplanned food items, thus resulting in it being complicated to connect unplanned purchases to truthful preferences.
Thirdly, future delivery moments were distinguished in two perceived levels of hunger or satiety of the subjects, and to attempt to have similar behaviours in a meal situation, the experi-ment was set up at the same time of day (before lunch at 1:00 p.m.).
Finally, in order to isolate the effect of changes in attributes and organoleptic characteristics, the study took into account a non-perishable product such as semi-cured cheese.
The findings of this study confirm that projection bias is prevalent in food decisions, since hungry subjects overvalue products delivered both in the hungry and satiated future states compared to satiated subjects. Moreover, overvaluing by currently hungry people is more pro-nounced when products are given in a future hungry state.
The rest of the article is organized as follows. The next section discusses the hypotheses, the experimental design, the rationale for the inclusion of the different treatments, and the steps in the implementation of the auction. The results are presented in the following section, and the final section discusses the importance and the implications of the findings.
Materials and Methods
Ethics Statement
Respondents were informed by written consent to participate in the study. Each participant was assigned an ID number and asked to sign a participation and ethical approval form. Proto-cols and procedures were approved by the Ethics Committee of the Agri-food Research and Technology Centre (CITA).
Experimental design
We used a homegrown auction that allows for assessing consumers’valuations for different products. This valuation method has been extensively used to value different food products in the last few years. [8] indicated that up 2006, more than 100 academic studies had utilized experimental auctions to elicit consumers’preferences for various products. Experimental auc-tions are popularly used due to their incentive compatibility properties; they provide an incen-tive to subjects to state their true preferences.
For this experiment the random nthprice auction with repeated rounds (i.e. 6 rounds) and the full bidding approach were employed for several reasons. Firstly, repeated rounds have the benefit of the learning effect as stated by several authors [8,9,10] who argue that this procedure yields val-uations more consistent with neoclassical economic theory. On the other hand, since we were aware of the possibility of the occurrence of bid affiliation effects and other psychological effects (such as competition or anchoring effects) no price feedback among multiple rounds was reported [11].Secondly, similar to the Becker-Degroot-Marschak (BDM) mechanism [12], the random nth price works well for off-margin bidders whose values are far from the market price. However, in contrast to the BDM mechanism andas [13] reported, the random nthprice auction has an addi-tional benefit of encouraging competition amongst bidders similar to the second-price auction. [14] compared the second Price auction top the BDM while [13] compared the second Price auc-tion to the random nth. [15] compared all three mechanisms and they found that on average the second price and random nth price auctions were significally more accurate than the BDM.
interest as it is the maximum total willingness to pay (WTP) for the different cheese products. Finally, we did not use the reference price of field substitutes of cheese during the auction because the reference price of field substitutes would increase the bid values as stated by [17,19].
To avoid transaction cost effects, subjects received a signed document in which the experi-menters stated that they would handdeliver the product to them the next day. To gain the trust of participants, monitors showed their personal signed business cards with a signed document. Finally, to homogenize participants’level of hunger in both treatments, we set the sessions before lunchtime (at 1:00 p.m.) and manipulated the hunger state during the experiment. This procedure minimized selection bias that could occur because some people might more likely participate at lunchtime, while others might more likely come after lunch.
We designed an experimental auction applying a 2x2 full factorial design. The first factor is the immediate‘appetite level’during the experiment (hungry vs satiated). The second factor represents‘food attitudes’at the moment of cheese delivery (future expected hunger at 1:00 p.m. vs future expected satiation at. 3:00 p.m). Hence, this led to the four treatment groups dis-played in two rows and two columns inTable 1. The rows being H0(currently hungry) and S0
(currently satiated) and the columns being H1(future hungry) and S1(future satiated). The
first treatment group (H0H1) denotes that participants were currently hungry and that they
would receive the cheese when they expected to be hungry. The second treatment group (S0H1)
denotes that satiated individuals would receive the cheese when they expected to be hungry. The third combination (H0S1) consisted of currently hungry participants who would receive
the cheese products when they expected to be satiated.
Finally, the fourth treatment group (S0S1) denotes that satiated participants would receive
the cheese products when they expected to be satiated. Hence, projection bias is not only tested by the current levels of hunger or satiety but also by future perceived levels of hunger or satiety of the subjects, since we informed participants before the bidding process when the product would be delivered.
Hypothesis definition
Three hypotheses were outlined to test for projection bias. The first hypothesis to test is whether the WTP for different cheese products exhibited by hungry participants is equal to the WTP for cheese products by satiated subjectswhen they will receive the cheese the next day, beingeither hungry or satiated:
H0
1 ¼WTPðH0H1;H0S1Þ ¼WTPðS0H1;S0S1Þ
H1
1 ¼WTPðH0H1;H0S1Þ>WTPðS0H1;S0S1Þ
If the null hypothesis is rejected, it means that projection bias exists. That is because the cur-rently hungry participants who will receive the cheese the following day when they expect to be either hungry or satiated, will presume that the current hunger will endure into the future and, thus, they will overvalue the cheeses. However, when they are currently satisfied, they will not overvalue the cheeses because of their satiated state, even if predicted to be either hungry or
Table 1. Experimental design.
Level of hunger Food attitudes
H1 S1
H0 H0H1 H0S1
S0 S0H1 S0S1
satiated in the future. Hence, currently hungry people underappreciate the impact of being sati-ated in the future on their utility, thus leading them to value the cheese more than they should have done if they were satiatedin the future.
The second hypothesis concerning projection bias is whether the WTP revealed by currently hungry or satiated participants who will receive the cheese when they are hungry is equal to the WTP for cheeses delivered the next day when they are satiated:
H0
2 ¼WTPðH0H1;S0H1Þ ¼WTPðH0S1;S0S1Þ
H12 ¼WTPðH0H1;S0H1Þ>WTPðH0S1;S0S1Þ
If the null hypothesis is rejected then it means that the projection bias exists because given either state (hungry or satiated), participants were willing to pay more to get the cheese when they anticipated being hungry in the future than when they anticipated being satiated.
Finally, since there is an interaction effect between current hungry and future hungry situa-tions and between current and future satiated situasitua-tions which could exist, a third hypothesis was established. Hypothesis 3 is whether the difference in the WTP between hungry partici-pants who will receive the cheeses when they will be either hungry or satiated are equal to the difference in WTP between satiated people who will receive the cheese when they expect to be either hungry or satiated, respectively:
H0
3 ¼WTPðH0H1Þ WTPðH0S1Þ ¼WTPðS0H1Þ WTPðS0S1Þ
H1
3 ¼WTPðH0H1Þ WTPðH0S1Þ>WTPðS0H1Þ WTPðS0S1Þ
If the null hypotheses is rejected, it means that there is a positive difference in willingness to pay between future hungry and future satiated participants, but the projection bias makes the difference greater when one is currently hungry rather than currently satiated.
Implementation of the auction
A non-standard subject pool consisting of 98 consumers was recruited using a stratified random procedure by age, gender, and education level. In an attempt to ensure that subjects were repre-sentative of shoppers in stores, we selected those people responsible for the food purchases in the household and who had previous experience with the products under investigation. In particular, we recruited two experimental groups;48 people participated in H0H1and S0H1treatments,
while 50 individuals participated in H0S1and S0S1treatments. According to our experimental
design, we were interested in recruiting hungry participants and in making them satiated during the experiment. Then, those subjects who stated that they were not hungry before being fed were excluded from the experiment, which resulted in the removal of nine participants.As shown in
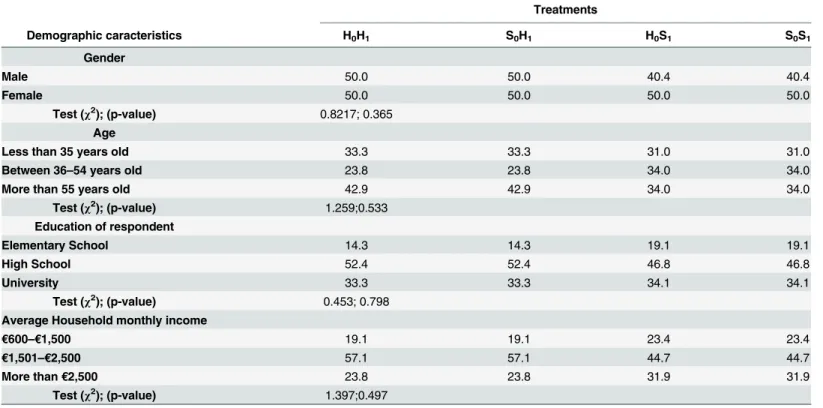
Table 2, the experimental groups did not differ in terms of the percentages of women and men, age, education and, income. The results of these tests suggest that our randomization was suc-cessful in equalizing the characteristics of participants between the two experimental groups.
The product selected for the experiment was cheese from semi-cured pasteurized sheep milk. In particular, there were four different versions of this cheese: (i) cheese without any claim, (ii) cheese with a health-related claim (a nutritional claim indicating a fat-reduced con-tent:‘light’contained 40% less fat than the other cheeses in the experiment), (iii) cheese with a regional claim (‘protected designation of origin—PDO’), and (iv) cheese with an organic claim (with the European organic logo). The rest of the cheese characteristics were constant, and the only difference among them corresponded to the featuresclaimed and mentioned above.
to sign a consent form. Initially, the experimenters provided the participants the instruction mechanism and the information on the products sheets. In order to avoid any communication among the participants, during the auction, each consumer was positioned separately from the others, and the monitors stressed that communication was not allowed during the auction. The subjects were fully briefed on the procedure of the auction method using a blackboard and scripts, and they were informed about the dominant strategy to reveal their true values for the products offered. Since participants were cheese consumers, they were not given any bid limits. A practice task with four different candy barswas conducted to allow participants the opportu-nity to understand the auction mechanism.
During the auction, each participant was asked to submit simultaneously a bid for each of the four cheese products. The bids were collected and this step was repeated during three addi-tional rounds. At the end of the third round, we manipulated the hungry/satiated state by pro-viding the participants with an amount of unrelated food (e.g., tortilla, vegetables, squid, tapas and water), asking them to eat until they felt satiated. Participants were not allowed to commu-nicate with each other when eating.When all the rounds were conducted, the‘n’was randomly chosen to determine the binding price (nthhighest bid for the product). Also, a random draw determined which of the six rounds was binding. Then, a random draw determined which of the four cheese products was binding. However, the product was handdelivered to the highest bidders the next day wherever they wished. The timing of delivery on the subsequent day depended upon the treatment (i.e. before lunch or after lunch).
Hunger rating
A manipulation check question (How hungry are you?) to measure the subjective degree of feelings of starvationwas posed to subjects before starting the auction and after having eaten
Table 2. Sample characteristics and demographic variables definition %.
Treatments
Demographic caracteristics H0H1 S0H1 H0S1 S0S1
Gender
Male 50.0 50.0 40.4 40.4
Female 50.0 50.0 50.0 50.0
Test (χ2); (p-value) 0.8217; 0.365
Age
Less than 35 years old 33.3 33.3 31.0 31.0
Between 36–54 years old 23.8 23.8 34.0 34.0
More than 55 years old 42.9 42.9 34.0 34.0
Test (χ2); (p-value) 1.259;0.533
Education of respondent
Elementary School 14.3 14.3 19.1 19.1
High School 52.4 52.4 46.8 46.8
University 33.3 33.3 34.1 34.1
Test (χ2); (p-value) 0.453; 0.798
Average Household monthly income
€600–€1,500 19.1 19.1 23.4 23.4
€1,501–€2,500 57.1 57.1 44.7 44.7
More than€2,500 23.8 23.8 31.9 31.9
Test (χ2); (p-value) 1.397;0.497
the food. Responses are on a Likert scale where 1 indicates‘not at all’and 5 indicates the high-est intensity of hunger [20–21].
Results
Manipulation checks
Table 3reports the mean level of the self-reported hunger of participants and the t-test results. The averages of the self-reported hunger levels of participants before and after the manipula-tion of their hunger were statistically different at the 5% significance level. These results indi-cate that participants stated a significantly lower self-reported level of hunger after eating and that they were indeed hungry at the beginning of the experiment and became satiated afterward.
Preliminary analysis
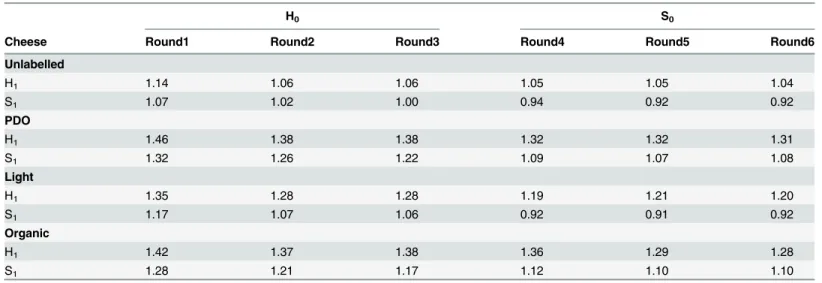
Table 4reports the average bids for each cheese product across the six rounds and 4 treatments. It is observed that generally the average bids of the first round are statistically different from the second round for all cheese products (unlabelled: t = 2.81,p-value = 0.003; PDO: t = 2.54,
p-value = 0.006; light: t = 2.94,p-value = 0.002; organic: t = 1.70,p-value = 0.04). However, average bids in the third round are not statistically different from average bids in the second round (unlabelled: t = 0.67,p-value = 0.499; PDO: t = 1.46,p-value = 0.146; light: t = 0.33,p -value = 0.739; organic: t = 0.76,p-value = 0.444). These results indicate that hungry participants learned and gained experience with the mechanism due to the learning effect. However, the
Table 3. Level of self-reported participants´hunger between treatments.
Treatments
H0H1 S0H1 H0S1 S0S1
Self-reported hunger level 3.14 1.19 2.85 1.48 t-test (p-value) 12.2 (0.000)* 9.9 (0.000)*
*It denotes statistically significant differences at 1%, respectively
doi:10.1371/journal.pone.0146308.t003
Table 4. Mean bids (€/100 grams) for each cheese across treatments.
H0 S0
Cheese Round1 Round2 Round3 Round4 Round5 Round6
Unlabelled
H1 1.14 1.06 1.06 1.05 1.05 1.04
S1 1.07 1.02 1.00 0.94 0.92 0.92
PDO
H1 1.46 1.38 1.38 1.32 1.32 1.31
S1 1.32 1.26 1.22 1.09 1.07 1.08
Light
H1 1.35 1.28 1.28 1.19 1.21 1.20
S1 1.17 1.07 1.06 0.92 0.91 0.92
Organic
H1 1.42 1.37 1.38 1.36 1.29 1.28
S1 1.28 1.21 1.17 1.12 1.10 1.10
average bids of cheese products in the fourth round, after subjects were fed, are statistically fewer than the average bids in the third round before the hunger manipulation (unlabelled: t = 1.48,p-value = 0.07; PDO: t = 2.04,p-value = 0.02; light: t = 2.49,p-value = 0.007; organic: t = 2.03,p-value = 0.002). This result implies that the hunger manipulation brought about some effect on the bidding behaviour of participants. Finally, as expected, the average bids in the fourth round are not statistically different from average bids in the fifth round (unlabelled: t = 0.51,p-value = 0.604; PDO: t = 1.03,p-value = 0.146; light: t = -0.105,p-value = 0.913; organic: t = 2.12,p-value = 0.03) and the sixth round (unlabelled: t = 0.59,p-value = 0.55; PDO: t = -0.28,p-value = 0.77; light: t = -0.12,p-value = 0.901; organic: t = 0.21,p-value = 0.827). These results confirm that individuals had already learned during the previous rounds and that hunger manipulations (current and future) were the only effects produced during the
experiment.
Hypothesis testing
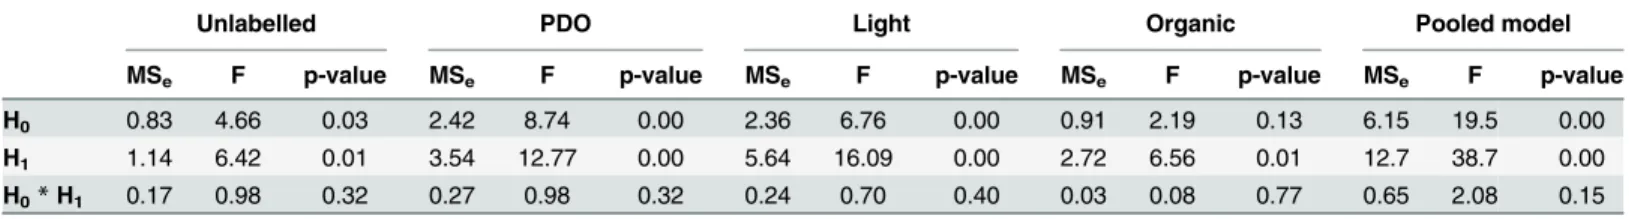
The whole sample dataset contains the pooled bids of each subject by round and for the four cheese products. Firstly, to test the three hypotheses concerning projection bias, anANOVA analysis with a model of two main effects (H0and H1) and one interaction between H0and H1
was taken into consideration. Secondly, to decide the best specification for testing projection bias, we used our ANOVA model for each cheese product and for pooled cheese products. As shown inTable 5, by comparing the ANOVA models, wenoticed the existence of little evidence that the projection bias affects cheeses differently.
This result was also confirmed by the ANOVA analysis using the type of cheese as third fac-tor and the covariance analysis using the Likelihood Ratio (LR).
Hence, to test the hypotheses of projection bias we considered the pooled model consisting of average bids for the four cheeses as shown in the last columns ofTable 5. Moreover, the aver-age pooled bid values across the four treatments are shown inTable 6.
Generally, as shown inTable 6, the average bids for all cheeses were higher when subjects were currently hungry than when they were satiated. To illustrate, the average bids for cheese products were higher in H0H1than in S0H1. Moreover, average bids were higher in H0S1than
in S0S1.These results are confirmed by the ANOVA analysis as illustrated inTable 4. It is
evi-dent that the main effect of current hunger H0was on average bid values, meaning that we are
able to reject the first hypothesis of projection bias. This result suggests that participants
Table 5. ANOVA analysis: testing projection bias across the four cheese products and for pooled data.
Unlabelled PDO Light Organic Pooled model
MSe F p-value MSe F p-value MSe F p-value MSe F p-value MSe F p-value
H0 0.83 4.66 0.03 2.42 8.74 0.00 2.36 6.76 0.00 0.91 2.19 0.13 6.15 19.5 0.00
H1 1.14 6.42 0.01 3.54 12.77 0.00 5.64 16.09 0.00 2.72 6.56 0.01 12.7 38.7 0.00
H0*H1 0.17 0.98 0.32 0.27 0.98 0.32 0.24 0.70 0.40 0.03 0.08 0.77 0.65 2.08 0.15
doi:10.1371/journal.pone.0146308.t005
Table 6. Average Bids across the four treatments(€/100 grams).
Treatments Mean bids Standar Deviation
H0H1 1.29 0.61
S0H1 1.22 0.56
H0S1 1.15 0.54
S0S1 1.00 0.52
overvalued the cheese products more when they were hungry rather than when they were sati-ated, both when they would expect to receive the cheese when they would be either hungry and satiated. Hence, for any given future state, subjects were willing to pay more when they were currently hungry than when they were satiated.
On the other hand, the average bids in H0H1were higher than in H0S1. Likewise, the average
bids in the S0H1were higher than in S0S1,thus suggesting that participants overvalued the
cheeses more when they were delivered in the future hungry treatment than in the satiated one. Indeed, the ANOVA analysis also confirmed the main effect of future hunger (H1) on average
bid values, suggesting that we are able to reject the second hypothesis of projection bias. This result implies that for any current hungry or satiated state, participants were willing to pay more when they anticipated being hungry. Finally, the absence of significant interaction between H0and H1suggests that we are not able to reject the third hypothesis. From the results,
there was no statistical basis for concluding that immediate hunger level of individuals had a statistically greater effect on average bid values in comparison to future hunger levels, and that the projection bias does not make the difference between H1and S1when one is currently
hun-gry rather than currently satiated. In other words, current hunger,H0,and future hunger,H1,had
an independent and added effect on average bid values since the empathy gaps were of about equal size as stated by [5].
In conclusion, overall findings suggest clear, quantifiable evidence of the projection bias in consumer food preferences. In particular, currently hungry participants overvalued cheese delivered in the future treatments with an additional premium of 11 cents on average, com-pared to satiated subjects. Overvaluing by currently hungry participants was slightly more pro-nounced (12.5 cents) when cheese was delivered in a future hungry treatment rather than in the satiated one.
Conclusions
It is widely documented in experimental settings from social psychology literature that individ-uals can often make decisions that are not in their best interest (e.g. in terms of their long-term health). One of the reasons is that the level of hunger of individuals could make difficult to pre-dict their behaviour when they will be in a different emotionally‘cold’state (e.g. satiated) because their current‘hot’state (e.g. hungry) overrides them. Therefore, while individuals understand the directions in which their tastes will change, they can be prone to systematically underestimate or overestimate the magnitude of these changes.
The objective of our study was to test the existence of projection bias using a
non-hypothetical artefactual experiment (i.e. experimental auction) to provide quantified evidence of projection bias. Specifically, we examined whether projection bias exists when hungry and non-hungry subjects were incentivized to reveal their WTP. Participants were fed to the point of satiety after a few rounds of the auction to manipulate their hunger level.
Results confirmed the existence of projection bias when consumers made their decisions concerning food products. Specifically, projection bias exists because, for any future state, par-ticipants were willing to pay a higher price premium for the cheese when they were currently hungry than when satiated. In addition, projection bias exists because given any current state (hungry or satiated), participants were willing to pay more to get the cheese when they antici-pated being hungry in the future. However, we are not able to conclude whether an immediate hunger level had a statistically greater effect on average bid values than a future hunger level.
terms of tastier food. Because food advertising rises emotional utility for consumers theymay perceive food productsas worth more than their objective value, and so they are willing to pay more to get them. Secondly, food advertising could stimulates the desire for a product not only when people are currently hungry, but also when they anticipate being hungry because the pal-atable food stimuli can trigger an hedonic hunger. Finally, another possible marketing strategy conducted by food companies is to set testing promotions at stores and supermarkets before lunch and dinner time. Therefore, shoppers might start to crave the food and then to project how much food they want or need, thereby driving up sales, whether or not they were initially hungry.
However, from the consumer`s perspective, targeting hunger may drive consumers to pur-chase unhealthy food such as junk food because they become more sensitive to future cravings when they are currently experiencing a craving. Therefore, the findings of this study also sug-gest that individuals should avoid buying food when they are in a hungry state because they will be more likely to purchase unhealthy food and pay more for it than when they are satiated.
Finally, our results also have significant implications for the design and use of non-hypo-thetical experimental auctions to elicit WTP values from subjects for food products. For exam-ple, our results suggest that if participants have projection bias, their bidding decisions can be influenced by their current levels of hunger or satiety. This finding is important since hunger levels of participants are not taken into account in experimental auctions. Given the increasing importance and use of experimental auctions to elicit consumers’preferences and WTP values for marketing and policy purposes, researchers and practitioners should take into account the hunger level and control this factor when designing an experimental auction. If this is not taken into account, valuations may be skewed by participants’projection bias.
Acknowledgments
This study has been funded by the EU Marie Curie Project, FOODLABELS_PIOF-GA-2009-253323, entitled“Do consumers value food labels? An assessment of the impact of information and personality traits on the demand for food labels.”
Author Contributions
Conceived and designed the experiments: TDM AG. Performed the experiments: TDM AG. Analyzed the data: TDM. Contributed reagents/materials/analysis tools: TDM AG. Wrote the paper: TDM AG. Introduction: TDM. Materials: TDM AG. Results: TDM AG. Conclusions: TDM AG.
References
1. Loewenstein G, O’Donoghue T, Rabin M, Projection Bias in Predicting Future Utility. Q J Econ, 2003, 118(4): pp.1209–1248.
2. Loewenstein G., out of Control: Visceral Influences on Behavior. Organ Behav Hum Dec,1996, 65(3): 272–292.
3. Loewenstein G. Hot-cold empathy gaps and medical decision making. Health psychology: official jour-nal of the Division of Health Psychology, American Psychological Association, 2005, 24(4):.S49–S56. 4. Bolles R.C, Theory of motivation, New York: Harper & Row, 1967.
5. Read D, van Leeuwen B, predicting Hunger: The Effects of Appetite and Delay on Choice. Organ Behav Hum Dec, 1998, 76(2):189–205.
6. Gilbert D, the Future Is Now: Temporal Correction in Affective Forecasting. Organ Behav Hum Dec, 2002, 88(1): 430–444.
8. Alfnes F. and Rickertsen K. (2003). European Consumers`Willingness to pay for U.S. Beef in Experi-mental Auction Market. American Journal of Agricultural Economics 2: 396–405.
9. Cox J.C.,andGrether D.M. (1996). The preference reversal phenomenon: response mode,markets and incentives. Economic Theory 7: C381–C405.
10. Shogren JF, Valuation in the lab. Environ Res Econ, 2006, 34(1).163–172.
11. De-Magistris T., del Giudice T. andVerneau, (2015). The Effect of Information on Willingness to Pay for Canned Tuna Fish with Different Corporate Social Responsibility (CSR) Certification: A Pilot Study”, Journal of Consumer Affairs,Vol. 49, No 2, pp. 457–471.
12. Becker G., DeGroot M., &Marschak J. (1964). Measuring utility by a single—Response sequential method. BehavioralScience, 9, 22–236.
13. Shogren JF, Margolis M, Cannon K, List JA, a random nth-price auction. J Econ Behav Organ, 2001, 46(4): 409–421.
14. Noussair C., Robin S., &Ruffieux B. Revealing Consumers´Willingness-to-pay: A comparison of the BDM mechanism and the Vickrey Auction. Journal of Economic Psychology, 2004, 25: 725–741 15. Lusk J.L. and Rousu M.“Market Price Endogeneity and Accuracy of Value ElicitationMechanisms.”
Experimental Methods in Environmental and Resource Economics. Ed.List John. Edward Elgar Pub-lishing. 2005
16. Lusk JL, Shogren JF, Experimental Auctions. Cambridge: Cambridge University Press, 2007 17. Hellyer Nicole Elizabeth, Fraser Iain, and Haddock-Fraser Janet. 2012. Food Choice, Health
Informa-tionand Functional Ingredients: An Experimental Auction Employing Bread. Food Policy, 37: 232–245 18. Alfnes F., (2009). Valuing product attributes in Vickrey auctions when market substitutes are available.
European Review of Agricultural Economics 36: 133–149.
19. Bernard John C. and He Na. 2010. Confounded by the Field: Bidding in Food Auctions When Field Prices Are Increasing. Agricultural and Resource Economics Review, 39: 275–287.
20. Keim NL, Stern JS, Havel PJ, relation between circulating leptin concentrations and appetite during a prolonged, moderate energy deficit in women. Am J Clin Nutr,1998, 68(4):794–801 PMID:9771856