Vol. 6, No. 8, 2015
Evaluation and Improvement of Procurement Process
with Data Analytics
Melvin Tan H.C., Wee-Leong Lee
School of Information Systems Singapore Management University80 Stamford Road Singapore 178902
Abstract—Analytics can be applied in procurement to benefit organizations beyond just prevention and detection of fraud. This study aims to demonstrate how advanced data mining techniques such as text mining and cluster analysis can be used to improve visibility of procurement patterns and provide decision-makers with insight to develop more efficient sourcing strategies, in terms of cost and effort. A case study of an organization’s effort to improve its procurement process is presented in this paper. The findings from this study suggest that opportunities exist for organizations to aggregate common goods and services among the purchases made under and across different prescribed procurement approaches. It also suggests that these opportunities are more prevalent in purchases made by individual project teams rather than across multiple project teams.
Keywords—procurement; text mining; clustering; data analytics; fraud detection
I. INTRODUCTION
Several procurement lapses in Singapore have brought procurement risk into the spotlight [1]. Today, stakeholders are demanding to know whether their money is being spent wisely and not used on fraudulent expenditure. While steps were taken to improve internal control by strengthening procurement guidelines and policies, another approach has gathered pace – integrating data analytics into the procurement process to help prevent and detect fraud. Although this has been the key objective of the application of analytics in procurement, this study has shown that there are other benefits to be reaped from its application. Analytics improve visibility of procurement patterns and empower stakeholders with better insight for developing more efficient sourcing strategies, in terms of costs and effort.
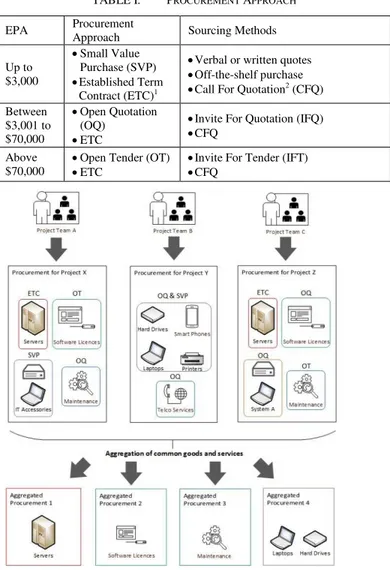
In Organization X (the organization involved in this study chose to remain anonymous for privacy reasons), under their procurement rules and principles, the prescribed procurement approach is based on the Estimated Procurement Amount (EPA) of the intended procurement. This can be summarized in Table 1.
TABLE I. PROCUREMENT APPROACH EPA Procurement
Approach Sourcing Methods Up to
$3,000
Small Value Purchase (SVP) Established Term
Contract (ETC)1
Verbal or written quotes Off-the-shelf purchase Call For Quotation2 (CFQ) Between
$3,001 to $70,000
Open Quotation (OQ)
ETC
Invite For Quotation (IFQ) CFQ
Above $70,000
Open Tender (OT) ETC
Invite For Tender (IFT) CFQ
Fig. 1. Current situation in Organization X and the desired outcome
1 Organization X has combined purchases of common goods and services by establishing a Term Contract to yield better value for money through economies of scale. With an Established Term Contract (ETC), Organization X can then procure directly from the appointed supplier(s) when the product or service is required during the contractual period.
The mission of Organization X is to provide effective and timely information and communications technology (ICT) support and solution. In Organization X, procurement of goods and services is proposed by project teams focuses on various areas and projects with different objectives and timelines. Based on the EPA of their intended procurement, their procurement needs are subsequently carried out in separate transactions using the prescribed procurement approaches stated in Table 1. There could be opportunities to aggregate common goods and services across the various areas and projects to achieve possibly higher economies of scale and lessen the administrative efforts. By consolidating frequent purchases into a contractual agreement, Organization X can exploit economies of scale to obtain favorable prices and reduce the transactional overhead of subsequent acquisitions of the same item by performing it upfront. An illustration of the current situation in Organization X and the desired outcome is shown in Fig. 1.
The main purpose of this study is to propose a model where analytics can be applied to detect such opportunities and derive meaningful insights that would lead to improvement in the current procurement process. This paper is organized as follows: Section II provides a literature review of efforts made in application of analytics in procurement and the proposed data mining techniques. Section III presents the data and input variables used in the analysis. Section IV shares the design considerations of the analysis, proposed model and methodology for the analysis. In Section V, the results and discussion of the findings are presented. Section VI concludes the paper and proposed recommendations to the findings and suggest areas for future improvements.
II. LITERATURE REVIEW
Kemp [2] commented that analytics have been used at an advanced level for years to combat fraud in the private sector, especially in financial services. He advocated the following approaches which are proven within the private sector:
Rules-based detection - identifies potential instances of fraud based on behaviors already proven to be fraudulent.
Anomaly detection - spots unknown or unexpected patterns by comparing like-for-like data within groups. Advanced analytics – applies the latest data, text and
web mining technologies to identify fraudulent and errant behaviors that have not already been spotted by rules-based and anomaly detection approaches.
Byrne [3] suggested that much effort has gone into ensuring minimization of fraud, misconduct and other unethical behaviors in procurement and it is time for procurement to start adding value to Organizational strategies and to move from what many perceive as a policing role to a value added role. He added that procurement should be managed strategically and this requires analysis of past procurement spending to determine if you can combine individual purchases to cut costs.
National Fraud Authority [5] highlighted a number of inefficiencies in public procurement, some of which were due
to departmental autonomy over procurement. It was recommended that government should leverage its purchasing power by seizing opportunities to procure as a single entity. The Organization for Economic Co-operation and Development (OECD) [6] has also identified that savings are being sought, through a variety of measures including centralization of the procurement function, the aggregation of purchases in order to achieve economies of scale.
Chae and Olson [4] discussed the role of analytical capability for sourcing in Supply Chain Management. There is a strong application of analytical IT to support supplier selection within supply chains. Prescriptive analytics has been a key enabler of manufacturer's sourcing-related decision making. Predictive analytics techniques are increasingly available these days for intelligent material planning, inventory management, and supplier relationship management. For instance, advanced machine learning techniques such as artificial neural networks and support vector machines are promising tools to enable effective sourcing. Pattern recognition, when used with large sets of historical purchase orders and supplier delivery data, can reveal hidden facts and potential problems with processes and performances.
Kantardzic [7] proposed that market search, business-intelligence gathering, mail management, claim analysis, e-procurement and automated help desk are only a few of the possible applications where text mining can be successfully deployed. Miner et al [9] discussed efforts on clustering in Natural Language Processing (NLP) and how necessary information extraction from the meaning of the text can be performed.
To analyze demand before it can be aggregated, Chia and Chen [8] discussed how Business Intelligence (BI) methodologies using the online analytical processing (OLAP) concept such as drilling, pivoting, dicing and aggregating can be applied to the unstructured content found in procurement databases by performing any ad-hoc query. This would allow users to derive transaction trends at any hierarchy and resolution.
The literature review suggests the following:
a)There is no doubt on the benefits that analytics can bring to procurement, beyond its application in the prevention and detection of fraud.
b)The principles behind the analytical approaches applied successfully for fraud detection and prevention could be used to identify opportunities for aggregation of purchases. c)Advanced data mining techniques such as cluster analysis, text mining etc. could be applied in procurement.
d)BI tools such as OLAP are commonly used to analyze procurement data. There is limited literature to suggest widespread application of advanced data mining techniques to analyze procurement data.
III. DATA SET AND INPUT VARIABLES
Vol. 6, No. 8, 2015 highlighted in Table 1. This period was selected based on
completeness of records (for more accurate insights drawn from the results of the analysis) and recency (for more meaningful follow-up action on the insights derived).
The records for SVP are provided by the Finance Section of Organization X. The Finance Section maintains this information in Excel Spreadsheets. There are 20,861 records for SVP. The records for OQ and ETC are extracted from the procurement databases. There are 267 and 118 records for OQ and ETC respectively.
As there are many data fields available in these records, only the data fields containing information relevant to this study need to be identified. Data fields of interest would include information on description of the purchased items, amount spent, period of transaction, supplier and buyer details.
The records underwent extensive data exploration, manipulation and cleaning to prepare them for analysis:
a)SVP
i. Filter transactions amounting between $0 and $3,000. ii. Remove transactions relating to:
-Claims (transport, dental, medical, travel) -Training-related payment
-Public utilities (Power, water etc.) and telecommunication-related payment
-Contract-related payment.
iii. Remove transactions with missing fields.
iv. The number of SVP transactions was reduced to 785 records.
b)OQ and ETC
i. Categorize the transactions by year. IV. METHODOLOGY
Given the nature of the procurement process in Organization X, it would be interesting to see how the three analytic approaches prescribed by Kemp [2] for combating fraud could be adapted and applied to Organization X‟s procurement process to meet the objective of this study:
a)Rules-based detection – Logically, if frequent purchases can be consolidated, they can also be split. In order to avoid the rules put in place for a higher EPA procurement approach, which one might perceive as being more stringent in terms of approval and more time-consuming in terms of administrative efforts, a high-value purchase might be split up into multiple low-value purchases to be carried out separately. For instance, an EPA of $10,000 which rules prescribed a procurement approach via an OQ might be split into multiple lower value purchases via the SVP procurement approach. Hence, the scope of analysis should cover the transactions related to the different procurement approaches determined by the EPA of the intended procurement, namely:
i. SVP - Goods and services of similar nature can be aggregated into OQs.
ii. OQ - Goods and services of similar nature can be aggregated into OTs.
iii. ETC – While goods and services available under the ETCs are in general already aggregated, a better understanding of how they were purchased will improve procurement planning and possibly reduce the administrative efforts involved in issuing CFQs. b)Anomaly detection – In the context of consolidating frequent purchases, observations which are beyond the norm i.e. abnormal trends and patterns could be:
i. Recurring transactions of similar goods and services.
ii. Dominant suppliers, in terms of number of transactions and amount spent.
c)Advanced analytics – Text Mining and Clustering techniques could be appropriate given the nature of the data.
In the organization currently, the account codes i.e. expense codes are used to categorize purchases into categories that describe the nature of the goods or services purchased. However, these could be too generic to derive any further useful information on the goods or services purchased. For instance, an IT-related equipment purchase is only categorized into hardware, software or communication equipment and network. In addition, the account codes are allocated by the purchasers on a best-effort basis and these are subjected to judgment errors. Hence, the description fields which contained information on the actual goods or services purchased would reveal more details about the transactions than the account codes.
A key problem with the description fields is that they are captured in free text format. Therefore, they are likely to include a significant amount of irrelevant and noisy information such as dates, names, teams, etc. To the untrained eye, the goods or services purchased would not be intuitively noticeable.
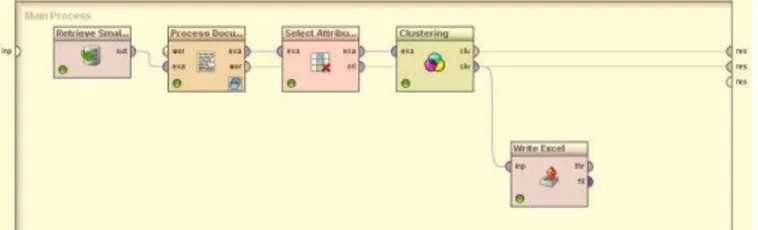
The text mining with cluster modelling process in Rapid Miner is illustrated in Fig 2.
Fig. 2. Text mining with cluster modelling process in Rapid Miner The functions of the 5 main operators are:
a)Retrieve data - Reads data from the file
b)Process Documents from Files – Processes the text using eight operators nested within:
i. Tokenize Non-letters (Tokenize). ii. Tokenize Linguistic (Tokenize). iii. Filter Stopwords (English). iv. Filter Stopwords (Dictionary).
v. Filter Tokens (by Length). vi. Stem (Porter).
vii. Transform Cases.
viii. Generate n-Grams (Terms).
c)Select Attributes – Only columns with numeric values are selected for clustering (due to the choice of the clustering technique, K-Means, in the following step).
d)Clustering – K-Means clustering algorithm is used to group the records in terms of the occurrence frequency of words in it. K-Means is selected for its simplicity and speed among the clustering techniques.
e)Write Excel – The output i.e. cluster groups is saved into an Excel file so that they can be combined with the other data fields i.e. amount spent, period of transaction i.e. Year, supplier and buyer details to derive further insights.
For each group of data (SVP, OQ and ETC) the methodology for the analysis is as follows:
a)Approach 1
i. Input the data into the designed process in Rapid Miner.
ii. Run the process.
iii. Examine the results – Word List, Cluster Model and Centroid Table.
iv. Re-calibrate the parameters accordingly and repeat from Step ii. Compare the results of multiple runs with different k classes and choose the best one. v. Combine the results of the selected cluster with other
data fields i.e. amount spent, period of transaction, supplier and buyer details.
vi. Explore and analyze the results for insights.
b)Approach 2
i. Tabulate the data by the supplier details against the period of transaction, amount spent, number of transactions made and the buyer details.
ii. Identify suppliers from whom purchases were made in every year.
iii. Extract the records for the identified suppliers. iv. For those with many transactions, follow the steps in
Approach 1 using the data obtained in Step 3. v. Explore and analyze the results for insights.
Approach 1 begins with the identification of the common goods and services purchased. The output is analyzed together with related information on the amount spent, period of transaction, supplier and buyer details. Approach 2 begins with the identification of suppliers based on value and volume of transactions. Both approaches incorporate further data points to address the drawback of the model which would not be able to tell us whether a specific good or service with many transactions is actually of significance. Both approaches aim to complement each other and their results can be compared against each other for verification and completeness when drawing the conclusion.
V. RESULTS AND DISCUSSION A. SVP
Approach 1
An examination of the Wordlist generated from all the records, sorted by total number of occurrences and number of documents that contain these words, revealed high occurrences of irrelevant words such as purchase, service, supply, etc. Including these words in the clustering process will affect the results. As such, these words will be identified and added into the “Stopwords” list under “Filter Stopwords (Dictionary)”. The cleaned-up wordlist now presented words such as PhoneX, printer, TabletX, cable, rubber stamp, book, fruit, camera, biscuit, BTH, bowl, certificate, screen, etc. with highest occurrences. This provided a clearer indication of the purchases made and the keywords that should be watch out for in subsequent steps of the analysis.
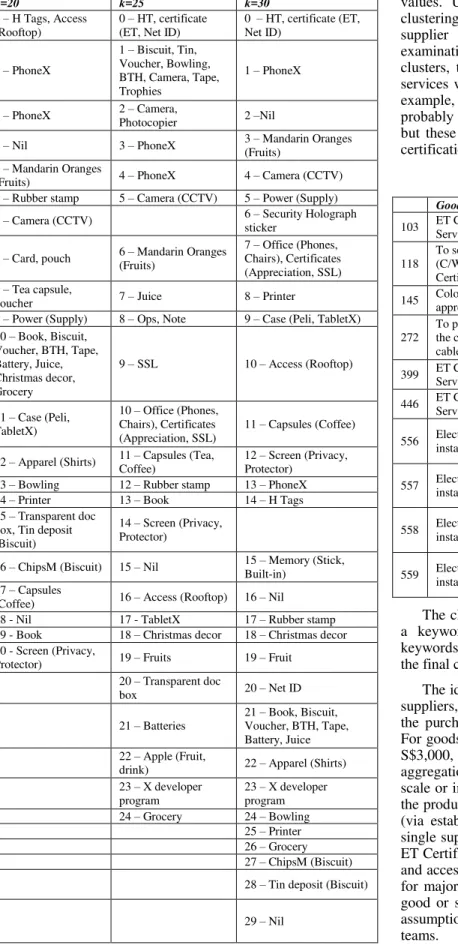
In determining the‘k’ value (i.e. the number of clusters for k-mean clustering), the “rule of thumb” [10] (k=√(n/2) where n is the number of data points) was used as it is a quick and simple method. For 785 records, k=20 was derived. For verification and comparison purposes, additional runs were also made for k=25 and k=30.
Vol. 6, No. 8, 2015 TABLE II. SVP:CENTROID CLUSTER MODEL FOR DIFFERENT “K”
VALUES
k=20 k=25 k=30
0 – H Tags, Access (Rooftop)
0 – HT, certificate (ET, Net ID)
0 – HT, certificate (ET, Net ID)
1 – PhoneX
1 – Biscuit, Tin, Voucher, Bowling, BTH, Camera, Tape, Trophies
1 – PhoneX
2 – PhoneX 2 – Camera,
Photocopier 2 –Nil
3 – Nil 3 – PhoneX 3 (Fruits) – Mandarin Oranges 4 – Mandarin Oranges
(Fruits) 4 – PhoneX 4 – Camera (CCTV) 5 – Rubber stamp 5 – Camera (CCTV) 5 – Power (Supply) 6 – Camera (CCTV) 6 – Security Holograph
sticker 7 – Card, pouch 6 – Mandarin Oranges
(Fruits)
7 – Office (Phones, Chairs), Certificates (Appreciation, SSL) 8 – Tea capsule,
voucher 7 – Juice 8 – Printer
9 – Power (Supply) 8 – Ops, Note 9 – Case (Peli, TabletX) 10 – Book, Biscuit,
Voucher, BTH, Tape, Battery, Juice, Christmas decor, Grocery
9 – SSL 10 – Access (Rooftop)
11 – Case (Peli, TabletX)
10 – Office (Phones, Chairs), Certificates (Appreciation, SSL)
11 – Capsules (Coffee)
12 – Apparel (Shirts) 11 – Capsules (Tea, Coffee)
12 – Screen (Privacy, Protector)
13 – Bowling 12 – Rubber stamp 13 – PhoneX 14 – Printer 13 – Book 14 – H Tags 15 – Transparent doc
box, Tin deposit (Biscuit)
14 – Screen (Privacy, Protector)
16 – ChipsM (Biscuit) 15 – Nil 15 – Memory (Stick, Built-in)
17 – Capsules
(Coffee) 16 – Access (Rooftop) 16 – Nil
18 - Nil 17 - TabletX 17 – Rubber stamp 19 - Book 18 – Christmas decor 18 – Christmas decor 20 - Screen (Privacy,
Protector) 19 – Fruits 19 – Fruit 20 – Transparent doc
box 20 – Net ID
21 – Batteries
21 – Book, Biscuit, Voucher, BTH, Tape, Battery, Juice 22 – Apple (Fruit,
drink) 22 – Apparel (Shirts) 23 – X developer
program
23 – X developer program 24 – Grocery 24 – Bowling
25 – Printer 26 – Grocery 27 – ChipsM (Biscuit) 28 – Tin deposit (Biscuit)
29 – Nil
Cluster for k=25 was selected for further analysis since it covered most of the keywords generated from the different „k‟ values. Using the excel file generated, the results of the clustering is combined with other data fields i.e. amount spent, supplier and buyer details for further analysis. A closer examination of the clusters revealed that for most of the clusters, they were not perfect i.e. not all similar goods and services were grouped together by the clustering process. For example, in Cluster 0 shown in Table 3, the clustering is probably based on the occurrences of the words “Certificate” but these items are distinct, it consist of ET Certificates, HT certification and Electrical Certification.
TABLE III. ITEM IN CLUSTER_0
Goods/Services Amount($) Year Cluster
103 ET Certificate management
Services $1,073.00 2011 Cluster_0
118
To service/recalibrate HT (C/W In-House Calibration Certificate)
$570.00 2011 Cluster_0
145 Color paper for certificate of
appreciation $5.85 2011 Cluster_0
272
To provide LEW service for the certification on the DC cable
$180.00 2011 Cluster_0
399 ET Certificate Management
Services $1,614.00 2011 Cluster_0
446 ET Certificate Management
Services $600.00 2012 Cluster_0
556 Electrical Certification for
installation of ICT equipment $700.00 2012 Cluster_0
557 Electrical Certification for installation of ICT equipment $700.00 2012 Cluster_0
558 Electrical Certification for
installation of ICT equipment $700.00 2012 Cluster_0
559 Electrical Certification for
installation of ICT equipment $700.00 2012 Cluster_0
The clusters would have to undergo further verification by a keyword search of the description field based on the keywords identified. This step is done manually to determine the final clusters.
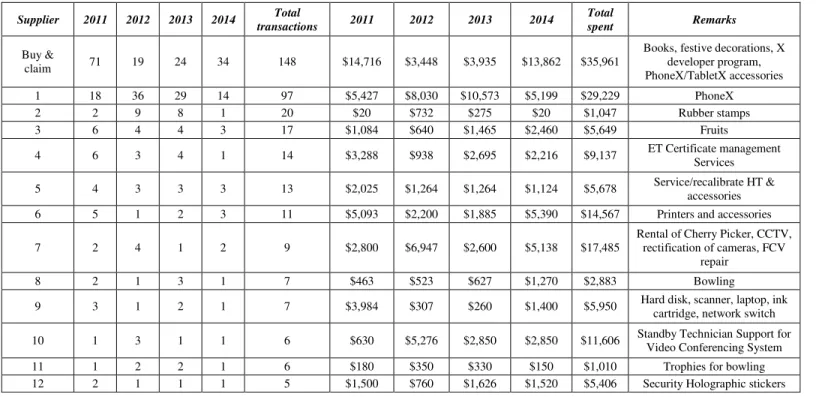
Approach 2
The nature of SVP meant that numerous purchases could be made from one supplier, either within a single year or across different years. The next step is to investigate suppliers from whom purchases were made from them every year. These suppliers, the frequency of the transactions with them, amount spent and the types of goods and services are summarized in Table 5. It is observed that most of the goods and services identified in Approach 2 were all present in Approach 1 except for two main ones, “Standby Technician Support for Video Conferencing System” and “Rental of Cherry Picker”. This is probably because each appeared as one single transaction only in most of the years; hence the term occurrence in the Text Mining analysis was low i.e. it did not feature significantly in the generated Word List or Centroid Cluster Model. However, these observations were noteworthy as they were repeated purchases of relatively significant values in the context of SVP (averaging between S$2,500 and S$2,800) in most years. B. OQ
Approach 1
Similar the approach used in SVP, irrelevant words were removed from the wordlist to improve the result of clustering. The cleaned-up wordlist, sorted in terms of total and document occurrences, now presented words such as licenses, servers, network, CCTV, video, audio, anti-virus, TabletX etc. with highest occurrences.
In determining „k‟ i.e. the number of clusters for k-mean clustering, the “rule of thumb” is used. For 267 records, k=12 was derived. Similarly for verification and comparison purposes, additional runs were also made for k=20 and k=30.
TABLE IV. SVP:RESULT OF APPROACH 1
TABLE V. SVP:RESULT OF APPROACH 2 Clus
ter Good/ Service
No. of suppliers
Freq (Year)
Project Team
(s)
Total amount
1 PhoneX Multiple 11-14 A $28,171
2
Printer and accessories (Toners and cartridges)
Multiple 11-14 A $23,621
3 Fruits & juices Multiple 11-14 B $12,876
4 Vouchers Multiple 11-14 B $8,850
5
Privacy Screen filters and Screen Protectors
Multiple 11-14 A $7,829
6 X developer
program Single 13-14 C $7,452
7 ET Certificates Single 11-14 C $6,953
8
Security Holographic Stickers
Single 11-14 D $5,406
9 Biscuits Multiple 11-14 B $5,316
10 Books Multiple 11-14 G $5,209
11 CCTV Single 11-13 E $4,428
12
Service/recalibra te HT & accessories
Single 11-14 D $3,613
13 Bowling Single 11-14 F $2,823
14 NetID Single 11-13 C $1,673
15 Rubber Stamp Single 11-14 B $1,047 16 Christmas decor Single 11,13-14 B $600 17 Capsules (Coffee and Tea) Multiple 13-14 B $568
Supplier 2011 2012 2013 2014 transactions Total 2011 2012 2013 2014 Total spent Remarks
Buy &
claim 71 19 24 34 148 $14,716 $3,448 $3,935 $13,862 $35,961
Books, festive decorations, X developer program, PhoneX/TabletX accessories
1 18 36 29 14 97 $5,427 $8,030 $10,573 $5,199 $29,229 PhoneX
2 2 9 8 1 20 $20 $732 $275 $20 $1,047 Rubber stamps
3 6 4 4 3 17 $1,084 $640 $1,465 $2,460 $5,649 Fruits
4 6 3 4 1 14 $3,288 $938 $2,695 $2,216 $9,137 ET Certificate management
Services 5 4 3 3 3 13 $2,025 $1,264 $1,264 $1,124 $5,678 Service/recalibrate HT &
accessories
6 5 1 2 3 11 $5,093 $2,200 $1,885 $5,390 $14,567 Printers and accessories
7 2 4 1 2 9 $2,800 $6,947 $2,600 $5,138 $17,485
Rental of Cherry Picker, CCTV, rectification of cameras, FCV
repair
8 2 1 3 1 7 $463 $523 $627 $1,270 $2,883 Bowling
9 3 1 2 1 7 $3,984 $307 $260 $1,400 $5,950 Hard disk, scanner, laptop, ink
cartridge, network switch 10 1 3 1 1 6 $630 $5,276 $2,850 $2,850 $11,606 Standby Technician Support for
Video Conferencing System
11 1 2 2 1 6 $180 $350 $330 $150 $1,010 Trophies for bowling
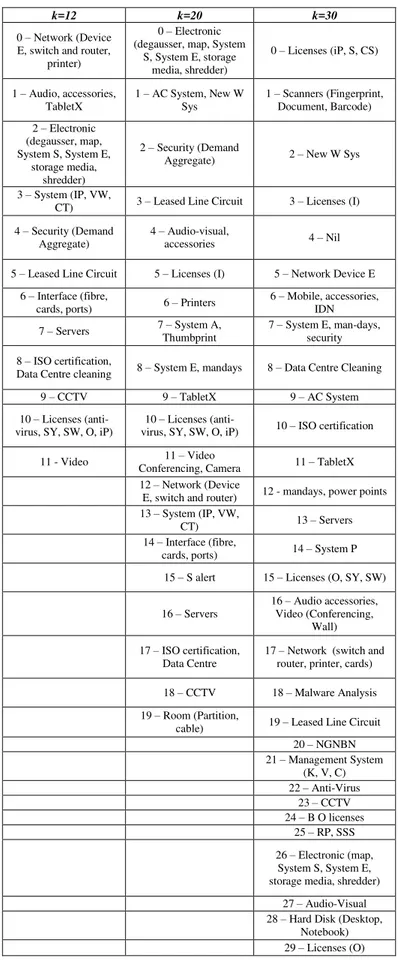
Vol. 6, No. 8, 2015 The Centroid Cluster Model in Table 6 shows the results,
interpreted based on the term frequency of the keywords generated from each cluster (for k= 12, 20 and 30). The results at k=20 and k=30 seem to indicate that the keywords in the majority of the clusters were recurring e.g. licenses, servers, TabletX etc., indicating a strong presence, albeit further breakdown of each into smaller clusters e.g. licenses appeared in Cluster 0,15, 24 and 29 at k=30. New keywords which appeared in the clusters consist of fewer items.
Cluster for k=30 was selected as a basis for further analysis since it covered most of the words generated. The further breakdown of the licenses into smaller clusters was also useful. After the combination of the results of the clustering with other data fields i.e. amount spent, supplier and buyer details for further analysis, a closer examination of the clusters revealed that for most of the clusters, they were not perfect i.e. not all similar goods and services were grouped together by the clustering process – similar to what was observed in SVP.
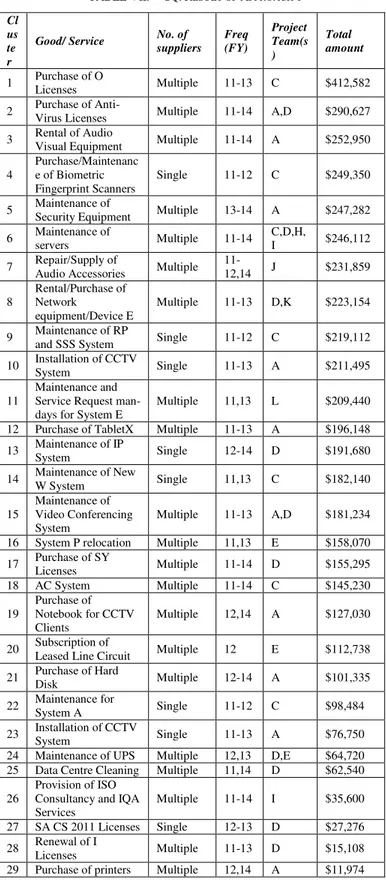
The identified clusters, types of good or service, number of suppliers, frequency of purchases (by year), teams which made the purchases and amount spent are summarized in Table 7. Notwithstanding the fact that Organization X might have already made efforts to consolidate these purchases (some of these purchases did not occur in 2014), for goods and services where total amount spent is more than S$70,000, they present possible opportunities for the aggregation of purchases via OT to achieve economies of scale. It is interesting to note that for majority of the transactions, purchase made for a specific good or service was by a single team, contrary to the earlier assumption that aggregation of purchases could be made across teams. Opportunities for aggregation of purchases across teams include anti-virus licenses, servers, rental of network equipment, maintenance of Video Conferencing System and maintenance of UPS. It was also observed that some of the items that are bought under OQ were also bought under SVP e.g. printer, Hard Disk and TabletX.
Approach 2
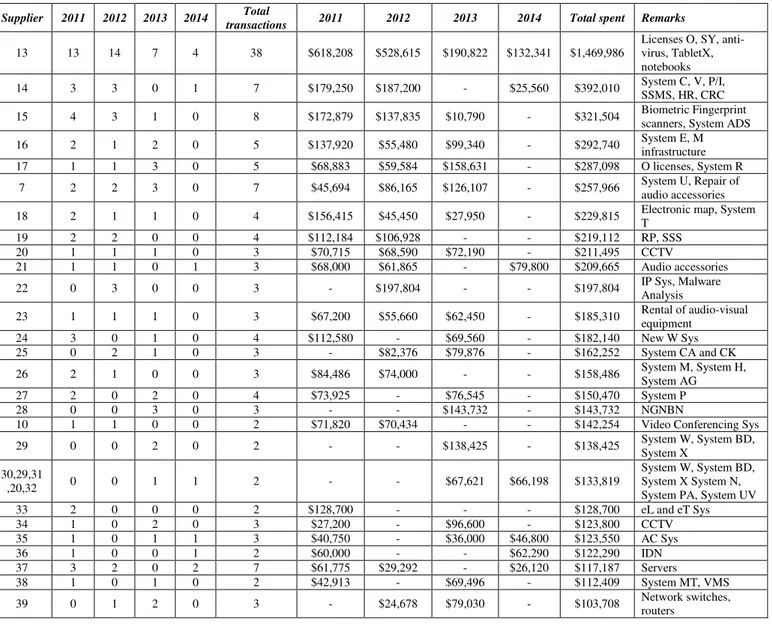
Unlike the SVP, goods and services purchased via an OQ could last for a contractual period beyond one year due to its higher value, for instance, putting in place an ETC where the department could procure directly from the appointed supplier(s) when the product or service is required during the contractual period. Therefore, identifying only suppliers where purchases were made from them every year would not be sufficient. Instead, the cumulative value of the contracts awarded over the period of the four years would be used as a measure to identify suppliers. As a benchmark, a cumulative value of $70,000 is used. These suppliers, sorted by total cumulative amount spent and total number of transactions is shown in Table 8. The remarks column indicated the predominant type of good or service purchased.
It was observed that a specific type of good or service is usually provided by a dominant supplier, more for services than for goods, e.g. supply and maintenance of IT systems. However, it was interesting to note that the different types of software licenses required by different teams are provided predominantly by a single supplier, Supplier 13.
TABLE VI. OQ:CENTROID CLUSTER MODEL FOR DIFFERENT “K”VALUE
k=12 k=20 k=30
0 – Network (Device
E, switch and router, printer)
0 – Electronic
(degausser, map, System S, System E, storage
media, shredder)
0 – Licenses (iP, S, CS)
1 – Audio, accessories,
TabletX
1 – AC System, New W
Sys
1 – Scanners (Fingerprint,
Document, Barcode)
2 – Electronic
(degausser, map, System S, System E,
storage media, shredder)
2 – Security (Demand
Aggregate) 2 – New W Sys
3 – System (IP, VW,
CT) 3 – Leased Line Circuit 3 – Licenses (I)
4 – Security (Demand
Aggregate)
4 – Audio-visual,
accessories 4 – Nil
5 – Leased Line Circuit 5 – Licenses (I) 5 – Network Device E
6 – Interface (fibre,
cards, ports) 6 – Printers
6 – Mobile, accessories,
IDN
7 – Servers 7 – System A,
Thumbprint
7 – System E, man-days,
security
8 – ISO certification,
Data Centre cleaning 8 – System E, mandays 8 – Data Centre Cleaning
9 – CCTV 9 – TabletX 9 – AC System
10 – Licenses
(anti-virus, SY, SW, O, iP)
10 – Licenses
(anti-virus, SY, SW, O, iP) 10 – ISO certification
11 - Video 11 – Video
Conferencing, Camera 11 – TabletX
12 – Network (Device
E, switch and router) 12 - mandays, power points
13 – System (IP, VW,
CT) 13 – Servers
14 – Interface (fibre,
cards, ports) 14 – System P
15 – S alert 15 – Licenses (O, SY, SW)
16 – Servers
16 – Audio accessories,
Video (Conferencing, Wall)
17 – ISO certification,
Data Centre
17 – Network (switch and
router, printer, cards)
18 – CCTV 18 – Malware Analysis
19 – Room (Partition,
cable) 19 – Leased Line Circuit
20 – NGNBN
21 – Management System
(K, V, C)
22 – Anti-Virus
23 – CCTV
24 – B O licenses
25 – RP, SSS
26 – Electronic (map,
System S, System E, storage media, shredder)
27 – Audio-Visual
28 – Hard Disk (Desktop,
Notebook)
Another noteworthy observation was the maintenance of several IT systems by a single supplier, Supplier 14. This provided evidence that there are opportunities for different goods and services to be aggregated to achieve better pricing, contrary to the earlier assumption that aggregation of purchases could be made for similar goods and services only.
Approach 1 was more effective at identifying purchase of common goods and services across different suppliers e.g. for provision of Anti-Virus licenses, Approach 1 identified five different suppliers while Approach 2 identified one only (without going through the entire list of suppliers). Approach 2 was effective at identifying the dominant suppliers and provided insights such as consolidation of different goods and services which would have been missed out using Approach 1. C. ETC
Approach 1
Similar to previous approach, irrelevant words were removed from the wordlist to improve the result of clustering. The cleaned-up wordlist sorted in terms of total and document occurrences, now presented words such as licenses, engineers, engineering and project management, UPS, License I, License O, switch etc. with highest occurrences. This gave a clearer indication of the purchases made and the keywords (items) that should watch out for in subsequent steps of the analysis.
In determining „k‟ i.e. the number of clusters for k-mean clustering, the “rule of thumb” is used. For 118 records, k=8 is used. For verification and comparison purposes, additional runs were also made for k=12 and k=16.
By examining the Centroid Cluster Model in Table 9, the results, interpreted based on the term frequency of the keywords generated from each cluster (for k= 8, 12 and 16), are shown in. The results after runs at k=12 and 16 seem to indicate that the keywords in the majority of the clusters were recurring e.g. licenses, servers, racks, Engineering and Project Management etc., albeit further breakdown of each into smaller clusters e.g. licenses appeared in Cluster 7,8 and 15. At k=16, new keywords which appeared in the clusters consist of fewer items, with quite a few clusters with zero or one item.
Cluster for k=12 was selected as a basis for further analysis since it covered most of the words generated from the different „k‟ values. After the combination of the results of the clustering with other data fields i.e. amount spent, supplier and buyer details for further analysis, a closer examination of the clusters revealed that for most of the clusters, they were not perfect i.e. not all similar goods and services were grouped together by the clustering process – similar to what was observed in SVP and OQ.
TABLE VII. OQ:RESULT OF APPROACH 1 Cl
us te r
Good/ Service No. of suppliers
Freq (FY)
Project Team(s )
Total amount
1 Purchase of O
Licenses Multiple 11-13 C $412,582 2 Purchase of
Anti-Virus Licenses Multiple 11-14 A,D $290,627 3 Rental of Audio Visual Equipment Multiple 11-14 A $252,950
4
Purchase/Maintenanc e of Biometric Fingerprint Scanners
Single 11-12 C $249,350
5 Maintenance of
Security Equipment Multiple 13-14 A $247,282 6 Maintenance of
servers Multiple 11-14
C,D,H,
I $246,112 7 Repair/Supply of
Audio Accessories Multiple
11-12,14 J $231,859 8
Rental/Purchase of Network
equipment/Device E
Multiple 11-13 D,K $223,154
9 Maintenance of RP
and SSS System Single 11-12 C $219,112 10 Installation of CCTV
System Single 11-13 A $211,495
11
Maintenance and Service Request man-days for System E
Multiple 11,13 L $209,440 12 Purchase of TabletX Multiple 11-13 A $196,148 13 Maintenance of IP
System Single 12-14 D $191,680
14 Maintenance of New
W System Single 11,13 C $182,140
15
Maintenance of Video Conferencing System
Multiple 11-13 A,D $181,234 16 System P relocation Multiple 11,13 E $158,070 17 Purchase of SY
Licenses Multiple 11-14 D $155,295 18 AC System Multiple 11-14 C $145,230 19
Purchase of Notebook for CCTV Clients
Multiple 12,14 A $127,030
20 Subscription of
Leased Line Circuit Multiple 12 E $112,738 21 Purchase of Hard
Disk Multiple 12-14 A $101,335
22 Maintenance for
System A Single 11-12 C $98,484
23 Installation of CCTV
System Single 11-13 A $76,750
24 Maintenance of UPS Multiple 12,13 D,E $64,720 25 Data Centre Cleaning Multiple 11,14 D $62,540 26
Provision of ISO Consultancy and IQA Services
Multiple 11-14 I $35,600 27 SA CS 2011 Licenses Single 12-13 D $27,276 28 Renewal of I
Licenses Multiple 11-13 D $15,108
Vol. 6, No. 8, 2015
TABLE VIII. OQ:RESULT OF APPROACH 2
TABLE IX. ETC:CENTROID CLUSTER MODEL FOR DIFFERENT “K”VALUE
k=8 k=12 k=16
0 – Servers, Racks 0 – Network Infrastructure 0 – Engineering and Project Management 1 – Engineering and Project
Management 1 – Office Hour 1 – Nil
2 – Audit, Switch, Network 2 – Audit , SAN 2 – Audit, Switch, Network 3 – SAN, Network and System
Engineer 3 – Licenses (I, H, SM) 3 – SOE
4 – Network 4 – O Licenses 4 – Network equipment 5 – UPS 5 – Network equipment 5 – Desk side Engineer 6 – Office Hour 6 – UPS
6 – Network Attach Storage 7 – Licenses 7 – Engineering and Project
Management 7 – I licenses
8 – COR 8 – O licenses
9 – Nil 9 – Server, Racks
10 - Servers, Racks 10 - UPS
11 – Licenses (SY) 11 – SAN, Network and System Engineer 12 – SOE
13 – COR 14 – Office Hour 15 – Licenses (SY) Supplier 2011 2012 2013 2014 Total
transactions 2011 2012 2013 2014 Total spent Remarks
13 13 14 7 4 38 $618,208 $528,615 $190,822 $132,341 $1,469,986
Licenses O, SY, anti-virus, TabletX, notebooks
14 3 3 0 1 7 $179,250 $187,200 - $25,560 $392,010 System C, V, P/I,
SSMS, HR, CRC 15 4 3 1 0 8 $172,879 $137,835 $10,790 - $321,504 Biometric Fingerprint scanners, System ADS
16 2 1 2 0 5 $137,920 $55,480 $99,340 - $292,740 System E, M
infrastructure
17 1 1 3 0 5 $68,883 $59,584 $158,631 - $287,098 O licenses, System R
7 2 2 3 0 7 $45,694 $86,165 $126,107 - $257,966 System U, Repair of
audio accessories
18 2 1 1 0 4 $156,415 $45,450 $27,950 - $229,815 Electronic map, System
T
19 2 2 0 0 4 $112,184 $106,928 - - $219,112 RP, SSS
20 1 1 1 0 3 $70,715 $68,590 $72,190 - $211,495 CCTV
21 1 1 0 1 3 $68,000 $61,865 - $79,800 $209,665 Audio accessories
22 0 3 0 0 3 - $197,804 - - $197,804 IP Sys, Malware
Analysis
23 1 1 1 0 3 $67,200 $55,660 $62,450 - $185,310 Rental of audio-visual
equipment
24 3 0 1 0 4 $112,580 - $69,560 - $182,140 New W Sys
25 0 2 1 0 3 - $82,376 $79,876 - $162,252 System CA and CK
26 2 1 0 0 3 $84,486 $74,000 - - $158,486 System M, System H,
System AG
27 2 0 2 0 4 $73,925 - $76,545 - $150,470 System P
28 0 0 3 0 3 - - $143,732 - $143,732 NGNBN
10 1 1 0 0 2 $71,820 $70,434 - - $142,254 Video Conferencing Sys
29 0 0 2 0 2 - - $138,425 - $138,425 System W, System BD,
System X 30,29,31
,20,32 0 0 1 1 2 - - $67,621 $66,198 $133,819
System W, System BD, System X System N, System PA, System UV
33 2 0 0 0 2 $128,700 - - - $128,700 eL and eT Sys
34 1 0 2 0 3 $27,200 - $96,600 - $123,800 CCTV
35 1 0 1 1 3 $40,750 - $36,000 $46,800 $123,550 AC Sys
36 1 0 0 1 2 $60,000 - - $62,290 $122,290 IDN
37 3 2 0 2 7 $61,775 $29,292 - $26,120 $117,187 Servers
38 1 0 1 0 2 $42,913 - $69,496 - $112,409 System MT, VMS
39 0 1 2 0 3 - $24,678 $79,030 - $103,708 Network switches,
Similar verification and manipulation of the clusters would have to be adopted similar to what had been prescribed previously. Goods and services available under the ETCs are in general already aggregated. A better understanding of how they were purchased will improve procurement planning and possibly reduce the administrative efforts involved in issuing CFQs e.g. by combining CFQs from teams or multiple year CFQs. However, it is also possible to achieve economies of scale as suppliers are known to offer better pricing than those stated in the ETC.
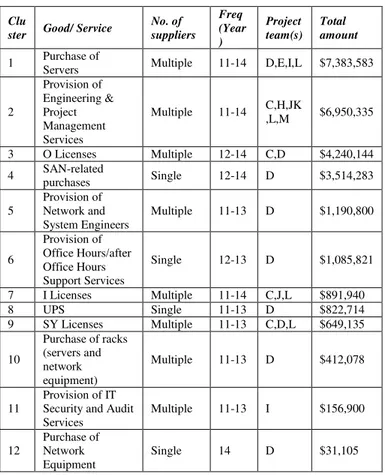
The identified clusters, types of good or service, number of suppliers, frequency of purchases (by year), teams which made the purchases and amount spent are summarized in Table 10. These goods and services present possible opportunities for the aggregation of purchases. It is interesting to note that items which were bought under ETC were also bought under OQ e.g. O and SY licenses. However, it is beyond the scope of this project to investigate the possible reasons for this. There are also possible evidence to suggest efforts made in the aggregation of goods and services e.g. in the OQs, there were rental and purchase of Network equipment made from 2011-13 but this stopped in 2014 and similar purchases were made under ETC in 2014. Another observation is that while there were outright purchases for certain goods in ETCs, the maintenance of similar goods was procured under OQ e.g. servers, UPS. However, there is no evidence to prove that these were the same equipment bought under the ETCs which were later maintained under the contracts established via OQs.
TABLE X. ETC:RESULT OF APPROACH 1 Clu
ster Good/ Service
No. of suppliers
Freq (Year )
Project team(s)
Total amount
1 Purchase of
Servers Multiple 11-14 D,E,I,L $7,383,583
2
Provision of Engineering & Project Management Services
Multiple 11-14 C,H,JK
,L,M $6,950,335
3 O Licenses Multiple 12-14 C,D $4,240,144 4 SAN-related purchases Single 12-14 D $3,514,283
5
Provision of Network and System Engineers
Multiple 11-13 D $1,190,800
6
Provision of Office Hours/after Office Hours Support Services
Single 12-13 D $1,085,821
7 I Licenses Multiple 11-14 C,J,L $891,940
8 UPS Single 11-13 D $822,714
9 SY Licenses Multiple 11-13 C,D,L $649,135
10
Purchase of racks (servers and network equipment)
Multiple 11-13 D $412,078
11
Provision of IT Security and Audit Services
Multiple 11-13 I $156,900
12
Purchase of Network Equipment
Single 14 D $31,105
For majority of the transactions, purchase made for a specific good or service was by a single team, contrary to the earlier assumption that aggregation of purchases could be made across teams. Opportunities for aggregation of purchases across teams to include purchases of licenses (O, I, and SY), servers, Engineering and Project Management Services.
Approach 2
For ETC, the identification of a supplier based on its value and volume of transaction is less relevant in the analysis because it would already have been known upfront at the point where the ETC was established, the goods and services it is offering even before the CFQ was issued. Hence, Approach 2 will not be applicable in the analysis.
VI. CONCLUSION Managerial perspective
The findings suggest that opportunities exist for Organization X to aggregate common goods and services among the purchases made under SVP, OQ and ETC (Table 4, 7 & 10). The analysis further suggests that these opportunities were more prevalent in purchases made by individual project teams rather than across multiple project teams. However, it must be acknowledged that in reality, circumstances such as different timelines/deadlines of projects, unanticipated changes and dynamic requirements from stakeholders make such procurement planning in the short term very challenging. These could be the most likely reasons for the separate transactions for similar goods and services detected. There were some indications suggesting that Organization X has undertaken efforts to consolidate frequent purchases e.g. for recurring purchases of O licenses, rental of network equipment, no such transactions appeared in the 2014 OQ list of transactions while appearing in the 2014 list of ETC transactions.
The results obtained from the analysis should increase Organization X‟s awareness and improve its visibility of the goods and services it has been procuring in recent years. It is recommended that these lists of identified goods and services to be shared with the different project teams to facilitate long-term procurement planning within teams and better synergy in coordinating procurement efforts across teams.
Research perspective
Vol. 6, No. 8, 2015 can create new relationships and hypotheses for further
exploration.
The cluster analysis, while useful in grouping most of the transactions and offered a general overview of the types of goods and services purchased, required further manual manipulation of the clusters to derive more accurate output in order to derive meaningful insights.
Further improvements
To improve the output from the text mining analysis, more efforts could be made to experiment with the various text processing algorithms in the RapidMiner‟s text mining extension. The better the quality of the output i.e. keywords identified, the more accurate the clustering of the records. Data fields such as the account codes could be used to
categorize the records at a broad level before applying the text mining and clustering analysis, improving the semantics of the keywords extracted from the description fields. More clustering algorithms could be applied to compare the accuracy of the clustering output. In this study, only K-means clustering was used.
REFERENCES
[1] Lee, “Procurement lapses in govt agencies raise concern,” Today newspaper article, April 2, 2014, link http://www.todayonline.com/singapore/procurement-lapses-govt-agencies-raise-concern
[2] G. Kemp, “Fighting public sector fraud in the 21st century. Computer Fraud & Security,” vol. 2010, issue 11, pp 16-18, Nov 2010.
[3] A. Byrne, “Government procurement in Western Australia – beyond compliance,” Keeping Good Companies, vol. 65, issue 7, pp 394-399, Aug 2013.
[4] B. Chae and D.L. Olson, “Business Analytics for Supply Chain: A Dynamic-Capabilities Framework,” International Journal of Information Technology & Decision Making, vol. 12, no. 1, pp 9-26, 2013.
[5] National Fraud Authority, “Procurement Fraud in the Public Sector,”
Retrieved from
https://www.gov.uk/government/uploads/system/uploads/attachment_dat a/file/118460/procurement-fraud-public-sector.pdf, Oct 2011.
[6] OECD library, “OECD e-Government Studies: Egypt 2013,” Paris. OECD Publishing DOI: http://dx.doi.org/10.1787/9789264178786-en, 2013.
[7] M. Kantardzic, “Data Mining: Concepts, Models, Methods, and Algorithms, 2nd Ed.,” Wiley-IEEE Press, 2011.
[8] L.S. Chia and C.H. Leo, “Business Intelligence in Government Procurement,” Retrieved from
http://www.dsta.gov.sg/docs/publications-documents/business-intelligence-in-government-procurement.pdf?sfvrsn=0, 2009.
[9] G. Miner, J. Elder, A. Fast, T. Hill, R. Nisbet and D. Delen, “Practical Text Mining and Statistical Analysis for Non-structured Text Data Applications,” Academic Press, Jan 2012