Direct Medical Cost of Type 2 Diabetes in
Singapore
Charmaine Shuyu Ng1, Matthias Paul Han Sim Toh2,3
*, Yu Ko4, Joyce Yu-Chia Lee1 *
1Department of Pharmacy, Faculty of Science, National University of Singapore, Singapore, Singapore,
2Information Management, Central Regional Health Office, National Healthcare Group, Singapore, Singapore,3Saw Swee Hock School of Public Health, National University of Singapore and National University Health System, Singapore, Singapore,4School of Pharmacy, College of Pharmacy, Taipei Medical University, Taipei, Taiwan
*phalycj@nus.edu.sg(JYL);matthias_toh@nhg.com.sg(MPT)
Abstract
Due to the chronic nature of diabetes along with their complications, they have been recog-nised as a major health issue, which results in significant economic burden. This study aims to estimate the direct medical cost associated with type 2 diabetes mellitus (T2DM) in Sin-gapore in 2010 and to examine both the relationship between demographic and clinical state variables with the total estimated expenditure. The National Healthcare Group (NHG) Chronic Disease Management System (CDMS) database was used to identify patients with T2DM in the year 2010. DM-attributable costs estimated included hospitalisations, accident and emergency (A&E) room visits, outpatient physician visits, medications, laboratory tests and allied health services. All charges and unit costs were provided by the NHG. A total of 500 patients with DM were identified for the analyses. The mean annual direct medical cost was found to be $2,034, of which 61% was accounted for by inpatient services, 35% by out-patient services, and 4% by A&E services. Independent determinants of total costs were DM treatments such as the use of insulin only (p<0.001) and the combination of both oral medications and insulin (p=0.047) as well as having complications such as cerebrovascular disease (p<0.001), cardiovascular disease (p=0.002), peripheral vascular disease
(p=0.001), and nephropathy (p=0.041). In this study, the cost of DM treatments and DM-related complications were found to be strong determinants of costs. This finding suggests an imperative need to address the economic burden associated with diabetes with urgency and to reorganise resources required to improve healthcare costs.
Introduction
Globally, the total number of people with diabetes mellitus (DM) is projected to rise from 171 million in 2000 to 366 million in 2030 [1]. There is a growing epidemic of diabetes mellitus, type 2 in particular, in the Asia-Pacific region [2,3]. According to current estimates, the DM population in this region is the largest in the world, with approximately 47.3 million, which is 46% of the global burden of this disease [4]. In Singapore, as in many developed countries, DM OPEN ACCESS
Citation:Shuyu Ng C, Toh MPHS, Ko Y, Yu-Chia Lee J (2015) Direct Medical Cost of Type 2 Diabetes in Singapore. PLoS ONE 10(3): e0122795. doi:10.1371/ journal.pone.0122795
Academic Editor:Ulla Kou Griffiths, London School of Hygiene and Tropical Medicine, UNITED KINGDOM
Received:October 23, 2014
Accepted:February 23, 2015
Published:March 27, 2015
Copyright:© 2015 Shuyu Ng et al. This is an open access article distributed under the terms of the
Creative Commons Attribution License, which permits unrestricted use, distribution, and reproduction in any medium, provided the original author and source are credited.
Data Availability Statement:All relevant data are within the paper.
Funding:This work was supported by a MOH Health Services Research Competitive Research Grant (HSRG/0027/2012). The funders had no role in study design, data collection and analysis, decision to publish, or preparation of the manuscript.
is a growing public health problem. The prevalence of DM has risen to 12.3% in 2013, from 8.2% in 2004 and 9% in 1998 [5–7], surpassing other Asian countries such as Hong Kong (9.5%), Japan (7.2%) and Taiwan (5.7%) [8]. Moreover, DM is the tenth leading cause of death in Singapore, accounting for 1.7% of total deaths in 2011 [9].
Diabetes is a chronic medical condition associated with numerous complications that makes it a substantial economic burden incurred by individuals, healthcare systems and society as a whole [10]. In 2007, the global health expenditure to treat and prevent DM and its compli-cations was estimated to be at least US$232 billion [8]. Depending on available treatments and local prevalence, the direct costs of DM consume from 2.5% to 15.0% of annual healthcare budgets [11].
Despite the large number of people with DM, the financial burden in Singapore attributed to DM has not been investigated. Because type 2 diabetes mellitus (T2DM) accounts for ap-proximately 90% of DM cases and its prevalence increases with ageing, understanding the pat-terns of resource use and cost associated with T2DM is becoming increasingly important for policymakers and budget planners. Therefore, this study aims to identify the total direct medi-cal cost of T2DM in Singapore and to examine the relationship between direct medimedi-cal costs and individual demographic characteristics, DM treatments (exercise or diet, taking oral medi-cations only, taking insulin only and taking both insulin and oral medimedi-cations), disease control, complications and comorbidities.
Methods
Study design
This study adopted a prevalence-based‘epidemiological’approach, employing a bottom-up methodology to estimate different cost components. The prevalence approach can yield more precise estimates because it ascertains the current economic burden of a disease rather than projected ones [12,13]. The perspective for this study was that of the healthcare system (i.e., National Healthcare Group (NHG) institutions). This study was approved by the National Healthcare Group Domain Specific Review Board (NHG-DSRB).
Data source
Patient selection
Patients with T2DM were identified using the International Classification of Diseases Ninth Revision (ICD-9-CM) with diagnostic code of 250 as primary or secondary diagnosis, or using pharmacy medication records or laboratory data in the CDMS. Diabetes complications and co-morbidities were also identified using ICD-9-CM codes, while only DM-related medications and laboratory data were based on inpatient and outpatient encounters at the hospital or out-patient clinics that were registered with the CDMS. Systematic sampling was conducted for 98,592 identified DM patients (i.e., every 197thpatient was selected). Informed consent was not obtained from the patients as the data was de-identified prior to analysis.
This study included patients who satisfied at least one of the following three criteria: (1) as-signed ICD-9-CM code of 250; (2) attended treatment for DM for 1 year in any NHG institu-tion; or (3) prescribed any anti-diabetic medication. Patients with type 1 DM and women with gestational diabetes were excluded.
Laboratory-derived measures related to DM
Measures for DM-related physical examinations were included and categorised as follow: (1) body mass index (BMI) (kg/m2):<18.50 = underweight; 18.50–24.99 = normal;
>25.00 = overweight and obese [16], (2) glycated haemoglobin (HbA1c) (%):7.0 = good dis-ease control; 7.1–8.0 = sub-optimal disease control;>8.0 = poor disease control, (3)
low-density lipoprotein cholesterol (LDL-c) (mmol/L):<2.6 = optimal; 2.6–4.0 = near optimal; >4.0 = high, (4) urine albumin-to-creatinine ratio (UACR) (albumin/24h):<30mg = normal;
30-299mg = microalbuminuria;>300mg = macroalbuminuria [17,18].
Estimation of costs
Direct DM-related costs were classified by the type of service, including inpatient hospitalisa-tion, accident and emergency (A&E) and ambulatory outpatient care (physician visits, allied health visits, laboratory tests and medications). Allied health visits include foot screening, eye screening, dietary services and health education. The total medical costs were estimated by the total before-subsidy charges, which is the total medical bill before any deduction for govern-ment subsidies or insurance claims. All costs reported were in Singapore currency (S$) for year 2010 prices.
The cost of inpatient care and A&E services were estimated by the total charge based on the length of stay and resources used. Any A&E visits that resulted in hospitalisation were included as inpatient care costs. Unit costs used in the estimation of physician visits, which included vis-its to primary care clinics (polyclinics) and specialist outpatient clinics (hospitals), were equal to the standardised rate for physician visits at all NHG primary care clinics and hospitals. Therefore, costs were estimated by multiplying the number of physician visits by the unit cost of a visit. Unit costs for allied health visits, laboratory tests and medications were estimated via the same method as physician visits. The cost for drugs other than anti-diabetic medications was not included. Unit costs for all services rendered were provided by the NHG and are in Sin-gapore dollars. Direct non-medical costs, such as transportation expenses and indirect costs were not included.
Statistical methods
standard deviation and 90thpercentile) were used for demographic information and expendi-tures. To identify the factors affecting total costs, a multiple linear regression model was devel-oped to evaluate the relationship of both demographic and clinical state variables (HbA1c, DM treatments, complications and comorbidities) to the total calculated expenditure. All statistical analyses were performed using SPSS version 21.0 (SPSS Inc., Chicago, IL, USA).
Results
Patient characteristics
A total of 98,592 patients in the NHG CDMS (2010) were identified as patients with DM. After applying the selection criteria and a systematic sampling, 500 patients were included in the analyses. The socio-demographic profile of the patients is shown inTable 1. The patients were equally distributed between the two genders (55.4% female). The mean (±SD) age was 69.0 ± 9.4 years, and most study patients were Chinese (77.6%) and non-smokers (89.8%). Al-though a greater proportion of patients was overweight (42.6%), most had good disease control (44.6%), optimal LDL-c (43.2%) and normal UACR (41.2%). Of the 69.2% of DM patients who were on anti-diabetic medications, the majority used oral medications (57.2%), while only 3% were treated with insulin and the remaining 9% used both insulin and oral medications. Ne-phropathy (57.2%) and cardiovascular conditions (34.2%) were common DM complications among the cohort. The distributions of subgroups were similar between patients with at least one inpatient visit and those without any inpatient visit.
Annual costs of diabetes
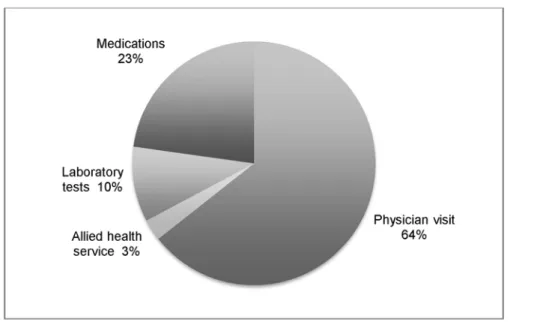
The mean annual direct cost was S$2,034.6 (US$1.0 = S$1.3 as of 31 December 2010) [22], of which S$1,237.2 accounted for by inpatient services, S$84.2 by A&E services and S$713.2 by outpatient services (Table 2). Of the total healthcare expenditure, the main cost driver was in-patient costs (60.8%), while A&E services (4.1%) were only a small portion of the total costs. The major source of costs for outpatient services was physician visits, which accounted for 22.6% of the total healthcare expenditure and 64.0% of total outpatient expenditure (Fig. 1).
Patients with at least one inpatient admission had higher mean total costs (S$8,787.8) than those who had no inpatient admission (S$690.5), with the bulk of costs resulting from inpatient services (S$7,453.3). Conversely, patients with no inpatient visits had a substantially higher proportion of overall outpatient costs.
Factors affecting the total costs
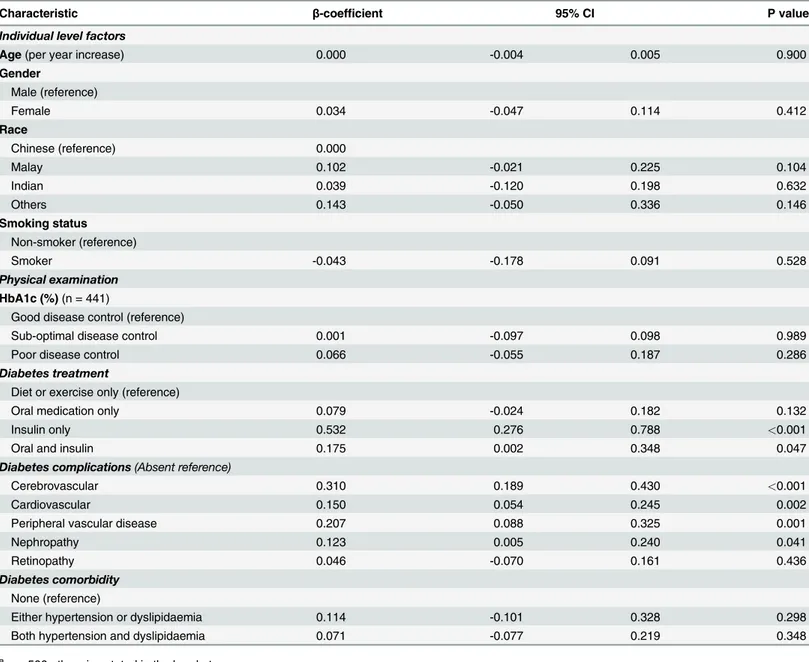
Using multiple linear regression with log transformation, the total cost of DM was significantly associated with DM treatments (taking insulin only or both oral medications and insulin) and DM-related complications (cerebrovascular, cardiovascular, and peripheral vascular diseases and nephropathy). This model explained 23.0% of the variance in costs (Table 3). Age, gender, race, smoking status, disease control, taking only oral medication, having retinopathy and co-morbidities were not independently associated with cost. The combination of oral medications and insulin resulted in an average increment in annual total cost (17.5%, p = 0.047), while the use of only insulin led to a higher increment (53.2%, p<0.001) when compared with patients
Table 1. Socio-demographic and clinical characteristics of patients with diabetes mellitus, CDMS 2010.
Characteristic n (%)aor mean
±standard deviation
Overall (n = 500)b 1 inpatient visit
(n = 83)c 0 inpatient visit(n = 417)d
Individual level factors
Age(years) 69.0 ±9.4 71.7 ±9.5 68.8 ±9.3
Gender
Female 277 (55.4) 45 (54.2) 185 (55.6)
Male 223 (44.6) 38 (45.8) 232 (44.4)
Race
Chinese 388 (77.6) 61 (73.5) 327 (78.4)
Malay 57 (11.4) 10 (12.0) 47 (11.3)
Indian 34 (6.8) 6 (7.2) 28 (6.7)
Others 21 (4.2) 6 (7.2) 15 (3.6)
Smoking status
Non-smoker 449 (89.8) 75 (90.4) 374 (89.7)
Smoker 51 (10.2) 8 (9.6) 43 (10.3)
Physical examination
BMI (kg/m2)(n = 378)1(n = 45)2(n = 333)3 26.1 ±4.7 26.0 ±5.0 26.1 ±4.6
Underweight 7 (1.4) 2 (2.4) 5 (1.2)
Normal 158 (31.6) 16 (19.3) 142 (34.1)
Overweight 213 (42.6) 27 (32.5) 186 (44.6)
Blood pressure (mmHg)(n = 414)1(n = 56)2(n = 358)3
Systolic 132.2 ±14.0 134.9 ±17.1 131.8 ±13.4
Diastolic 70.4 ±7.5 71.2 ±9.3 70.3 ±7.2
HbA1c (%)(n = 441)1(n = 73)2(n = 368)3 7.3 ±1.2 7.3 ±1.5 7.3 ±1.2
Good disease control 223 (44.6) 37 (44.6) 186 (44.6)
Sub-optimal disease control 134 (26.8) 19 (22.9) 115 (27.6)
Poor disease control 84 (16.8) 17 (20.5) 67 (16.1)
LDL-c level (mmol/L)(n = 398)1(n = 61)2(n = 337)3 2.6 ±0.8 2.7 ±1.1 2.6 ±0.7
Optimal 216 (43.2) 35 (42.2) 181 (43.4)
Near optimal 169 (33.8) 23 (27.7) 146 (35.0)
High 13 (2.6) 3 (3.6) 10 (2.4)
Serum creatinine (μmol/L)(n = 424)1(n = 81)2(n = 343)3 102.1 ±87.6 137.0 ±145.4 93.9 ±64.8 UACR(n = 321)1(n = 39)2(n = 282)3
Normal 206 (41.2) 15 (18.1) 191 (45.8)
Microalbuminuria 94 (18.8) 20 (24.1) 74 (17.7)
Macroalbuminuria 21 (4.2) 4 (4.8) 17 (4.1)
Diabetes treatment
Diet or exercise only 154 (30.8) 27 (32.5) 127 (30.5)
Oral anti-diabetic medication only 286 (57.2) 42 (50.6) 244 (58.5)
Insulin only 15 (3.0) 8 (9.6) 7 (1.7)
Oral and insulin 45 (9.0) 6 (7.2) 39 (9.4)
Diabetes complications
Nephropathy 286 (57.2) 63 (75.9) 223 (53.5)
Cardiovascular 171 (34.2) 49 (59.0) 122 (29.3)
Retinopathy 75 (15.0) 24 (28.9) 51 (12.2)
Peripheral vascular disease 73 (14.6) 27 (32.5) 46 (11.0)
Cerebrovascular 71 (14.2) 32 (38.6) 39 (9.4)
Table 1. (Continued)
Characteristic n (%)aor mean
±standard deviation
Overall (n = 500)b 1 inpatient visit
(n = 83)c 0 inpatient visit(n = 417)d
Diabetes comorbidity
Dyslipidaemia 483 (96.6) 77 (92.8) 406 (97.4)
Hypertension 441 (88.2) 81 (97.6) 360 (86.3)
aPercentages may not add up to 100% due to missing values bn = 500 otherwise stated in the brackets
cn = 83 otherwise stated in the brackets dn = 417 otherwise stated in the brackets
BMI = body mass index, HbA1c = glycated haemoglobin, LDL-c = low-density lipoprotein cholesterol, UACR = urine albumin-to-creatinine ratio
doi:10.1371/journal.pone.0122795.t001
Table 2. Direct medical costs of diabetes mellitus paid by the hospital.
Costs variables Total (S$) %a Mean SD Median 90th percentile
Overall (n = 500)
Inpatient costs 618,622.0 60.8 1,237.2 ±4,085.8 0.0 2,846.4
Accident & Emergency 42,084.4 4.1 84.2 ±277.6 0.0 300.4
Outpatient costs 356,600.8 35.1
Physician visit 229,506.0 22.6 459.0 ±396.8 325.0 974.0
Allied health service 10,061.0 1.0 20.1 ±30.0 19.6 40.8
Laboratory tests 35,990.0 3.5 72.0 ±52.5 68.9 114.3
Medications 81,043.9 8.0 162.1 ±220.4 101.0 377.5
Total 1,017,306.2 2,034.6 ±4,351.0 664.1 4,209.6
1 inpatient visit (n = 83)
Inpatient costs 618,621.0 84.8 7,453.3 ±7,395.5 3,740.5 16,858.9
Accident & Emergency 33,745.6 4.6 406.6 ±550.2 301.2 722.4
Outpatient costs 77,021.4 10.6
Physician visit 57,851.0 7.9 697.0 ±479.0 612.0 1,344.4
Allied health service 2,022.9 0.3 24.4 ±50.0 0.0 52.3
Laboratory tests 5,523.2 0.8 66.5 ±63.3 58.2 154.5
Medications 11,624.3 1.6 140.1 ±232.2 62.0 302.4
Total 729,388.0 8,787.8 ±7,660.1 5,160.4 18,322.6
0 inpatient visit (n = 417)
Accident & Emergency 8,338.8 2.9 20.0 ±88.9 0.0 0.0
Outpatient costs 279,579.4 97.1
Physician visit 171,655.0 59.6 411.6 ±360.7 296.0 834.2
Allied health service 8,038.0 2.8 19.3 ±24.1 19.6 35.4
Laboratory tests 30,466.7 10.6 73.1 ±50.1 70.9 108.2
Medications 69,419.6 24.1 166.5 ±218.0 114.7 386.7
Total 287,918.2 690.5 ±481.3 588.2 1,200.6
a
Percentages may not add up to 100% due to missing values
Discussion
This prevalence-based cost-of-illness study involved a large captive population with T2DM in Singapore. The analysis was based on cost and administrative data retrieved from the NHG dis-ease registry for 2010. This is the first study to provide estimates of costs associated with diabe-tes care in Singapore.
The cost per patient estimate in this present study was S$2,034.6 (US$1,575.6), and this ap-pears to be higher than the costs reported in other Asian countries. A study in India reported an estimate of US$525.5 per patient [23], while a study in China reported costs of US$1,501.7 per patient [11] for the management of DM. However, the costs reported in these studies were presented without accounting for inflation or difference between currency. Notably, hospital costs reported in the American and European continents were much higher than those ob-tained in this study [24–26]. Despite the cost differences, inpatient costs still remained the main cost driver of the total estimated expenditure, which was also noted in the earlier DM COI studies [25,27–29]. Although the length of stay (LOS) was not reported in this study, the high cost of inpatient services were often strongly correlated to LOS [30,31], with higher LOS resulting in higher costs. This suggested that attempts to expedite services or reduce unneces-sary utilisation of diagnostic tests to reduce LOS may be worthwhile in reducing overall costs. In terms of outpatients costs, physician services contributed to the bulk of the total expendi-ture in our study, and this was understandable since the growth in the number of physicians and specialists have increased over the years to meet with higher patient demands [32]. In addi-tion, the introduction of new medical technologies and prescription drugs have also shown sig-nificant association with physician cost growth because consumers generally require physician visits to obtain diagnostic tests and prescriptions [32]. Because physicians are central to the healthcare system, efforts to contain physician spending reverberate through all healthcare ser-vices, especially with DM being a chronic condition requiring continuous follow-ups.
Our results from the regression analyses have generally confirmed what might have been ex-pected based on the epidemiologic evidence in the literature [11,20,33–35], that microvascular and macrovascular complications tend to increase the cost of care. On the contrary, comorbidi-ties such as hypertension and dyslipidaemia did not have an association with overall cost. This Fig 1. Components of outpatient costs.
result is surprising since cost-effectiveness and medication adherence studies [36–39] have re-ported that achieving therapeutic clinical parameters would lead to an increase in cost of care albeit increasing the quality-adjusted life years (QALY). A possible explanation could be that hypertension and dyslipidaemia may have been controlled or at a steady state that did not re-quire treatment, resulting in no costs incurred.
In our study, patients with sub-optimal and poor disease control had lower overall costs. This may be due to underutilisation of healthcare services compared to those with good disease control. The importance of managing DM to prevent or delay complications requires effort [40] and good control of DM results in long-term cost savings due to fewer complications [41]. Furthermore, The use of insulin only or both insulin and oral antidiabetic medications were Table 3. Factors influencing the total annual cost of diabetes (n = 500)a.
Characteristic β-coefficient 95% CI P value
Individual level factors
Age(per year increase) 0.000 -0.004 0.005 0.900
Gender
Male (reference)
Female 0.034 -0.047 0.114 0.412
Race
Chinese (reference) 0.000
Malay 0.102 -0.021 0.225 0.104
Indian 0.039 -0.120 0.198 0.632
Others 0.143 -0.050 0.336 0.146
Smoking status
Non-smoker (reference)
Smoker -0.043 -0.178 0.091 0.528
Physical examination HbA1c (%)(n = 441)
Good disease control (reference)
Sub-optimal disease control 0.001 -0.097 0.098 0.989
Poor disease control 0.066 -0.055 0.187 0.286
Diabetes treatment
Diet or exercise only (reference)
Oral medication only 0.079 -0.024 0.182 0.132
Insulin only 0.532 0.276 0.788 <0.001
Oral and insulin 0.175 0.002 0.348 0.047
Diabetes complications(Absent reference)
Cerebrovascular 0.310 0.189 0.430 <0.001
Cardiovascular 0.150 0.054 0.245 0.002
Peripheral vascular disease 0.207 0.088 0.325 0.001
Nephropathy 0.123 0.005 0.240 0.041
Retinopathy 0.046 -0.070 0.161 0.436
Diabetes comorbidity
None (reference)
Either hypertension or dyslipidaemia 0.114 -0.101 0.328 0.298
Both hypertension and dyslipidaemia 0.071 -0.077 0.219 0.348
a
n = 500 otherwise stated in the brackets HbA1c = glycated haemoglobin
found to be associated with higher costs. Consistent with other studies, the most expensive component of total outpatient costs after physician costs were medications [24,25,29,42]. This rise in cost indicated a growth in the consumption of prescription medications, which may be due to increase adherence to medications. Evidence has shown that better adherence results in better healthcare outcomes and reduces the need for physician visits [43,44], and lead to a net decrease in overall healthcare cost.
As a prevalence-based cost-of-illness study, the strength of this study was that all DM cases were included from a specified year, regardless of whether or not they were diagnosed before or during that year. This breadth allows for analysis of patients at various stages of the illness, since different severities of DM may be associated with different costs. However, there were several limitations in this study. First, data was drawn from a healthcare database, hence relied on the accuracy and completeness of the records. The NHG CDMS has, however, been used in several studies and is recognised for providing well-validated and comprehensive data [14,45]. Second, patients with undiagnosed diabetes as well as indirect/intangible costs and out-of-pocket expenses were not included, which may contribute to an underestimation of the true cost of diabetes. Lastly, the study population was relatively small and limited to the public healthcare sector in Singapore. Future studies may consider these shortcomings to further as-sess different aspects of diabetes costs.
Conclusion
This study provided a comprehensive cost analysis of expenditures incurred in the treatment of DM in Singapore. The results indicated that both medications and DM complications were strong determinants of costs. With projected increase in diabetes prevalence coupled with obe-sity and growing need for medical treatment in Singapore, diabetes will continue to be a heavy burden on health budgets. Therefore, evidence on the economic burden related to diabetes-related complication and its drives are indispensable for a health-system reform that seeks to minimise the long-term economic burden of this growing epidemic.
Author Contributions
Conceived and designed the experiments: CSN YK MPT. Performed the experiments: CSN. Analyzed the data: CSN YK JYL MPT. Contributed reagents/materials/analysis tools: CSN. De-signed the study: CSN YK MPT. Performed the analysis and prepared the manuscript: CSN. Provided data analysis advice and revision of the final manuscript: YK JYL MPT. Read and ap-proved the manuscript: CSN YK JYL MPT.
References
1. World Health Organisation, International Diabetes Federation. Diabetes action now: An initiative of the World Health Organisation and the International Diabetes Federation. WHO, 2004.
2. Fujimoto WY. The growing prevalence of non-insulin-dependent diabetes in migrant Asian populations and its implications for Asia. Diabetes Res Clin Pract. 1992; 15(2):167–83. PMID:1563334
3. Leung G, Lam K. Diabetic complications and their implications on health care in Asia. HKMJ. 2000; 6:61–8. PMID:10793404
4. Amos AF, McCarty DJ, Zimmet P. The rising global burden of diabetes and its complications: estimates and projections to the year 2010. Diabet Med. 1997;14 Suppl 5: :S1–85.
5. Health Promotion Board. Information Paper On Diabetes In Singapore. 2011 [cited 2014 April 23]; Available from:http://www.nrdo.gov.sg/uploadedFiles/NRDO/Publications/%28INP-11-7%29 20111103 Diabetes Information Paper 2011.pdf.
7. Ministry of Health Singapore. Disease burden. 2014 [cited 2014 December 09]; Available from:http:// www.moh.gov.sg/content/moh_web/home/statistics/Health_Facts_Singapore/Disease_Burden.html.
8. International Diabetes Federation. Diabetes Atlas Brussels, Belgium: International Diabetes Federa-tion, 2006.
9. Yeo D. Coping with a lifelong disease. Singapore Health. 2013.
10. Ettaro L, Songer TJ, Zhang P, Engelgau MM. Cost-of-illness studies in diabetes mellitus. Pharmacoe-conomics. 2004; 22(3):149–64. PMID:14871163
11. Wang W, McGreevey WP, Fu C, Zhan S, Luan R, Chen W et al. Type 2 diabetes mellitus in China: a preventable economic burden. Am J Manag Care. 2009; 15(9):593–601. PMID:19747024
12. World Health Organisation. WHO Guide to Identifying the Economic Consequences of Disease and In-jury. Geneva, Switzerland: WHO, 2009.
13. Tarricone R. Cost-of-illness analysis. What room in health economics? Health Policy. 2006; 77(1):51–63. PMID:16139925
14. Wu C, Tan W, Toh M, Heng B. Derivation and validation of a risk index to predict all-cause mortality in type 2 diabetes mellitus. Journal of Endocrinology and Metabolism. 2012; 2(2):88–95.
15. Toh MP, Leong HS, Lim BK. Development of a diabetes registry to improve quality of care in the Nation-al HeNation-althcare Group in Singapore. Ann Acad Med Singapore. 2009; 38(6):546–6. PMID:19565107
16. World Health Organisation. BMI classification—global database on body mass index. 2006 [cited 2014 April 4]; Available from:http://apps.who.int/bmi/index.jsp?introPage = intro_3.html.
17. Ministry of Health Singapore. Clinical practice guidelines—diabetes mellitus. Singapore. 2006 [cited 2014 June 05]; Available from:http://www.moh.gov.sg/content/dam/moh_web/HPP/Doctors/cpg_ medical/withdrawn/cpg_DiabetesMellitus-Jun 2006.pdf.
18. National Healthcare Group Polyclinic. Diabetes mellitus. In: Leong H, Lee C, editors. Singapore. 2010.
19. Javanbakht M, Baradaran H, Mashayekhi A, Haghdoost A, Khamseh M, Kharazmi E et al. Cost-of-illness analysis of type 2 diabetes mellitus in Iran. PLoS ONE. 2011; 6(10):e26864. doi:10.1371/ journal.pone.0026864PMID:22066013
20. Fu AZ, Qiu Y, Radican L, Wells B. Health care and productivity costs associated with diabetic patients with macrovascular comorbid conditions. Diabetes Care. 2009; 32:2187–92. doi:10.2337/dc09-1128 PMID:19729528
21. Johnson RA, Wichern DW. Applied multivariate statistical analysis. 3rd ed. Englewood Cliffs, NJ: Prentice-Hall; 1992.
22. OANDA Corporation. Currency converter. New York, NY: OANDA Corporation [cited 2014 March 31]; Available from:http://www.oanda.com/currency/converter/.
23. Tharkar S, Devarajan A, Kumpatla S, Viswanathan V. The socioeconomics of diabetes from a develop-ing country: a population based cost of illness study. Diabetes Res Clin Pract. 2010; 89:334–40. doi: 10.1016/j.diabres.2010.05.009PMID:20538363
24. American Diabetes Association. Economic costs of diabetes in the U.S. In 2007. Diabetes Care. 2008; 31:596–615. doi:10.2337/dc08-9017PMID:18308683
25. Koster I, Huppertz E, Hauner H, Schubert I. Direct costs of diabetes mellitus in Germany—CoDiM 2000–2007. Exp Clin Endocrinol Diabetes. 2011; 119:377–85. doi:10.1055/s-0030-1269847PMID: 21264804
26. Solli O, Jenssen T, Kristiansen I. Diabetes: cost of illness in Norway. BMC Endocrine Disorders. 2010; 10(1):15.
27. Tao B, Pietropaolo M, Atkinson M, Schatz D, Taylor D. Estimating the cost of type 1 diabetes in the U.S.: a propensity score matching method. PLoS One. 2010; 5(7):e11501. doi:10.1371/journal.pone. 0011501PMID:20634976
28. Tunceli O, Wade R, Gu T, Bouchard JR, Aagren M, Luo W. Cost of diabetes: comparison of disease-attributable and matched cohort cost estimation methods. Curr Med Res Opin. 2010; 26(8):1827–34. doi:10.1185/03007995.2010.488544PMID:20491613
29. Esteghamati A, Khalilzadeh O, Anvari M, Meysamie A, Abbasi M, Forouzanfar M et al. The economic costs of diabetes: a population-based study in Tehran, Iran. Diabetologia. 2009; 52:1520–7. doi:10. 1007/s00125-009-1398-4PMID:19475364
30. Asil T, Celik Y, Sut N, Celik AD, Balci K, Yilmaz A et al. Cost of acute ischemic and hemorrhagic stroke in Turkey. Clin Neurol Neurosurg. 2011; 113:111–4. doi:10.1016/j.clineuro.2010.09.014PMID: 21036465
32. Koenig L, Siegel JM, Dobson A, Hearle K, Ho S, Rudowitz R. Drivers of healthcare expenditures asso-ciated with physician services. Am J Manag Care. 2003;9(1: ):SP34–42.
33. Bertoni AG, Krop JS, Anderson GF, Brancati FL. Diabetes-related morbidity and mortality in a national sample of U.S. elders. Diabetes Care. 2002; 25(3):471–5. PMID:11874932
34. Zhuo X, Zhang P, Hoerger TJ. Lifetime direct medical costs of treating type 2 diabetes and diabetic complications. American Journal of Preventive Medicine. 2013; 45(3):253–61. doi:10.1016/j.amepre. 2013.04.017PMID:23953350
35. Bahia L, Araujo D, Schaan B, Dib S, Negrato C, Leao M et al. The costs of type 2 diabetes mellitus out-patient care in the Brazilian public health system. Value in Health. 2011; 14:S137–S40. doi:10.1016/j. jval.2011.05.009PMID:21839888
36. Grover S, Coupal L, Lowensteyn I. Preventing cardiovascular disease among Canadians: is the treat-ment of hypertension or dyslipidemia cost-effective? Can J Cardiol. 2008; 24(12):891–8. PMID: 19052668
37. Nasseh K, Frazee S, Visaria J, Vlahiotis A, Tian Y. Cost of medication nonadherence associated with diabetes, hypertension, and dyslipidemia. Am J Pharm Benefits. 2012; 4(2):e41–e7.
38. American Diabetes Association. Treatment of hypertension in adults with diabetes. Diabetes Care. 2003; 26(suppl 1):s80–s2. PMID:12502624
39. Jellinger PS, Smith DA, Mehta AE, Ganda OM, Handelsman Y, Rodbard HW et al. American Associa-tion of Clinical Endocrinologists' guidelines for management of dyslipidemia and prevenAssocia-tion of athero-sclerosis. Endocr Pract. 2012; 18 (Suppl 1):1–78. PMID:22522068
40. International Diabetes Federation. IDF—Global diabetes plan 2011–2021. Brussels, Belgium: Interna-tional Diabetes Federation, 2010.
41. Clarke P, Gray A, Legood R, Briggs A, Holman R. The impact of diabetes-related complications on healthcare costs: results from the United Kingdom Prospective Diabetes Study (UKPDS Study No. 65). Diabet Med. 2003; 20(6):442–50. PMID:12786677
42. Abdulkadri A, Cunningham-Myrie C, Forrester T. Economic burden of diabetes and hypertension in Caricom States. Social and Economic Studies. 2009;58(3/4: ):175–97.
43. Eaddy MT, Cook CL, O’Day K, Burch SP, Cantrell CR. How patient cost-sharing trends affect adher-ence and outcomes a literature review. P&T. 2012; 37(1):45–55.
44. Cheng SH, Chen CC, Tseng CH. Does medication adherence lead to ower healthcare expenses for pa-tients with diabetes? Am J Manag Care. 2013; 19(8):662–77. PMID:24304214