www.clim-past.net/10/771/2014/ doi:10.5194/cp-10-771-2014
© Author(s) 2014. CC Attribution 3.0 License.
Climate
of the Past
What controls deuterium excess in global precipitation?
S. Pfahl and H. Sodemann
Institute for Atmospheric and Climate Science, ETH Zurich, 8092 Zurich, Switzerland
Correspondence to:S. Pfahl ([email protected]) and H. Sodemann ([email protected]) Received: 25 July 2013 – Published in Clim. Past Discuss.: 14 August 2013
Revised: 20 February 2014 – Accepted: 2 March 2014 – Published: 22 April 2014
Abstract. The deuterium excess (d) of precipitation is widely used in the reconstruction of past climatic changes from ice cores. However, its most common interpretation as moisture source temperature cannot directly be inferred from present-day water isotope observations. Here, we use a new empirical relation between d and near-surface relative hu-midity (RH) together with reanalysis data to globally pre-dictd of surface evaporation from the ocean. The very good quantitative agreement of the predicted hemispherically av-eraged seasonal cycle with observedd in precipitation in-dicates that moisture source relative humidity, and not sea surface temperature, is the main driver of d variability on seasonal timescales. Furthermore, we review arguments for an interpretation of long-term palaeoclimaticd changes in terms of moisture source temperature, and we conclude that there remains no sufficient evidence that would justify to neglect the influence of RH on such palaeoclimaticd vari-ations. Hence, we suggest that either the interpretation of
d variations in palaeorecords should be adapted to reflect climatic influences on RH during evaporation, in particular atmospheric circulation changes, or new arguments for an interpretation in terms of moisture source temperature will have to be provided based on future research.
1 Introduction
Stable water isotopes in atmospheric waters are useful trac-ers of the global hydrological cycle (Dansgaard, 1964; Gat, 1996), and their conservation in proxy archives like ice cores and cave deposits is essential for the reconstruction of past climates (e.g. Jouzel et al., 1982; Dansgaard et al., 1993; Meckler et al., 2012). The deuterium excess, defined asd=
δD−8δ18O (whereδD andδ18O denote the deuterium and oxygen-18 abundance relative to VSMOW – Vienna Stan-dard Mean Ocean Water), is a second-order isotope
param-eter that is specifically sensitive to the conditions during the evaporation of water from the (ocean) surface, i.e. the mois-ture source conditions (Merlivat and Jouzel, 1979; Johnsen et al., 1989; Pfahl and Wernli, 2008). Accordingly,d vari-ations in ice cores and other palaeoclimatic proxy archives are thought to reflect past changes in these source conditions (Jouzel et al., 1982, 2007; Vimeux et al., 1999; Stenni et al., 2001; Masson-Delmotte et al., 2005; Steffensen et al., 2008). Deuterium excess has become a key parameter for studying climate variations, in particular abrupt events recorded in the proxy data (Jouzel et al., 2007; Steffensen et al., 2008). In stable isotope data from Greenland ice cores, rapid (1–3 yr) changes indhave been interpreted as fast reorganisations in the atmospheric circulation associated with changes in the moisture source conditions (Steffensen et al., 2008) and/or locations (Masson-Delmotte et al., 2005). Despite the gen-eral sparsity of isotope measurements in evaporating waters a theoretical framework for the interpretation of d exists, which is briefly revisited in the following.
Physically, the deuterium excess reflects the slower move-ment of the H218O molecule during diffusion, leading to
a relative enrichment of the HDO molecules in the less strongly bound phase (e.g. in the gas phase during the evap-oration of water). This slower movement can only lead to measurable differences if there is not sufficient time for the two phases to reach isotopic equilibrium. During evapora-tion, such non-equilibrium conditions are caused by a strong gradient in relative humidity above the water surface, and by winds that advect the evaporate away from the surface before (near-)equilibrium conditions between the two phases can be reached. Following Craig and Gordon (1965) and Merlivat and Jouzel (1979), the isotopic compositionδiEof water evap-orating from the ocean for the isotopic speciesi(i=18O, D) can be expressed as
1+δEi =(1−ki)
α−i 1−RH(1+δvi)
where RH is the relative humidity with respect to saturation at the sea surface,δvi is the isotopic composition of the sur-rounding vapour for speciesi,kiis the non-equilibrium (dif-fusive) fractionation factor, andαi is the equilibrium frac-tionation factor. Sea surface temperature (SST) can influence
d via this temperature-dependent equilibrium fractionation factor. The exact formulation of the non-equilibrium frac-tionation factor as a function of wind speed and potentially temperature is still under discussion (Pfahl and Wernli, 2009; Luz et al., 2009). For analysing variations of d on global scales, Merlivat and Jouzel (1979) introduced a global clo-sure assumption in which the isotopic composition of the sur-rounding vapourδvi was assumed to be equal to the isotopic composition of global precipitation, which in turn equals the isotopic composition of global evaporation. This allowed to derive a simplified expression for the isotope ratio in water vapour from evaporation:
δvi =αi−1 1−ki
1−kiRH
−1. (2)
However, as pointed out by Jouzel and Koster (1996), this global closure assumption is typically invalid at local scales. Jouzel and Koster (1996) recommend to use climate model data forδvi in Eq. (1). Nevertheless, climate models are also associated with uncertainties regarding the representation of
d (Yoshimura et al., 2008; Risi et al., 2010; Jouzel et al., 2007). Equation (2) can be combined for both isotopes to obtain an expression ford in boundary layer water vapour and thus (implying global closure) in water evaporating from the ocean. Using a simple Rayleigh condensation model, Merlivat and Jouzel (1979) derived a strong dependency of
d on RH in the so-called first condensate, the initial precip-itation, while the influence of evaporation temperature re-mained indistinguishable. The later study by Johnsen et al. (1989) directly used the isotopic composition derived from the global closure (Eq. 2) to estimatedlocally at an assumed fixed moisture source for Greenland from monthly mean RH and SST values. Thereby simple linear relations were derived between changes in RH and SST andd in the water evapo-rating from the ocean:
1d
1SST= +0.35 ‰d
K SST,
1d
1RH= −0.43 ‰d
% RH. (3)
RH is a direct factor of influence in Eq. (2), while SST affects the temperature-dependent equilibrium fractionation factors
αi. According to Eq. (3)d becomes higher with increasing SST and lower with increasing RH, with constants of propor-tionality of comparable magnitude. Nevertheless, on synop-tic timescales, the dependence ofd on SST is substantially weaker than on RH, because the variability of RH in per-centages typically is much larger than the variability of SST in kelvin. It is common to most studies until now that RH
has been considered at relatively long averaging times, com-pared to the timescale at which evaporation actually takes place, thereby substantially underestimating the variability of RH. From their study with an idealised model, and using monthly mean data for the initialisation, Johnsen et al. (1989) concluded that SST and RH changes could both play a role for d variations observed in a Greenland ice core. Noting that GCM (global circulation model) simulations show only small glacial-to-interglacial changes in mean oceanic RH, it has been proposed thatd in Antarctic ice core records can be interpreted as a moisture source SST signal only (Vimeux et al., 1999; Stenni et al., 2001; Uemura et al., 2012), revok-ing the earlier interpretation as a proxy of moisture source RH (Jouzel et al., 1982). This interpretation as source SST has later been extended also to Greenland ice cores (Masson-Delmotte et al., 2005). In recent climate model studies, Lewis et al. (2013) and Risi et al. (2013) investigated the relation-ship betweend and moisture source conditions on different timescales. Lewis et al. (2013) focused on the role of SST, but noted that source RH changes might introduce errors in thed–SST relation. Risi et al. (2013) discussed several fac-tors controllingd variations, including moisture source RH and SST, and emphasised the potential impacts of model un-certainties for the interpretation of these variations.
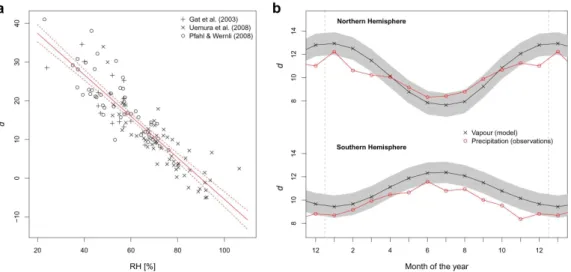
Recent measurements ofdin boundary layer water vapour consistently show that at synoptic timescales (from hours to days), RH above the ocean surface is highly anti-correlated withd in atmospheric water vapour (Gat et al., 2003; Ue-mura et al., 2008; Angert et al., 2008; Pfahl and Wernli, 2008; Kurita, 2011). Interestingly, when plotted together against source RH, the d measurements from these studies (Gat et al., 2003; Uemura et al., 2008; Angert et al., 2008; Pfahl and Wernli, 2008) fall on one line (Fig. 1a) although they are from such different geographical regions as the South-ern Ocean and the Mediterranean, span a wide range of evaporation conditions, and have been obtained with dif-ferent approaches (see Sect. 2). This indicates that these d
measurements above the ocean are directly related to d of the evaporation flux. Consistently with theoretical consider-ations (Merlivat and Jouzel, 1979; Craig and Gordon, 1965), these data point to a dominant, universal relationship be-tweend of water evaporating from the ocean and the cor-responding near-surface RH. In this study, we apply this re-lationship in a linear statistical model to globally predictd
of the evaporating water. In this way, we avoid the global closure assumption inherent in simple theoretical evaluations (see again Eq. 2) and the uncertainties related to the represen-tation ofd in climate models. By using six-hourly RH from ERA-Interim reanalyses (Dee et al., 2011) as predictor, the model explicitly considers the synoptic-scale processes that drive short-term RH variations. On these timescales, RH and wind speed are the main factors determining oceanic evap-oration. The empirical relation applied in our model relates
Fig. 1.Deuterium excessdof water vapour and precipitation.(a)Scatter plot of water vapourdfrom several published data sets (Gat et al., 2003; Uemura et al., 2008; Pfahl and Wernli, 2008) against RH at the oceanic moisture source. The solid red line indicates a linear regression,
which is used for the calculation of moisture sourcedin our statistical model, the dashed lines show the uncertainty of this regression based
on a 95 % confidence interval.(b)Seasonal cycle ofdin ocean evaporation (black crosses and gray shading), as obtained from the linear
regression model based on reanalysis RH, averaged over the Northern and Southern hemispheres. Red circles show hemispherically averaged
dof precipitation from GNIP stations.
By comparing the predicted d in evaporation with d mea-surements in precipitation, we evaluate the relevance of the
d–RH relationship for global precipitation data.
2 Data and methods
The statistical model that relates the deuterium excess of wa-ter evaporating from the ocean to the near-surface RH is based on several sets of measurements ofd in atmospheric water vapour from the literature (Gat et al., 2003; Uemura et al., 2008; Angert et al., 2008). Gat et al. (2003) per-formed daily measurements of the isotopic composition of near-surface water vapour on board a ship during a 1 month cruise over the Mediterranean Sea in 1995. The measure-ments were done at mast and deck height, and the deck data have been used here. Furthermore, measurements have been discarded if precipitation occurred in the vicinity of the ship. Uemura et al. (2008) also measured isotopes in vapour on board a ship, with a measurement frequency of 2–3 times per day. Their cruise took place over the Southern Ocean, from South Africa towards Antarctica and to Australia, in January 2006. Angert et al. (2008) performed isotope measurements in water vapour over 9 yr (sampling about two times a week) at a near-coastal site in Rehovot, Israel. Here only those data have been used for which most of the sampled vapour could be traced back to oceanic evaporation sources with the tra-jectory method of Pfahl and Wernli (2008). RH is defined with respect to saturation at the sea surface here (as in Eq. 1), i.e. RH=q/qsat(SST), whereq denotes the specific
humid-ity above the ocean surface, andqsat(SST)is the saturation
humidity at the surface. For ship data from the Mediterranean
(Gat et al., 2003) and the Southern Ocean (Uemura et al., 2008),qand SST have been used as observed in situ. For the station data from Israel (Angert et al., 2008),q and SST in the moisture source regions were reconstructed by means of a trajectory method (see again Pfahl and Wernli, 2008). The very good correlation between measuredd in water vapour over the ocean and the locally observed RH shown in Fig. 1a indicates that thedmeasurements are directly representative fordof the evaporation flux, which is known to be controlled by RH due to physical reasons: during dry conditions, there is a larger humidity gradient between the saturated layer di-rectly at the ocean surface and the sub-saturated atmosphere above, leading to strong non-equilibrium fractionation and thus a high value ofd in the evaporating moisture. The as-sociation of vapour measurements with evaporationdis fur-ther supported by the very good agreement of the in situ data with the reconstructed evaporation conditions of Pfahl and Wernli (2008) (see again Fig. 1a), and the fact that Uemura et al. (2008) have been able to explain most of the variability in their data set by applying this closure assumption. Note, however, that in general vapour and evaporationd at a fixed location can be different (Jouzel and Koster, 1996), and the application of vapour measurements as a proxy for evapora-tiondmay be a potential source of error.
A linear regression has been used to model the relation-ship between d in ocean evaporation and the near-surface RH, as indicated by the solid red line in Fig. 1a, which corresponds to the equationd=48.2 ‰−0.54 ‰ %−1RH.
using RH from meteorological reanalysis data as input. To this end, six-hourly, global fields of specific humidity at 2 m above the surface (calculated from 2 m temperature and dew point temperature) and SST for the period 1979–2010 have been obtained from ECMWF (European Centre for Medium-Range Weather Forecasts) ERA-Interim reanalyses (Dee et al., 2011). The data have been interpolated to a 1◦
×1◦ spatial grid. RH above the ocean surface has then been cal-culated as described above. In addition, sea ice cover, sur-face latent heat flux (which is proportional to sursur-face evap-oration) and land surface temperature have also been taken from the reanalysis data. The latent heat flux (LHF) is a fore-cast field, and forefore-cast steps from 6 to 12 and 12 to 18 h are used, neglecting the first 6 h because of possible model spin-up effects. Near-surface humidity is reasonably well repre-sented in the ERA-Interim data (Simmons et al., 2010; Pfahl and Niedermann, 2011), and using such a reanalysis data set is decisive because of the best possible spatial and tempo-ral coverage it offers. The linear regression model described above has been applied to calculated of water evaporating from the ocean for each six-hourly time step and each grid point, taking the reanalysis RH as input. The uncertainty of the linear regression is used as an uncertainty estimate for predicted d. Note that this estimate does not account for the uncertainties of the individuald and RH measurements and should thus be considered as lower bound of the model uncertainty. Taking errors of individual data points into ac-count is hardly possible, since these depend on various fac-tors such as the related moisture source footprint. Climato-logical means ofd have been obtained at every grid point and for each month and season by averaging the correspond-ing six-hourly values, weighted with the six-hourly surface latent heat flux. Finally, hemispheric means have been cal-culated by averaging d over all grid boxes in the respec-tive hemisphere, weighted with the grid box surface area and mean latent heat flux. The weighting with latent heat flux (or, equivalently, surface evaporation) is necessary to com-pare with the precipitation-weighted GNIP data (see below) and to close thedbudget of the atmospheric water cycle.
In order to evaluate our model, measurements of d in monthly precipitation from the Global Network of Isotopes in Precipitation (GNIP) (IAEA, 2006; Araguás-Araguás et al., 2000) have been employed. All stations have been con-sidered for which at least 36 months of data of δD,δ18O and precipitation amount were available during the period 1960–2009. Precipitation-weighted climatological means of
dfor every calendar month and season have been calculated at each station with at least three observations from the re-spective month, or nine from the rere-spective season. To ob-tain hemispheric means of d in precipitation, station data have first been averaged over 10◦
×10◦
grid boxes, then the grid box mean values have been averaged zonally and merid-ionally, weighted by the grid box sizes and mean precipita-tion amounts. The hemispheric means obtained in this way are in good agreement with the results of Araguás-Araguás
et al. (2000), who used a similar dataset. To first order, one can assume that moisture exchange between the hemispheres is negligible, because mean moisture fluxes in most tropical regions and seasons have a much larger zonal than merid-ional component (e.g. Trenberth, 1999). Therefore, the hemi-spheric means ofd in precipitation and ocean evaporation, according to the global closure assumption (see Sect. 1), should be equal when averaged over sufficiently long time periods. However, the tropical monsoon systems, in partic-ular the Indian summer monsoon, do in fact lead to a net inter-hemispheric moisture transport. This is a potential error source in the comparison of hemispherically averaged model results and observations.
3 Results and discussion
3.1 Deuterium excess and relative humidity
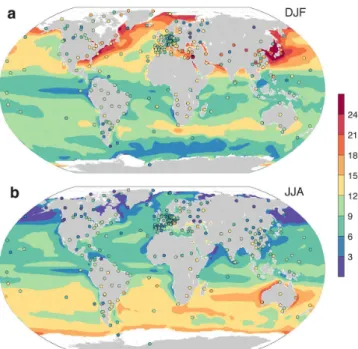
Fig. 2.Spatial distribution of predicted evaporationd(shading) and
observeddin precipitation (circles). Colour shading shows seasonal
meandof ocean surface evaporation, as obtained from the
regres-sion model and RH from atmospheric reanalyses, for the seasons
December–February(a)and June–August(b). Regions with sea ice
in the seasonal mean are masked in white. The coloured circles
show seasonal meandof precipitation at GNIP stations. Note that
evaporation and precipitationdare not expected to directly
corre-spond, since precipitationdat each station is influenced by
region-ally varying moisture sources.
particularly large in periods with low RH, corresponding to highd), which is neglected using monthly data. In spite of this systematic underestimation, the match with the precipi-tation observation is still reasonable, also because the under-estimation is partly compensated by the positive bias of the statistical model.
We now focus our attention on the seasonally averaged spatial patterns ofd in moisture evaporating from the ocean that are obtained from our model (Fig. 2, shading), before comparing to the GNIP station data. These patterns also re-flect the strong seasonality in the NH, and a weaker, oppo-site signal in the SH. The spatial patterns are strongly re-lated to evaporation-weighted RH over the ocean (Fig. 3a, b). During NH winter, high values of d are predicted down-stream (i.e. to the east) of North America and eastern Asia (Fig. 2a, red colours), associated with intense oceanic evapo-ration (cf. Fig. 3e, f) into dry continental air masses advected over the adjacent oceans with the mean westerly circulation. The large humidity gradients over the sea surface lead to strong non-equilibrium fractionation resulting in highd val-ues. A further maximum ofdis predicted in the region of the Barents Sea. In the SH winter, maxima ofd are found near the sea ice edge, and at the coast of Australia (Fig. 2b). The
weaker seasonality ofdin the SH is likely due to the absence of large midlatitude continental areas. Hence, while induced by oceanic RH in both hemispheres,d in precipitation ap-pears to be influenced by the differing land–sea distribution. Comparison of predicteddin evaporation with GNIP pre-cipitation measurements is complicated by the fact that the precipitation at each station originates from various oceanic moisture sources. For this reason, no simple direct corre-spondence between evaporation and precipitationd can be expected at many stations. Nevertheless, several large-scale spatial features of predictedd in ocean evaporation are also reflected in the seasonally averaged precipitation data from GNIP stations (circles in Fig. 2). The zonal gradient of evap-orationdacross the main ocean basins in the NH during win-ter is mirrored by higher precipitationd in the eastern than in the western parts of the North American and the Eurasian continents (Fig. 2a). Very high precipitationdis observed at eastern Mediterranean stations in NH winter, reflecting the highd in water evaporating from the surrounding seas (Gat et al., 2003). In the SH, Pacific island stations show lower precipitationdthan predicted for evaporation, partly causing the offset between measurements and model results seen in Fig. 1. To some extent these differences may be due to inter-annual variability, since several stations only cover a limited number of years.
Fig. 3.Seasonal means of relative humidity over the ocean for DJF (December-January-February)(a)and JJA (June-July-August)(b), sea
surface temperature for DJF(c)and JJA(d), as well as surface LHF for DJF(e)and JJA(f). The means of both RH and SST are weighted
averages, using the local LHF as a weight. Regions with sea ice in the seasonal mean are masked in white.
GNIP network. In turn, the relationship betweend and RH opens the possibility to constrain such model-based moisture source diagnostics. In addition, changes in moisture transport induced by climate change, which can lead to variations in regional-scale moisture budgets, may be quantifiable through theirdfingerprint.
In summary, this comparison shows that there is a close correspondence between hemispherically averaged seasonal cycles of predictedd in evaporation and measurements of
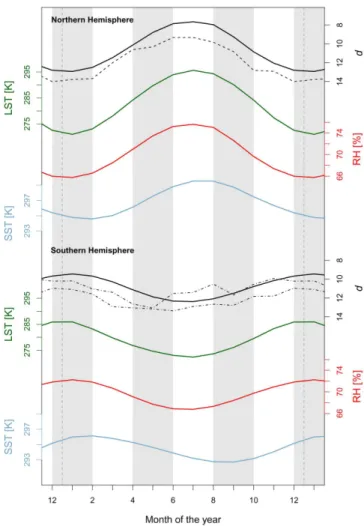
d in precipitation. Near-surface relative humidity is used as sole predictor of evaporationd, and thus the seasonal cycles ofdand RH are linearly related (Fig. 4, black and red lines). In turn, there is a close in-phase relationship between the sea-sonal cycles of RH and the average temperature above land areas (Fig. 4, green lines), which reflects the surface radia-tion balance. With regard to the spatial patterns ofdin ocean evaporation and precipitation, there is some correspondence of large-scale features, but there are also differences on local scales due to variations in moisture source regions and pro-cesses not taken into account in our simple model, like the formation of ice clouds.
3.2 Potential influence of SST
The conspicuous agreement of our model results with GNIP measurement data shows that the linear relationship between
Fig. 4.Hemispheric mean seasonal cycle of predictedd in
com-parison with other variables. The black lines show the averagedd
of ocean evaporation as predicted by the regression model. Green lines show averages of land surface temperature (LST). Mean RH over the ocean and SST, both weighted with the surface latent heat flux, are shown by red and blue lines, respectively. Seasonally
re-solveddfrom a shallow ice core from the NEEM site, Greenland,
covering a 41 yr period (Steen-Larsen et al., 2011) is shown as a dashed line. The dashed-dotted lines show the seasonal cycle from two cores from Law Dome, Antarctica, covering 12 yr (Delmotte et al., 2000) shifted by 8 ‰.
of this study betweendand SST (Fig. 5) compared tod and RH (cf. Fig. 1a).
Nevertheless, all these findings are based on the analysis of present-day climate, and it is not guaranteed that the rela-tion betweend and RH also dominates long-term palaeocli-maticd variations. Many previous studies have interpreted such d variations in terms of moisture source temperature (see Sect. 1). They have presented different arguments for this interpretation, which we would like to discuss in the fol-lowing. It is not the main purpose of this paragraph to provide new evidence for the relevance of RH also on palaeoclimatic timescales, but rather to critically revisit existing arguments
Fig. 5.Scatter plot of water vapourdfrom several published data sets (Gat et al., 2003; Uemura et al., 2008; Pfahl and Wernli, 2008) against SST at the oceanic moisture source.
for the association of long-termdchanges with source tem-perature variations.
– Vimeux et al. (1999) argued that changes of RH over the Southern Ocean between glacial and present-day climate simulated by GCMs are typically small. In ad-dition, global-scale changes of RH are constrained to small values by the surface energy budget (Schnei-der et al., 2010). However, even if mean RH stays constant, the d–RH relationship may yet be associ-ated withdvariations in proxy archives. For example, if the moisture sources of an ice core shift from re-gions with high to rere-gions with low RH (e.g. from the eastern to the western North Atlantic), this may cause huge changes in the resulting precipitation d. Simi-larly, shifts in precipitation seasonality (Krinner et al., 1997; Werner et al., 2000) may lead to large variations in annual meand due to the strong seasonal cycle of
d at the evaporation source. In addition, also if global mean changes in RH are small, local variations can oc-cur, e.g. due to changes in sea ice cover, land–sea tem-perature contrast or storm tracks.
parts of the ship track) and thus does not represent an independent confirmation of the effect of SST on d. Other studies based on measurement data (Gat et al., 2003; Pfahl and Wernli, 2008) even found a negative relationship betweendand SST on the daily timescale (cf. Fig. 5).
– The d–RH relationship would translate into a posi-tive correlation between d and SST (as widely as-sumed in the interpretation of ice cores) if variations of SST and RH were always anti-correlated. However, there is no such systematic anti-correlation of SST and RH in observations. On short, daily timescales, RH and near-surface air temperature time series are cor-related in the extratropics and anti-corcor-related in the tropics (Pfahl and Niedermann, 2011). If SST is con-sidered instead of near-surface air temperature, these (anti-)correlations are generally much weaker, since the magnitude of daily SST variations is smaller than for air temperature (not shown). Also on longer, inter-annual timescales there is no systematic covariance between near-surface RH and temperature time series (Fig. 18b of Dai, 2006). Figure 6 shows scatter plots ofd from our empirical model plotted against SST at the respective grid points. Since the model is linear, the same patterns are obtained if RH is used instead of
d. No systematic relationship betweend (or RH) and SST can be found in these plots, indicating that the first-order relationship betweend and RH, which has been used to construct the model, does not translate into a simple correlation ofd and SST. All together, this demonstrates the complexity of the relation be-tween RH and SST. We are not aware of (and do not foresee) a physical argument which could evoke a di-rect anti-correlation between long-term changes of the two variables.
– Johnsen et al. (1989) used the phase shift between the seasonal cycles ofd andδ18O in Greenland ice as an indicator of the effects of SST ond. However, the sea-sonald cycles from shallow ice cores form the NEEM (North Greenland Eemian Ice Drilling) site, Greenland (Steen-Larsen et al., 2011) and Law Dome, Antarctica (Delmotte et al., 2000), do not correspond with the sea-sonal cycle of SST (Fig. 4, dashed and blue lines). On the contrary, there is a good agreement between the NEEM data and our hemispheric-mean model predic-tions (black solid lines). At Law Dome, the signal is more variable, pointing to a larger influence of local factors. Note that such a comparison with ice core data is difficult in general due to diffusion in the ice and dat-ing uncertainties. Ultimately, it would be preferable to compare to precipitation observations sampled directly at ice core sites (e.g. Fujita and Abe, 2006). Nonethe-less, taking thedseasonality in published ice core data at face value, they do not argue strongly towards SST
influences, and are not inconsistent with RH being the primary factor.
– Recent climate model studies suggest that long-term
d variations throughout the Holocene may be related to SST changes to some degree (Lewis et al., 2013). However, different models seem not to show consis-tent results (cf. Risi et al., 2013), and such a conclusion may be affected by model errors, as isotope-enabled GCMs still have difficulties to properly represent the spatial and temporal variability ofd(Yoshimura et al., 2008; Risi et al., 2010; Jouzel et al., 2007). Recent improvements in the ECHAM5-wiso (water isotope) model are partly due to tuning of the supersaturation function used in the parameterisation of ice clouds (Werner et al., 2011). The large sensitivity of modelled
dto this tuning (see again Risi et al., 2013) may lead to additional problems: a supersaturation function tuned for present-day climate does not necessarily represent, e.g. last glacial maximum conditions correctly. Future studies on this issue may make use of a prognostic rep-resentation of supersaturation in ice clouds that does not require such tuning (Pfahl et al., 2012). In general, models should be thoroughly validated to properly rep-resent the RH–drelationship that controls present-day seasonald variations. Being available with high tem-poral and spatial resolution,d from our model can be used as a benchmark for such simulations.
The above discussion leads us to conclude that there is not sufficient evidence that would justify to neglect the influence of RH on palaeoclimaticdvariations. If this holds, either the interpretation of d variations in palaeorecords will have to be adapted to reflect climatic influences on RH during evap-oration, or new arguments for an interpretation in terms of moisture source SST should be provided based on future re-search.
4 Conclusions
In this paper, the relationship betweendand moisture source RH under present-day climate conditions has been studied with the help of a simple, linear empirical model. We have shown that thed–RH relation observed on daily timescales also explains the seasonal cycle of hemispherically averaged
Fig. 6.Seasonal means ofdas obtained from our model plotted against seasonal mean SST from the corresponding ERA-Interim grid boxes
for(a)DJF and(b)JJA. For clarity, only every third point is shown.
which is strongly affected by variations in atmospheric cir-culation and the corresponding changes of moisture source locations. This first-order interpretation is in analogy to the classical temperature effect: spatial and temporal correlations between isotope ratios (δD andδ18O) and temperature have been observed under present-day climate conditions (Dans-gaard, 1964) and were subsequently used to link isotope signals from proxy archives to past temperature variations (e.g. Dansgaard et al., 1993). Nevertheless, for a detailed and quantitative analysis of isotope proxy data from indi-vidual locations, additional processes have to be taken into account. Regarding the classical temperature effect, e.g. vari-ations in precipitation seasonality and moisture source tem-perature can influence the relationship between isotope ratios and temperature at the proxy location (Krinner et al., 1997; Werner et al., 2000; Masson-Delmotte et al., 2005). Precipi-tation seasonality can also impactdbecause of the large sea-sonal variability of RH over the ocean. In addition, thed– RH relation may be affected by second-order parameters like wind speed and SST as well as non-equilibrium fractiona-tion processes during soil evaporafractiona-tion, the re-evaporafractiona-tion of raindrops and, most importantly for ice core locations, the formation of ice clouds (see again Jouzel and Merlivat, 1984; Jouzel et al., 2007). Assessing the relationship betweendand moisture source RH is complicated due to its non-local char-acter. In order to fully explore the linkage betweend proxy records and moisture source conditions, sophisticated meth-ods thus have to be applied, e.g. using tracer simulations with GCMs (Lewis et al., 2013) or Lagrangian techniques (Sode-mann et al., 2008a).
Reinterpreting ice core d as moisture source RH could resolve several complications that have arisen from its pre-vious interpretation as moisture source SST. For example, rapid changes ofd in the NGRIP (North Greenland Ice Core Project) ice core of 2–3 ‰ within 1–3 yr have been used by
Steffensen et al. (2008) to reconstruct moisture source tem-perature changes of 2–4 K (even though the authors left room for other possible interpretations). Following their SST inter-pretation, during the transition from the Younger Dryas (YD) to the Holocenedwould decrease, which would imply cooler moisture source temperatures for Greenland in a warmer cli-mate, at least for the beginning of the Holocene (Masson-Delmotte et al., 2005; Steffensen et al., 2008). This counter-intuitive finding was explained by the temporary exposure of cooler ocean areas after the retreat of the sea ice, and fast reorganisations of the atmospheric circulation. Interpretingd
as driven by RH eliminates the need to involve climate com-ponents with inter-annual memory, such as SST and sea ice cover. An alternative explanation of thed decrease from the YD to the Holocene would involve reduced land–sea temper-ature contrasts, relatively more summer precipitation, east-ward shifts of the moisture sources in the North Atlantic basin due to a weakened storm track, or a combination of these factors. A combined interpretation of all available data, including GCM studies of past climate states, and the ac-quisition of new high-resolution isotopic measurements will be crucial to disentangle the interaction between these pro-cesses.
Acknowledgements. MeteoSwiss and ECMWF are acknowledged for giving access to ERA-Interim reanalyses, and the IAEA for providing the GNIP data. We are grateful to Nele Meckler and Heini Wernli (ETH Zurich) as well as Valérie Masson-Delmotte (LSCE, IPSL) for helpful comments on an earlier version of the manuscript. Comments from Martin Werner, Jesper Sjolte and an anonymous reviewer helped us to further improve the manuscript.
References
Angert, A., Lee, J.-E., and Yakir, D.: Seasonal variations in the iso-topic composition of near surface water vapor in the Eastern-Mediterranean, Tellus B, 60, 674–684, doi:10.1111/j.1600-0889.2008.00357.x, 2008.
Araguás-Araguás, L., Froehlich, K., and Rozanski, K.: Deuterium and oxygen-18 isotope composition of precipitation and atmo-spheric moisture, Hydrol. Process., 14, 1341–1355, 2000. Craig, H. and Gordon, L. I.: Deuterium and oxygen 18 variations
in the ocean and the marine atmosphere, in: Stable Isotopes in Oceanographic Studies and Paleotemperatures, edited by: Ton-giorgi, E., Lab. Geol. Nucl., Pisa, Italy, 9–130, 1965.
Dai, A.: Recent climatology, variability, and trends in global surface humidity, J. Climate, 19, 3589–3606, 2006.
Dansgaard, W.: Stable isotopes in precipitation, Tellus B, 16, 436– 468, 1964.
Dansgaard, W., Johnsen, S. J., Clausen, H. B., Dahl-Jensen, D., Gundestrup, N. S., Hammer, C. U., Hvidberg, C. S., Stef-fensen, J. P., Sveinbjörnsdottir, A. E., Jouzel, J., and Bond, G.: Evidence for general instability of past climate from a 250-kyr ice-core record, Nature, 364, 218–220, 1993.
Dee, D. P., Uppala, S. M., Simmons, A. J., Berrisford, P., Poli, P., Kobayashi, S., Andrae, U., Balmaseda, M. A., Balsamo, G., Bauer, P., Bechtold, P., Beljaars, A. C. M., van de Berg, L., Bid-lot, J., Bormann, N., Delsol, C., Dragani, R., Fuentes, M., Geer, A. J., Haimberger, L., Healy, S. B., Hersbach, H., Holm, E. V., Isaksen, L., Kallberg, P., Koehler, M., Matricardi, M., McNally, A. P., Monge-Sanz, B. M., Morcrette, J.-J., Park, B.-K., Peubey, C., de Rosnay, P., Tavolato, C., Thepaut, J.-N., and Vitart, F.: The ERA-Interim reanalysis: configuration and performance of the data assimilation system, Q. J. Roy. Meteorol. Soc., 137, 553– 597, doi:10.1002/qj.828, 2011.
Delmotte, M., Masson, V., Jouzel, J., and Morgan, V. I.: A seasonal deuterium excess signal at Law Dome, coastal eastern Antarc-tica: a southern ocean signature, J. Geophys. Res., 105, 7187– 7197, 2000.
Fujita, K. and Abe, O.: Stable isotopes in daily precipitation at Dome Fuji, East Antarctica, Geophys. Res. Lett., 33, L18503, doi:10.1029/2006GL026936, 2006.
Gat, J. R.: Oxygen and hydrogen isotopes in the hydrological cycle, Annu. Rev. Earth Pl. Sc., 24, 225–262, 1996.
Gat, J. R., Klein, B., Kushnir, Y., Roether, W., Wernli, H., Yam, R., and Shemesh, A.: Isotope composition of air moisture over the Mediterranean Sea: an index of the air-sea interaction pattern, Tellus B, 55, 953–965, 2003.
IAEA: Global Network of Isotopes in Precipitation, The GNIP Database, available at: http://www.iaea.org/water (last access: 23 May 2012), 2006.
Johnsen, S. J., Dansgaard, W., and White, J. W. C.: The origin of Arctic precipitation under present and glacial conditions, Tellus B, 41, 452–468, 1989.
Jouzel, J. and Koster, R. D.: A reconsideration of the initial condi-tions used for stable water isotope models, J. Geophys. Res., 101, 22933–22938, 1996.
Jouzel, J. and Merlivat, L.: Deuterium and oxygen 18 in precipita-tion: modeling of the isotope effects during snow formation, J. Geophys. Res., 89, 11749–11757, 1984.
Jouzel, J., Merlivat, L., and Lorius, C.: Deuterium excess in an East Antarctic ice core suggests higher relative humidity at the
oceanic surface during the last glacial maximum, Nature, 299, 688–691, 1982.
Jouzel, J., Stievenard, M., Johnsen, S. J., Landais, A., Masson-Delmotte, V., Sveinbjörnsdottir, A., Vimeux, F., von Grafen-stein, U., and White, J. W. C.: The GRIP deuterium-excess record, Quaternary Sci. Rev., 26, 1–17, 2007.
Krinner, G., Genthon, C., and Jouzel, J.: GCM analysis of local
inflluences on ice core δ signals, J. Climate, 24, 2825–2828,
doi:10.1029/97GL52891, 1997.
Kurita, N.: Origin of Arctic vapor during the ice-growth season, Geophys. Res. Lett., 38, L02709, doi:10.1029/2010GL046064, 2011.
Lewis, S. C., LeGrande, A. N., Kelley, M., and Schmidt, G. A.: Modeling insights into deuterium excess as an indicator of wa-ter vapor source conditions, J. Geophys. Res., 118, 243–262, doi:10.1029/2012JD017804, 2013.
Luz, B., Barkan, E., Yam, R., and Shemesh, A.: Frac-tionation of oxygen and hydrogen isotopes in evaporat-ing water, Geochim. Cosmochim. Ac., 73, 6697–6703, doi:10.1016/j.gca.2009.08.008, 2009.
Masson-Delmotte, V., Jouzel, J., Landais, A., Stievenard, M., Johnsen, S. J., White, J. W. C., Werner, M., Sveinbjörnsdottir, A., and Fuhrer, K.: GRIP deuterium excess reveals rapid and orbital-scale changes in Greenland moisture origin, Science, 309, 118– 121, 2005.
Meckler, A. N., Clarkson, M. O., Cobb, K. M., Sodemann, H., and Adkins, J. F.: Interglacial hydroclimate in the tropical west Pacific through the late Pleistocene, Science, 336, 1301–1304, doi:10.1126/science.1218340, 2012.
Merlivat, L. and Jouzel, J.: Global climatic interpretation of the deuterium-oxygen 18 relationship for precipitation, J. Geophys. Res., 84, 5029–5033, 1979.
Numaguti, A.: Origin and recycling processes of precipitating water over the Eurasian continent: experiments using an atmospheric general circulation model, J. Geophys. Res., 104, 1957–1972, 1999.
Pfahl, S. and Niedermann, N.: Daily co-variations in near-surface relative humidity and temperature over the ocean, J. Geophys. Res., 116, D19104, doi:10.1029/2011JD015792, 2011.
Pfahl, S. and Wernli, H.: Air parcel trajectory analysis of stable iso-topes in water vapor in the eastern Mediterranean, J. Geophys. Res., 113, D20104, doi:10.1029/2008JD009839, 2008.
Pfahl, S. and Wernli, H.: Lagrangian simulations of stable isotopes in water vapor – an evaluation of non-equilibrium fractionation in the Craig-Gordon model, J. Geophys. Res., 114, D20108, doi:10.1029/2009JD012054, 2009.
Pfahl, S., Wernli, H., and Yoshimura, K.: The isotopic composi-tion of precipitacomposi-tion from a winter storm – a case study with the
limited-area model COSMOiso, Atmos. Chem. Phys., 12, 1629–
1648, doi:10.5194/acp-12-1629-2012, 2012.
Risi, C., Bony, S., Vimeux, F., and Jouzel, J.: Water-stable isotopes in the LMDZ4 general circultaion model: model evaluation for present-day and past climates and applications to climatic in-terpretations of tropical isotopic records, J. Geophys. Res., 115, D12118, doi:10.1029/2009JD013255, 2010.
Risi, C., Landais, A., Winkler, R., and Vimeux, F.: Can we de-termine what controls the spatio-temporal distribution of
circulation model?, Clim. Past, 9, 2173–2193, doi:10.5194/cp-9-2173-2013, 2013.
Schneider, T., O’Gorman, P. A., and Levine, X. J.: Water vapor and the dynamics of climate changes, Rev. Geophys., 48, RG3001, doi:10.1029/2009RG000302, 2010.
Simmons, A. J., Willett, K. M., Jones, P. D., Thorne, P. W., and Dee, D. P.: Low-frequency variations in surface atmospheric hu-midity, temperature, and precipitation: Inferences from reanal-ysis and monthly gridded observational data sets, J. Geophys. Res., 115, D01110, doi:10.1029/2009JD012442, 2010.
Sodemann, H. and Zubler, E.: Seasonal and inter-annual variability of the moisture sources for Alpine precipitation during 1995– 2002, Int. J. Climatol., 30, 947–961, doi:10.1002/joc.1932, 2010. Sodemann, H., Masson-Delmotte, V., Schwierz, C., Vinther, B., and Wernli, H.: Inter-annual variability of Greenland winter precipi-tation sources. Part II: Effects of North Atlantic oscillation vari-ability on stable isotopes in precipitation, J. Geophys. Res., 113, D12111, doi:10.1029/2007JD009416, 2008a.
Sodemann, H., Schwierz, C., and Wernli, H.: Inter-annual variabil-ity of Greenland winter precipitation sources. Part I: Lagrangian moisture diagnostic and North Atlantic oscillation influence, J. Geophys. Res., 113, D03107, doi:10.1029/2007JD008503, 2008b.
Steen-Larsen, H. C., Masson-Delmotte, V., Sjolte, J., Johnsen, S. J., Vinther, B. M., Breon, F.-M., Clausen, H. B., Dahl-Jensen, D., Falourd, S., Fettweis, X., Gallee, H., Jouzel, J., Kageyama, M., Lerche, H., Minster, B., Picard, G., Punge, H. J., Risi, C., Salas, D., Schwander, J., Steffen, K., Sveinbjoernsdottir, A. E., Svensson, A., and White, J.: Understanding the climatic signal in the water stable isotope records from the NEEM shallow firn/ice cores in northwest Greenland, J. Geophys. Res., 116, D06108, doi:10.1029/2010JD014311, 2011.
Steffensen, J. P., Andersen, K. K., Bigler, M., Clausen, H. B., Dahl-Jensen, D., Fischer, H., Goto-Azuma, K., Hansson, M., Johnsen, S. J., Jouzel, J., Masson-Delmotte, V., Popp, T., Rasmussen, S. O., Roethlisberger, R., Ruth, U., Stauffer, B., Siggaard-Andersen, M.-L., Sveinbjornsdottir, A. E., Svensson, A., and White, J. W. C.: High-resolution Greenland Ice Core data show abrupt climate change happens in few years, Science, 321, 680–684, doi:10.1126/science.1157707, 2008.
Stenni, B., Masson-Delmotte, V., Johnsen, S., Jouzel, J., Longinelli, A., Monnin, E., Röthlisberger, R., and Selmo, E.: An oceanic cold reversal during the last deglaciation, Science, 293, 2074–2077, 2001.
Trenberth, K. E.: Atmospheric moisture recycling: role of advection and local evaporation, J. Climate, 12, 1368-1381, 1999. Uemura, R., Matsui, Y., Yoshimura, K., Motoyama, H., and
Yoshida, N.: Evidence of deuterium excess in water vapor as an indicator of ocean surface conditions, J. Geophys. Res., 113, D19114, doi:10.1029/2008JD010209, 2008.
Uemura, R., Masson-Delmotte, V., Jouzel, J., Landais, A., Mo-toyama, H., and Stenni, B.: Ranges of moisture-source tem-perature estimated from Antarctic ice cores stable isotope records over glacial–interglacial cycles, Clim. Past, 8, 1109– 1125, doi:10.5194/cp-8-1109-2012, 2012.
Vimeux, F., Masson, V., Jouzel, J., Stievenard, M., and Petit, J. R.: Glacial-interglacial changes in ocean surface conditions in the Southern Hemisphere, Nature, 398, 410–413, 1999.
Werner, M., Mikolajewicz, U., Heimann, M., and Hoffmann, G.: Borehole versus isotope temperatures on Greenland: seasonality does matter, Geophys. Res. Lett., 27, 723–726, 2000.
Werner, M., Langebroek, P. M., Carlsen, T., Herold, M., and Lohmann, G.: Stable water isotopes in the ECHAM5 gen-eral circulation model: toward high-resolution isotope mod-eling on a global scale, J. Geophys. Res., 116, D15109, doi:10.1029/2011JD015681, 2011.