Textile Dye Treated Photoelectrolytically
and Monitored by Winogradsky Columns
Mariana Lopes de Sousa,1 Peterson Bueno de Moraes,2Paulo Renato Matos Lopes,1 Renato Nallin Montagnolli,1Dejanira de Franceschi de Angelis,1and Ederio Dino Bidoia1,*
1
Department of Biochemistry and Microbiology, Institute of Life Sciences, Sa˜o Paulo State University ‘‘Ju´lio de Mesquita Filho’’ (UNESP)—Botucatu, Rio Claro, Brazil.
2
Technological of Environmental Sanitation (DTSA), Faculty of Technology, Campinas State University (UNICAMP), Limeira, Brazil. Received: August 12, 2010 Accepted in revised form: May 23, 2011
Abstract
Due to large amounts of wastewater generated by textile industry, studies on degradation and subsequent impact of these effluents are needed when they are released into water bodies. Since reactive dyes present higher degradation when treated by physical and chemical processes, a photoelectrolytic process was used. Ecotox-icological analysis of simulated textile effluents was conducted before and after treatment. Winogradsky col-umns were used, simulating a microecosystem where algae growth was examined. Results indicated that the photoelectrolytic process achieved satisfactory results in color degradation of the studied dye (Remazol red brilliant), but after 30 min of treatment, even though the effluent became colorless, it reduced dramatically microalgae diversity. Although complete color removal (97%) was not observed, the effluent treated for 5 min did not affect microalgae growth in the same way as the effluent treated for 30 min. An optimum treatment time of 5 min was determined.
Key words:algae; photoelectrolytic system; remazol red brilliant; winogradsly columns
Introduction
P
ollution can be defined as all the environmental changes caused by human action that cause damage to the ecosystem and the society (Nass, 2010). Toxicity, turbidity, and stressful conditions are all consequences of the pollution. Textile industry is responsible for large amounts of waste-water, which is mainly produced in processes of dyeing and dye dilution (Kunz and Peralta-Zamora, 2002). Such water is unfit for consumption and survival of species found in rivers, thus causing harm to photosynthesis processes due to water turbidity caused by the dyes (Robinsonet al., 2001; Catanhoet al., 2006) and disturbing aquatic ecosystems. One of the textile dyes that is largely used nowadays and potentially causes environmental problems is Remazol red brilliant, for-mula C19H10Cl2N6Na2O7S2(Fig. 1), which is widely used in
the textile industry for dyeing cotton as well as ink for print cartridges. It belongs to the reactive vinyl sulfone dyes group (chromophore azo group N=N). This group represents about
60% of the dyes used in the textile industry (Catanhoet al., 2006). In general, reactive dyes are highly soluble in water. They also have very high exhaustion (percentage of dye that
are not fixable in fibers, thus released in wastewater), which reaches up to 50% (Al-Degset al., 2000). The higher the dye concentration is, the more difficult is its removal from water (Korbahti, 2007). These dyes are formed by bonds strong en-ough not to be disrupted by biological processes, which have inefficient outcomes with this type of effluent, especially re-garding color removal (Al-Degset al., 2000; Arau´joet al., 2006). Since reactive dyes are hardly degraded by biological processes (Al-Degset al., 2000; Arau´joet al., 2006), physical-chemical processes are more appropriate in this situation. The photoelectrolytic process is successfully applied to treatment of effluents containing reactive dyes (Pelegriniet al., 1999; Arau´joet al., 2006; Catanhoet al., 2006). It is also efficient in the presence of organic matter (Ziolli and Jardim, 1998) and could even be used for sewage treatment (Cossu et al., 1998). However, despite color removal, the dye molecule might end up not being completely destroyed (Saueret al., 2002), thus causing high toxicity after treatment (Sousaet al., 2011).
During electrolysis, pollutants can be degraded by direct electrolysis, as charges transferred on the anode surface are capable of destroying pollutants (Chianget al., 1995). More-over, they can be degraded by indirect electrolysis when a chemical compound is added by generating an oxidizing agent in solution (Chianget al., 1997). In this case, an ultra-violet (UV) lamp accelerates reactions involved and optimizes the process by oxidation (Robinson et al., 2001). However, physical and chemical processes are able to either destroy the
*Corresponding author: Departamento de Bioquı´mica e Micro-biologia, Instituto de Biocieˆncias, UNESP–Univ Estadual Paulista, Av. 24A, 1515–Bela Vista, Rio Claro, SP 13506-900, Brazil.Phone:+55
(19) 3526-4100;Fax: +55 (19) 3526-4176;E-mail:[email protected] ªMary Ann Liebert, Inc.
DOI: 10.1089/ees.2010.0259
dye, or only transform it, so the dye molecule still persists in effluents in another form (Saueret al., 2002).
Once the effluent is treated by the photolectrolytic process, it is necessary to measure its impact in the environment. One way is through Winogradsky columns. These columns are microecosystems inside a glass container, composed of soil (taken from river bottom), water, and nutrients. The Wino-gradsky column metodology is knowingly used to under-stand microbial communities (Ambleret al., 2001), population changes in biodegradation and bioremediation studies (Gu-tierrezet al., 2007), and ecotoxicology of polluted environ-ments (O’Sullivan, 2003). Microalgae or phytoplankton distribution along the columns in the presence of different treated effluents can be observed though this method.
Algae is important organic matter producers in aquatic ecosystems (Klain and Lewis, 1995) and houses species from Plantae, Metazoa, and Bacteria (Brusca and Brusca, 2003; Bi-cudo and Menezes, 2006).
The objectives of the present article are the photoelec-trolytic degradation of simulated textile effluent and the evaluation of ecotoxicity from the samples obtained in the Winogradsky columns’ phytoplankton community.
Experimental Procedures
The experiments were performed in a photoelectrolytic system (Fig. 2) containing electrolytic reactor, stainless-steel chamber containing an ultraviolet lamp, flowmeter, PVC tank, valves, hydraulic pump, and tubing placed in a metal
support. The electrolytic reactor is composed of a rectangular titanium anode coated with 70% TiO2/30% RuO2.
The system makes an indirect electrolysis of organic com-pounds in solution with sodium chloride as an oxidant agent (Deng and Englehardt, 2007). The UVC lamp (Ultraviolet C, from 280 nm to 100 nm) promotes photooxidation of those compounds, thus accelerating the degradation process. The effluent was put on reservoir, from where it was pumped, passing through an electrolytic reactor and a UVC lamp, in a clockwise cyclic system. After 3 min, the UVC lamp was turned off, but the electrolytic reactor was kept on until the end of the treatment, thus degrading the effluent.
The dye is commercially known as Remazol Red Brilliant (CI reactive red 21) and was produced by ShangHai Titan-chem Ltd. Its Titan-chemical formula is C19H10Cl2N6Na2O7S2
and it is called disodium salt of 2,7-Naphthalenedisulfonic acid, 5-[(4,6-dichloro-1,3,5-triazin-2-yl)amino]-4-hydroxy-3-(phenylazo).
The simulated effluent was made by adding 40 g of sodium chloride (10,000 mg L-1
) into a 4.00 L flask and 5.28 g of an-hydrous sodium carbonate. Reagents were dissolved into 4 L of distilled water. Afterward, 0.8 g of dye powder was slowly added into the solution up to a final concentration of 200 mg L-1. This concentration is higher if compared with the photoelectrolytic degradation studies of Catanho et al.
(2006) and Georgiouet al.(2002).Since real concentration used in the industry is variable and depends on the type of dye used and dilution, there is no standard concentration.
The prepared solution pH was about 10.5, so it was acidi-fied with sulfuric acid 2 M to achieve pH around 3.5, because the titanium anode coated with 70% TiO2/30% RuO2has a
better efficiency in acid pH values due to the TiO2 surface
charge (pzc is close to 6.8) according to Saueret al.(2002). This simulated effluent was placed in the photoelectrolytic system and exposed to a continuous 3 A current. Samples were taken at predetermined times: 0 min (simulated effluent without treatment), 3 min, 5 min, 15 min, and 30 min. The UV-C light was turned on for 3 min at the beginning of the treatment. Samples were stored and maintained under refrigeration for later analysis of absorbance, and consequent degradation of cromophore groups, pH (Digimed DMPH-2), and conduct-ibility. The o-toluidine reagent was used to measure chlorine in the samples 15 days after treatment.
The Winogradsky columns were made with 500 mL beakers from 100 g of soil collected from Ribeira˜o Claro (Rio Claro, Brazil) water treatment station input (DAAE, Rio Claro, Brazil), 50 mL of treated simulated effluent and 450 mL of water were also withdrawn from DAAE. All the columns contained sludge and water from the same place. They were also equally illu-minated and enriched with nutrients. The sludge and water were removed from a water treatment station, so it was as-sumed that the place had appropriate conditions for phyto-plankton development. For every 100 g of soil used in each Winogradsky column, the following nutrients were added, adapted from Anderson and Hairston (1999): Na2CO3(0.20 g),
Na2SO4(4.50 g), K2HPO4(0.50 g), (NH4)2SO4(0.50 g), and plain
paper/cellulose (0.50 g). Four columns were made: one with water only (no simulated effluent) called control (C), one with the effluent without treatment (T0), one with treated effluent for 5 min (T5), and another with the effluent treated for 30 min (T30). An incandescent lamp (150 W) was placed behind the columns during the experiment, providing enough light for
photosynthetic processes. Also, a paper sheet was placed blocking the top half of the column to evaluate the influence of light incidence on development of microorganisms by creating heterogeneity.
Modifications were observed within the columns during the experiment, such as algae development and color change. Only after 4 weeks, when the photosynthetic population was already stabilized, algae identification started. Observation was done using a microscope (400·), so identification was
done by comparison and taxonomic key from Bicudo and Menezes (2006).
Algae samples were collected close to the column walls using a spatula. These samples were identified and condi-tioned in test tubes containing water and 70% ethanol and kept at a low temperature to prevent its degradation (Bicudo and Menezes, 2006). Biomass quantification was measured by observation before the algae samples were removed from the columns. Since the algae layer was largely removed for tax-onomic identification, and irregularly distributed throughout the column walls, the withdrawal of samples for weighing was not possible.
Results
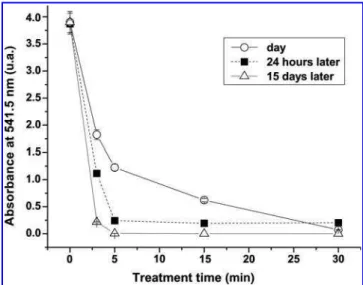
The process proved itself extremely successful in color re-moval from the solution. Chromophore groups’ destruction can be shown by a concentration decrease from 200 to 0 mg L-1
and absorbance from 3.95 to 0 at a 541.5 nm wavelength, analyzed with a spectrophotometer. This can be explained by the fact that chloride is oxidized to chlorine/hypochlorite, which is responsible for increased efficiency of the electrolytic process. Chlorine reacts with dyes’ unsaturated and chro-mophore groups. This reactive species derived from chlorine is responsible for organic oxidation and also oxidation of in-termediate compounds present in the effluent and nitroge-nous waste (Cossu et al., 1998). It was possible to detect chlorine presence in the 30 min sample, 15 days after the treatment, with a 5 ppm concentration.
It is worth mentioning that these results were obtained 1 day after the simulated effluent was treated, because there was intermediates formation in this solution after being irra-diated by UV light. After 15 days, the stored samples had an even greater degradation with both total color removal and concentration decrease, especially the 5 min samples (Fig. 3). There was a significant reduction in solution pH, and the final pH after 30 min of treatment was 6.5 the same day the effluent was treated, reaching up to 7.0 fifteen days later (Fig. 4).
The treated solution conductivity (Fig. 5) remained at the same level (between 14.0 and 14.5 S m-1
) until 15 min of treatment and then rose at 30 min (16.0 S m-1
). This is due to an ions increase in solution due to dye molecules breaking and ionization. After 15 days, the conductivity decreased considerably, lying between 10.0 and 11.5 S m-1
(Fig. 5). On the 4th day, algae began to appear in columns T0, T5, and C, in both walls and on top of the sediment. At the 7th day, there was a thin layer of algae present throughout the wall in columns C and T0, including behind the column; whereas T30 had not presented any algae on the walls, only a few on the top (inside the covered area).
At the 10th day, column C showed a layer of algae over the whole length and a turbidity increase. The column T0
pre-sented algae layer thickening, especially at the bottom. There was gas evolution as an evidence of microbial activity. Also, it was observed that the solution became clearer at the column T0 bottom, indicating metabolic activity in the biodegradation of the dye. Column T30 showed little algae formation on the bottom and back.
At the 19th day, all columns presented algae layer on the back, very dense especially in column C, which showed for-mation of algae over the whole length. Only after the 22nd day, there was a considerable growth of algae in T30. Col-umns T5 and T0 showed a large release of gas (in the form of bubbles) and at the 28th day, the columns were already stable, so the samples were removed for analysis.
Columns C and T5 showed the greatest development of biomass, and column T30 showed the lowest, which is con-centrated at the rear of the column (farther from the light), which was expected due to a higher concentration of chlorine in the 30 min effluent. Column T5 had a similar development to column C, which indicates a lower toxicity. The columns with smaller biomass presented this characteristic because of
FIG. 3. Dye concentration after treatment.
the toxic nature of effluent and also due to the fact that in more stressful environments, species with lower biomass are more abundant (Franceschiniet al., 2010), which leads to a primary production loss.
The 0.500 L beakers used presented low heterogeneity, because the lamp lit up the entire length of the column almost equally, on top, middle, and bottom. Such a fact lead to a lower variation of species found between different parts of the column Table 1.
Discussion
Considering the economic aspects of photoelectrolytic treatment, the cost of a five minutes of photoelectrolysis (ac-cording to the price of industrial kW/h) in Brazil would be about $2.17 per cubic meter. Such value is not expensive for this type of residue. Therefore, the photoelectrolytic system can be applied as either the main treatment for textile effluent,
or as a complementary treatment associated to the treatments already applied in the industry.
According to Reviers (2006), the large number of Bacillar-ophyceaein C and T0 means that water was not toxic, as these microalgae are the major primary producers in food chains and are also used as environmental bioindicators. The column T5, despite an apparently equal biomass compared with C, presented lower incidence of these algae (Bacillariophyceae).
Nostocaceaeis very sensitive to pollution (Parra and Bicudo, 1995; Franceschini et al., 2010) and was only found in the control column and also at T0, which may mean that the ef-fluent without treatment has lower toxicity before being treated (with the consequent production of chlorine and in-termediate species). The absence of Nostocaceae in columns containing effluent which passed through photoelectrolytic treatment confirms the fact that despite the color removal, the dye molecule remained in effluent along with chlorine gen-erated during electrolysis.
All columns containing photoelectrolitically treated efflu-ent were slightly acid after treatmefflu-ent (pH 6.5 on the top and 7.0 in the middle and bottom). Column T0 (with effluent without any treatment) had a pH of 4.9 on the top, and 7 in the middle and bottom leading to a presence ofChlorococaceaeat T0 and T30. TheChlorococaceaeprefers slightly acidic aquatic environments, and such preference may explain the absence ofChlorococaceaein column C that was made with river water without treatment (Parra and Bicudo, 1995; Reviers, 2006).
According to Reis (1984), Chlorococaceaespecies are typi-cally found in polluted and acid waters. Therefore, it was not found in column C, but only in T0 and T30. Its abstinence in column T5 despite its acidity can be explained, because a species growth depends not only on ecosystem’s physical and chemical properties. Once each column has a different mi-crobiota, a possible explanation for a better development of
Chlorococaceaein polluted environments (T0 and T30) could be a competitive disadvantage betweenChlorococaceaeand clear water species (C and T5). It also relies on interactions and ecological relations too (Odum, 1971). Another factor that
FIG. 5. Effluent conductivity after treatment.
Table1. Algae Families Identified in the Winogradsky Columns, Organized by Columns and Environments
Columns
C T0 T5 T30
Families T M B Bc T M B Bc T M B Bc T M B Bc
Bacillariophyceae 5 6 5 0 3 5 6 0 0 0 3 0 0 0 0 0
Chlorococaceae 0 0 0 0 0 0 1 0 0 0 0 0 0 1 0 0
Chroococaceae 0 1 0 0 0 1 1 1 0 0 1 0 0 0 0 0
Merismopediaceae 1 1 1 0 1 1 1 1 1 1 1 1 1 1 1 1
Microcystacee 1 1 1 0 1 1 1 0 0 1 1 0 0 0 1 0
Nostocaceae 1 0 1 0 0 0 1 0 0 0 0 0 0 0 0 0
Oocistaceae 0 0 0 0 0 0 0 0 0 0 2 0 0 0 0 0
Oscillatoriaceae 0 0 2 0 0 0 0 0 0 0 0 0 0 0 0 0
Phormidaceae 0 0 2 0 0 0 0 0 0 0 0 0 0 0 0 0
Pleurochloridaceae 1 0 0 0 0 0 0 0 0 0 0 0 0 0 0 0
Pseudoanabenaceae 0 0 0 0 1 1 2 1 0 1 0 0 0 0 1 1
Scenedesmaceae 0 0 0 0 0 0 1 0 0 0 1 0 0 0 0 0
Synetochococcaceae 1 1 1 0 1 1 1 1 1 1 2 1 1 1 1 1
Xenococcaceae 0 0 0 0 0 0 0 0 0 0 0 1 0 0 0 0
might indicate effluent toxicity in T30 is the absence of many families found in the other columns.
TheMicrocystaceaehas a preference for environments with lower light incidence, as is column T0, which had a low light diffusion due to the dye, thus promoting algae appearance. However, these algae have also been found in columns C and T5. One possible explanation is that these algae have devel-oped among other algae and not directly on the glass surface, so they would not receive direct lighting. On column T30 there was great light penetration due to the thin layer of algae, as the effluent contained large amounts of chlorine dissolved, soMicrocystaceaewas found just at the bottom of the column. ThePseudoanabenaceaeappeared in a large quantity on the back of the columns and were associated with Mer-ismopediaceaeandSynetochococcaceae,forming tangles of fila-ments in columns T0 and T30.
It is possible to admit that the presence of chlorine gener-ated during treatment was more stressful to the phytoplank-ton than the effluent without any treatment, but if compared with column C, then all the other columns had their diversity affected negatively.Phormidaceaepresence in column C indi-cated that the environment was less stressful (less toxicity, better light diffusion) than the others due to the ecological characteristics of these algae, which were more competitive in stable environments (Franceschiniet al., 2010).
Summary
Photoelectrolytic treatment presented a successful color removal in simulated wastewater containing Remazol red brilliant dye, using little treatment time (5 min). Results of ecotoxicological tests using Winogradsky columns indicated that dye solution without any treatment affected the algae population less than the solution treated for 30 min. Also, in column containing solution treated for 5 min, the population was closer to the control column (C), even though presenting a 97% color removal. This meant that 5 min treatment offers lower toxicity if compared with the other samples and re-moves color satisfactorily. Therefore, 5 min treatment was considered the optimum photoelectrolytic treatment time for the dye.
Acknowledgments
The authors would like to thank PIBIC/CNPq, CAPES, and FAPESP for supporting this work.
Author Disclosure Statement
No competing financial interests exist.
References
Al-Degs, Y., Khraisheh, M.A.M., Aleen, S.J., and Ahmad, M.N. (2000). Effect of carbon surface chemistry on the removal of reactive dyes from textile effluent.Wat. Res.34, 927.
Ambler, J., Pelovitz, K., Ladd, T., and Steucek, G. (2001). A demonstration of nitrogen dynamics in oxic & hypoxic soils & sediments.Am. Biol. Teach.63, 199.
Anderson, D.C., and Hairston, R.V. (1999). The Winogradsky Column e biofilms: models for teaching nutrient cycling e succession in an ecosystem.Am. Biol. Teach.61, 453.
Arau´jo, F.V.F., Yokoyama, L., and Teixeira, L.A.C. (2006). Re-moc¸a˜o de cor em soluc¸o˜es de corantes reativos em soluc¸o˜es
por oxidac¸a˜o com H2O2/UV (Color removal in solutions of reactive dyes by oxidation with H2O2/UV).Quim. Nova29, 11. Bicudo, C.E.M., and Menezes M. (2006).Geˆneros de algas con-tinentais do Brasil–Chave para identificac¸o˜es e descric¸o˜es (Algae Genres from Brazil’s Landwater: Identification Key and Descrip-tions), 2nd edition. Sa˜o Carlos, Brazil: Rima.
Brusca, R.C., and Brusca, G.J. (2003).Invertebrates, 2nd edition, Sunderland, United Kingdom: Sinauer Associates.
Catanho, M., Malpass, G.R.P., and Motheo A.J. (2006). Photo-electrochemical treatment of the dye reactive red 198 using DSA1 electrodes.Appl. Catal. B: Environ.62, 193.
Chiang, L., Chang, J., and Wen, T. (1995). Indirect oxidation effect in eletrochemical oxidation tratment of landfill leachate.
Wat. Res.29, 671.
Chiang, L., Chang, J., and Tseng, S. (1997). Electrochemical oxidation pre-treatment of refractory organic pollutants.Wat. Sci. Technol.36, 123.
Cossu, R., Polcaro, A.M., Lavagnolo, M.C., Mascia, M., Palmas, S., and Reboldi, F. (1998). Electrochemical treatment of landfill leachate: oxidation at Ti/PbO2and Ti/SnO2anodes.Environ.
Sci. Technol.32, 3570.
Deng, Y., and Engledhardt, J.D. (2007). Electrochemical oxida-tion for landfill leachate treatment.Waste Manage. 27, 380. Franceschini, I.M., Burliga, A.L., Reviers, B. Prado, J.F., and
Re´zig, S.H. (2010).Algas: Uma abordagem filogene´tica, taxonoˆmica e ecolo´gica(Algae: A Phylogenectic Taxonomic and Ecological Ap-proach), 1st edition. Porto Alegre, Brazil: Artmed.
Georgiou, D., Melidis, P., Aivasidis, A., and Gimouhopolus, K. (2002). Degradation of azo-reactive dyes by ultraviolet radia-tion in the presence of hydrogen peroxide. Dyes Pigments
52, 69.
Gutierrez, R.A.V., Terrazaz, S.L.E., and Alvarez, A.M.T. (2007). Aislamiento y cultivo de bacte´rias reductoras acido´filas para la produccio´n de sulfuro bioge´nico para la precipitacio´n de metales pesados (Isolation and culture of acidophilic reducing bacteria for the production of biogenic sulfide precipitation for heavy metals).Biofarbo15, 5.
Klaine, S.J., and Lewis, M.A. (1995). Algal and plant toxicity testing. In D.J. Hoffman, B.A. Rattner, G.A. Burton, Jr., and J. Cairns, Jr. (Eds.), Handbook of Ecotoxicology, 1st edition. Washington, DC: Lewis Publishers, p. 163.
Korbahti, B.K. (2007). Response surface optimization of ele-trochemical treatment of textile dye wastewater. J. Hazard. Mater.145, 277.
Kunz, A., and Peralta-Zamora, P. (2002). Novas tendeˆncias no tratamento de efluentes teˆxteis (New trends in the treatment of textile effluents).Quim. Nova25, 78.
Nass, D.P. (2010). O conceito de Poluic¸a˜o (The concept of pol-lution).Rev. Eletronica Cien.13, 1.
Odum, E.P. (1971).Fundamentals in Ecology, 3rd edition. Phila-delphia: Saunders.
O’Sullivan, A.D., Murray, D.A., and Otte, M.L. (2003). Ecological development of constructed wetlands built for treating mine water at Tara Mines, Ireland. InProceedings of the 20th Meeting of the American Society for Surface Mining and Reclamation. Billings, MT: Working Together for Innovative Reclamation, p. 945.
Parra, O.O., and Bicudo, C.E.M. (1995).Introduccio´n a la biologia y sistema´tica de las algas de a´guas continentales. (Introduction to Landwater Algae Biology and Systematic), 1st edition. Santiago, Chile: Gra´fica Andes.
Reis, M.A.G. (1984).Tecnicas para ana´lise qualitativa e quantitativa de fitoplaˆncton e zooplaˆncton em tanques(Techniques for Qualita-tive and QuantitaQualita-tive Analysis of Phytoplankton and Zooplankton in Tanks), 1st edition. Sa˜o Paulo, Brazil: Companhia Energe´tica de Sa˜o Paulo.
Reviers, B. (2006).Biologia e filogenia das algas(Algae Biology and Filogeny). Porto Alegre, Brazil: Artmed.
Robinson, T., McMullan, G., Marchant, R., and Nigam, P. (2001). Remediation of dyes in textile effluent: a critical review on current treatment technologies with a proposed alternative.
Bioresource Technol.77, 247.
Sauer, T., Cesconeto-Neto, G., Jose´, H.J., and Moreira, R.F.P.M. (2002). Kinetics of photocatalytic degradation of reactive dyes in a TiO2slurry reactor.J. Photoch. Photobio. A 149, 147.
Sousa, M.L., Moraes, P.B., and Bidoia, E.D. (2011). Photo-eletrolytic system applied to remazol red brilliant degrada-tion.Water. Sci. Technol. 63, 613.