Assessment of High and Low Rate Protocol-based
Attacks on Ethernet Networks
Mina Malekzadeh
Faculty of Electrical and ComputerEngineering, Hakim Sabzevari University
Sabzevar, Iran
M.A. Beiruti
Engineering Faculty of Golestan University
Gorgan, Iran
M.H. Shahrokh Abadi (
M’06
IEEE)
Faculty of Electrical and ComputerEngineering, Hakim Sabzevari University
Sabzevar, Iran
Abstract—The Internet and Web have significantly transformed the world’s communication system. The capability of the Internet to instantly access information at anytime from anywhere has brought benefit for a wide variety of areas including business, government, education, institutions, medical, and entertainment services. However, the Internet has also opened up the possibilities for hackers to exploit flaws and limitations in the target networks to attack and break in without gaining physical access to the target systems. The OSI layer protocol-based attacks are among them. In this work we investigate feasibility as well as severity of the attacks against three common layering protocols including TCP, UDP, and ICMP on Ethernet-based networks in the real world through a testbed. Then a simulation environment is designed to implement the exact same attacks under similar conditions using NS2 network simulator. The testbed results and simulation results are compared with each other to explore the accuracy of the findings and measure the damages the attacks caused to the network.
Keywords—protocol attacks; OSI layer attacks; UDP attacks; TCP attacks; ICMP attacks
I. INTRODUCTION
Online services have given users the opportunity to access data in a fast and convenient way. While the Internet has greatly amplified benefits for individuals and organizations, its critical importance has also attracted the attention of the hackers and attackers to conduct their malicious intentions.
Today, attacks against the networks are increasing in frequency, severity and sophistication. The flaws or bugs in operating systems or vulnerabilities and limitations in the TCP/IP protocols implementation are exploited to conduct the attacks which cause serious problems for normal networks operations. The OSI protocol-based attacks are among the common threats in today's cyber security landscape. The attacks are characterized by explicit attempts of the attackers to block the intended users from accessing the network services and rendering them unreachable, causing massive political or financial damages for the target networks. Losing money and time, physical harm, and invasion of privacy for individuals and organizations can be other objectives of the attacks [1].
Despite development of many mechanisms to defend against today's cybercrimes, protocol-based attacks are still regarded as an elevated threat which turns them into high concern of the organizations. Due to increasing the rate of
these attacks on government and corporate sites, their protection has become an ever-growing challenge that demands knowing the attacks methods in depth which in turn leads to finding solutions to effectively stay out of harm.
A. Contributions
This work investigates the feasibility and damage severity of different protocol-based attacks against the 802.3 Ethernet networks. The contributions of this paper are summarized in three-folds. First, a simulation environment is designed using NS2 to implement the attacks. Under different attack scenarios, we quantify the damage severity of the attacks. Second, a testbed is designed to measure the amount of damage imposed by the attacks against real target Ethernet networks. The testbed is designed with the same characteristics as the simulation environment to provide fair conditions for the comparison process. Third, the simulation results and the testbed results are compared to investigate the feasibility and severity of the attacks and also the accuracy of the findings.
The rest of this paper is organized as follows. Section II describes the protocol-based attacks which we aim to investigate in this paper and the related works regarding to these attacks. In Section III we propose an attack model to implement the attacks against Ethernet networks by designing different experiments in both the testbed and the simulation environment. We present and analyze the simulation results and the testbed results in Section IV. We conclude this paper in Section V.
II. RELATED WORKS
With various motives in mind, protocol-based attacks are carried out in a variety of forms and methods [1]. Some of the common attacks include TCP attacks (SYN attacks), smurf attack, port scan attack, UDP attacks, DNS-based attack, ICMP attack, Ping flood attack, IP fragmentation, and CGI attacks [4,8,9,11]. This paper studies the attacks against 802.3 Ethernet networks based on design flaws in three protocols as TCP, UDP, and ICMP. Below we summarize the attacks considered in this paper.
UDP-based attack occurs when the attackers send a large number of UDP packets to random ports to saturate the target. The attackers can also spoof the IP of the attack packets for two purposes: first to ensure that the excessive reply packets do not reach them; second to keep their network location anonymous. When the victim receives the UDP packets with spoofed source address, it checks for the application listening at that port. Since there is no application listens at that port, it replies with an ICMP destination unreachable which amplifies the attack [11]. These attacks are potentially severe and can dramatically bring down the business of companies [5].
TCP-based attack: Transmission Control Protocol (TCP) is used for reliable data transmission by establishing a connection between parties through a three-way handshake process. The protocol specifies no method for validating the
authenticity of the packet’s source. This implies that an
attacker can forge the source address to his desired. The TCP-based attack relies on sending a huge number of special TCP packets to the victim in order to exhaust its resources [2,3,7]. A typical type of TCP attack is SYN attack which exploits the TCP three-way handshake process. It sends TCP SYN packets with forged source addresses to a vulnerable victim machine. The victim system allocates the necessary resources, and then replies to the source address with SYN + ACK packet and waits for ACK packets to return back to the source side. Since the source address is forged, the source side will never return ACK packets. Therefore, the victim host continues to send SYN + ACK packets which eventually overflow the buffer and exhaust the resources of the target system [6].
ICMP-based attack: Internet Control Message Protocol (ICMP) is used to monitor the state of the networks, notify the hosts of a better route to reach the destinations, and report problems of the packets path. While ICMP is normally used to report network failures, it is also used by attackers to conduct attacks because the message is easy to counterfeit and attackers can send the protocol or port unreachable ICMP packet to the target with a false address [8]. This causes the
victim’s machine to slow down or to crash the TCP/IP buffer
and stop responding to requests made by the legitimate users [9].
There are few studies that investigated the above attacks. In [3] the authors carried out a simulation to examine the impact of TCP SYN attack on a network with different attack rates. Also authors in [11,14], only simulated TCP SYN attacks while no testbed ensures the accuracy of the results. In [16], the ICMP flooding attacks is simulated under three distinct scenarios. In [6], SYN attack is described as a typical attack but they do not implement the attack to investigate the possible effects. Also authors in [8,10,15] introduce some mechanisms of the attacks in detail but they do not implement the attacks.
In [9] a scheme was suggested to implement three types of attacks including TCP SYN, ICMP flooding, and smurf attacks. However, their work differs from ours in different aspects such as type of the attacks, experimental setup, metrics, network topology, and the features of the attacks.
Through a testbed, authors in [12] measure the impact of three types of attacks as TCP SYN, UDP flood, and ICMP attacks. They employ the flood option to consume the bandwidth as much as possible. However, due to this limitation, the implementation of the attacks does not consider different aspects of the attack packets such as size and rate.
The authors in [13] made an attempt to investigate the role of network queuing model on success rate of UDP flood attack. They implement UDP attack to compare several queuing systems and to determine whether the queuing methods in the target router can provide a better share of bandwidth to the legitimate users during the attack.
As it was described, the above studies differ from ours in different aspects as some merely describe the attacks with no implementation, some implement a specific attack while not considering the other attacks, and some simulate the attack with no testbed. We setup a testbed to implement the three common attacks using different experiments to measure the performance of the target network infected by the attacks. Then we design a simulation scheme using NS2 to implement the same attacks with the exact same attributes as our testbed. The testbed results and the simulation results are compared with each other to ensure the accuracy of the findings.
III. NETWORK TOPOLOGY
This section presents the simulation environment, description of the testbed setup, and the experiments to implement the attacks.
A. Simulation environment
We use NS2 for the required assessments and to simulate an Ethernet-based network environment which is referred to as the target of the attacks.
a)Simulation environment under no attack: In order to
see how the attacks affect the network performance, we need to measure the normal performance of the network to be compared with the performance under the attacks. Therefore, first we simulate the target network without any attacks on going. The simplified form of the target network consists of one sender (node0), one receiver (node2), and one Ethernet router (node1) is shown in Fig. 1.
Fig. 1. Simulation environment of the network with no attacks
Fig. 2. Simulation environment of the network under attacks
b)Network parameters: The simulation time is
considered 20s divided into two 10 seconds. In the first 10 seconds (0-9s) the network operates under normal conditions. The next 10 seconds (10-20s) is when the attacker initiates the attacks to disrupt the normal operation of the target network. During the entire simulation time, including before and during the attacks, a constant UDP traffic with the characteristics shown in Table I are transmitted in the network.
TABLE I. CONSTANT NETWORK PARAMETER
Parameter Value
Traffic type UDP/CBR
Packet size 1500B
Transmission rate 1Mbps
Simulation time 20s
c)Attack parameters and experiments: Based on the
three types of attacks described in the previous section, we design ten distinct experiments. The comparison between the attacks in the experiments is done in terms of the attack rates, type of the attack traffics, size of the attack packets, type of the attack target, and impact of the attacks:
Attack rates (intensity): we take two attack rates into account, categorized as: low rate attacks and high rate attacks.
Attack traffics: the types of traffics used to launch the attacks examined in this study are: UDP, ICMP, and TCP packets.
Attack packet size: different sizes are selected for the attack packets to examine the impact of the small, medium, and large packets on severity of the attacks. Attack target: the attacks will target both the client
machines (either Windows or Linux) and routers separately to compare vulnerability of the targets. Attack impact: severity of the attacks is quantified in
terms of our metrics as transmission delay, throughput, and packet lost rate.
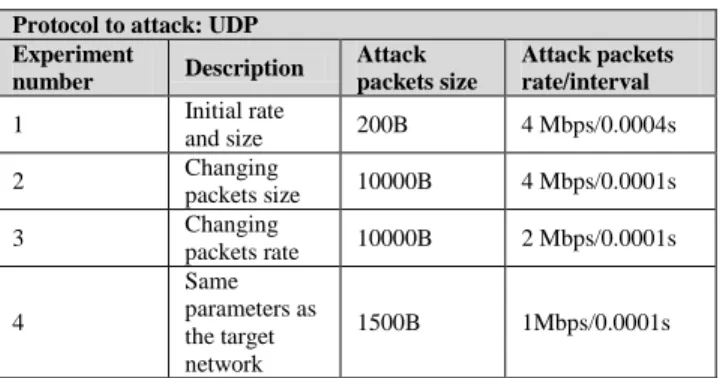
Based on the above variable attack parameters, the ten distinct experiments are designed to implement three types of attacks. These attacks are summarized in Table II, Table III, and Table IV.
TABLE II. EXPERIMENTS TO IMPLEMENT UDP-BASED ATTACKS
Protocol to attack: UDP Experiment
number Description
Attack packets size
Attack packets rate/interval
1 Initial rate
and size 200B 4 Mbps/0.0004s
2 Changing
packets size 10000B 4 Mbps/0.0001s
3 Changing
packets rate 10000B 2 Mbps/0.0001s
4
Same parameters as the target network
1500B 1Mbps/0.0001s
TABLE III. EXPERIMENTS TO IMPLEMENT TCP-BASED ATTACKS
Protocol to attack: TCP Experiment
number Description
Attack packets size
Attack packets interval
5 Initial rate
and size 1500B 0.0001s
6 Changing
packet size 200B 0.0001s
7 Changing
packet size 100B 0.0001s
TABLE IV. EXPERIMENTS TO IMPLEMENT ICMP-BASED ATTACKS
Protocol to attack: ICMP Experiment
number Description
Attack packets size
Attack packets interval
8 Initial rate and
size 5000B 0.00001s
9 Changing
packet size 500B 0.00001s
10
Changing packets interval & size
200B 0.001s
B. Testbed environment
We setup a testbed to measure the results of the attacks which are compared against the simulation results to verify the accuracy of the findings. Therefore, to fulfill our purpose, the hardware components and software configurations applied in our testbed are described as follows.
a)Hardware details
Router: wire router (brand remains unmentioned) with IDS enabled is used through all the experiments in the testbed to protect the target network as it is done in the real world. The router by default is configured to discard ping to WAN interface and the firewall features are enabled with default settings.
Clients Processor: Intel® core i7 2.70GHz Clients RAM: 4.00 GB
b)Software details
Traffic analyzer: Wireshark is used to capture the traffics and analyze the target network behavior. Operating system: heterogeneous operating systems
are selected for the source and destination clients as Windows7 and Linux Ubuntu11 respectively. The aim is to measure the overall resilience and behavior of different operating systems against the protocol-based attacks. Antivirus (brand remains unmentioned) with built-in firewall is protecting the source client with Windows7 on it. Furthermore, the windows firewall also is protecting the system. This is done because in the real world the computers and routers are also protected by antivirus or firewalls.
The testbed view to implement the attacks is presented in Fig. 3.
Fig. 3. Testbed setup to implement the attacks
The ten experiments mentioned in Table II, Table III, and Table IV are implemented in the testbed with the exact same conditions as the simulation except the duration time. Since the traffic transmission in the real networks has a random pattern, sometimes slow and sometimes fast, to observe the accurate behavior of the network, we double the observation time from 20s in the simulation to 40s in the testbed. The duration time in the simulation and the testbed before and during the attacks, are provided in Table V.
TABLE V. SIMULATION AND TESTBED DURATIONS
Network state Simulation time duration
Testbed time duration
Before the attacks 0-9s 0-19s
During the attacks 10-20s 20-40s
IV. RESULTS AND DISCUSSION
In this section, the simulation results and the testbed results of the ten experiments designed in our previous section are presented.
A. Experiment 1
In this experiment, the 1500B CBR traffics with 1Mbps rate are transmitted between the legal users while the attacker with spoofed UDP packets tries to attack the target network. The key motivation is to examine the impact of the
UDP-based attack, with the characteristics listed in Table I, on normal operation of the target network. The simulation results of this experiment are presented in Fig. 4 and Table VI as follows.
Fig. 4. Throughput and Packet lost before and during the attack
TABLE VI. DELAY BEFORE AND DURING THE ATTACK
Delay before attack (0-9s)
Delay during attack
(10-20s) Lost data
0.112 0.131632 5280Kb
As the results show, the attack is not able to completely saturate the target network. Before the attack, 0-9th second, the target network operates normally with no packet lost. However, as the attack starts at the 10th second, due to increasing the number of forgery UDP packets, losing the packets starts as well which continues until the attack ceases.
The zigzag shape of the curve in the throughput graph during the attack is caused by the fluctuation of the number of packets sent by the victim. Since the number of the attack packets overloads the router’s buffer, the attack packets are dropped which results in decreasing the congestion and providing the higher throughput.
Fig. 5. Throughput before and during the attack
In the graphs obtained by Wireshark analyzer, the x-axis is time and y-axis shows packets per second. Based on the graphs, we can see that the testbed results confirm the simulation results as the attack does not completely saturate the target network. During the attack duration we did not observe a remarkable degradation of the performance in term of throughput. The target network was still able to send packets during the time of this analysis under the attack.
During the attack we spoof the IP address of the attack packets for two reasons: first to ensure that the excessive reply packets do not reach the attacker device, second to keep the
attacker’s location anonymous. Since the source address of the forgery packets are spoofed, the victim replies with ICMP destination unreachable. These legitimate unnecessary replies help the attacker unknowingly by consuming more bandwidth as shown in Fig. 6.
Fig. 6. ICMP destination unreachable sent to the attacker by the victim
B. Experiment 2
As the second experiment, we increase the size of the attack packets while keeping the attack rate at the same level as the previous experiment. We intend to measure the impact of the UDP-based attack, with the characteristics listed in Table I, on normal operation of the target network. The simulation results of this experiment are presented in Fig. 7 and Table VII as follows.
Fig. 7. Throughput and Packet lost before and during the attack
TABLE VII. DELAY BEFORE AND DURING THE ATTACK
Delay before attack (0-9s)
Delay during attack
(10-20s) Lost data
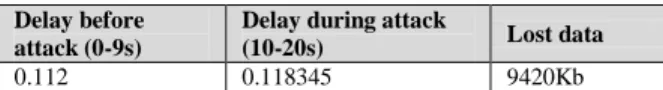
0.112 0.118345 9420Kb
Based on the results, as the attack starts at the 10th second, the attack packets quickly overwhelm the network so that after passing less than 2 seconds from the attack, they impose tremendous pressure over the network and shut it down. Unlike the previous throughput graph there is no zigzag because the overflow does not happen. As we can see, the bigger interval between the attack packets decreases the congestion and avoids dropping the attack packets.
In order to see if the attack in the real world has the same effect like the simulation, we run the above attack in the testbed. The testbed results of this experiment are presented in Fig. 8.
Fig. 8. Throughput before and during the attack
Attacker traffics
As we can see, the results of the attack in the testbed also confirm the simulation results in term of overwhelming the network and dropping the throughput down to zero. After starting the attack at the 20th second, the target network comes to a halt instantly and remains unavailable during the entire attack time. As the two peaks show, the very large size of the
attack packets also consumes the attacker’s bandwidth.
Consequently, after passing about 5 seconds, no new attack packet is transmitted while the target network is still suffering from the previous transmitted attack packets. We observed that, after about 10 seconds, the newer attack packets are again headed toward the victim.
In the above experiment our victim in the target network was the router. So we were curious about what would happen if the target is selected as a client with Windows7 or as a client with Ubuntu Linux. Therefore, to know whether having Windows or Linux can make a difference or provide possible resistance to the attack, we repeated the above experiment. We observe a Blue Screen of Death (BSOD) for the windows 7 client almost immediately after starting the attack. In contrast, the Linux Ubuntu client hanged and stopped working after about 3 seconds passing the attack while the CPU usage reached 100% and we had to restart it.
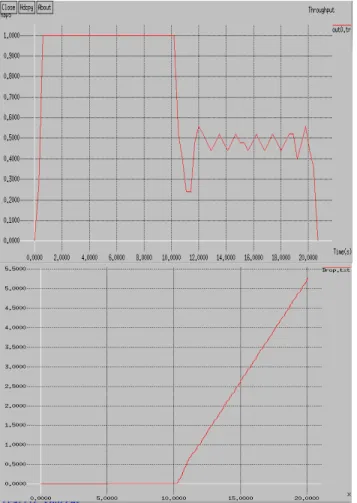
C. Experiment 3
In this experiment the size of the attack packets is kept the same as the previous experiment but the attack rate decreases to 1Mbps as described in Table I. We plan to examine the impact of the deduction in the attack intensity on the network operation. The simulation results of this experiment are presented in Fig. 9 and Table VIII as follows.
Fig. 9. Throughput and Packet lost before and during the attack
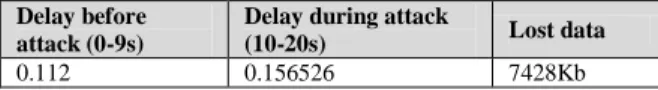
TABLE VIII. DELAY BEFORE AND DURING THE ATTACK
Delay before attack (0-9s)
Delay during attack
(10-20s) Lost data
0.112 0.156526 7428Kb
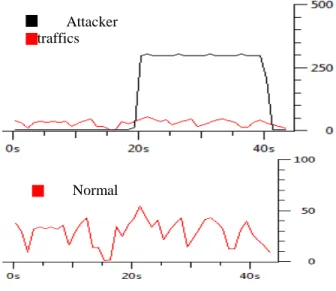
As the graph shows, due to reducing the attack rate compared to the previous experiment, the throughput degrades but does not get down to zero. The fewer packets lost also shows that the attack was not able to completely overwhelm the target network. In order to observe the network behavior in the real world under this attack, we run it on the testbed. The testbed results are presented in Fig. 10.
Fig. 10.Throughput before and during the attack
In the above results, the packets transmitted during the attack time provide evidence for survivability of the target network during the attack. The above results confirm that although the attack is able to change the normal operation, it is not able to completely saturate the network.
D. Experiment 4
Fig. 11.Throughput and Packet lost before and during the attack
TABLE IX. DELAY BEFORE AND DURING THE ATTACK
Delay before attack (0-9s)
Delay during attack
(10-20s) Lost data
0.112 0.118345 9420Kb
The above results show that although both the attack packets size and rate are smaller than before, the attack can instantly cause the network running out of the resources. Soon after starting the attack, throughput degrades to zero and remains zero until the end of the attack. This eliminates the assumption mentioned before. The reason is that, when the number of attack packets grows to a very high number, the link between the attacker and target will be overloaded, resulting in the dropping of the attack packets which ultimately decreases the effectiveness of the attack. The same happens when the attack intensity exceeds a threshold. On the other hand, by considering the fact that attackers typically intend to remain anonymous without leaving any trace behind, the attackers need to provide a balance between these two parameters: they must be high enough to effectively shut down the target network and be low enough to avoid dropping of the attack packets and also detecting the attackers.
To see whether the attack is also successful in the real world with these small attack packets and rate, we run the attack against the target network in our testbed. The testbed results are presented in Fig. 12.
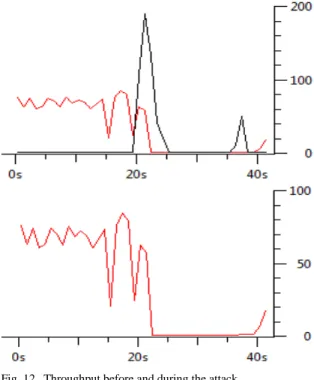
Fig. 12.Throughput before and during the attack
The above results also confirm the simulation results as 100% success rate for the attacker to shut down the target network. The normal transmission before the attack and zero transmission during the attack prove that the attack renders the network incapable of providing normal services even with small attack packets and low rate.
E. Experiment 5
Fig. 13.Throughput and Packet lost before and during the attack
TABLE X. DELAY BEFORE AND DURING THE ATTACK
Delay before attack (0-9s)
Delay during attack
(10-20s) Lost data
0.112 0.118345 9420Kb
As the above results show, the network capacity is quickly exhausted and the attack disables the network after only about 2 seconds. There is a gap less than 2 seconds since starting the attack until the throughput reaches zero. This gap is the time taken until the buffer of the router becomes full by the attack packets and overloads. The attack also results in significant losing the packets. The packet lost graph confirms that before overloading the router buffer, the packet lost is zero for about 2 seconds after starting the attack. Furthermore, the high number of packets lost during the attack causes less legal packets in the network which is the reason of a small difference between the delay of the packets before and during the attack.
In an attempt to observe the performance of the real target network under this attack, we implement the above attack against the testbed. The results are presented in Fig. 14.
Fig. 14.Throughput before and during the attack
To our surprise, the testbed results and simulation results show a complete different behavior. While the simulation results confirm a 100% success rate for the attacker to shutdown the network, the attack is completely unsuccessful in the real world. The transmission of the legal packets still
continues during the attack. We believe the reason aside from the protection offered by the firewall and antivirus, is the nature of the TCP protocol which demands going through a 3-way handshake before accepting any data which is done in NS2 by default unlike the real world.
F. Experiment 6
The concept in this experiment is that by keeping the attack intensity as the previous experiment, the size of the attack packets becomes larger to see the possible effects on the severity of the attack. The simulation results of are presented in Fig. 15 and Table XI.
Fig. 15.Throughput and Packet lost before and during the attack
TABLE XI. DELAY BEFORE AND DURING THE ATTACK
Delay before attack (0-9s)
Delay during attack
(10-20s) Lost data
0.112 0.113897 9612Kb
According to the above results, the attack is successful to saturate the target network by dropping the throughput to zero. The reason for increasing the throughput between 19-20th second is that, due to small attack packet intervals and also limited queue capacity, the router buffer overflows and it drops the attack packets. This results in an empty queue and less congestion therefore the legal packets can be delivered to the destination which increases the throughput.
The difference between the normal delay and the delay during the attack is not considerable. The reason is that, the delay shown during the attack is related to the received packets while NS2 overlooks the time spent on the processing of the packets which have been lost due to the attack. Since during the attack, only a small number of packets reach the destination, they experience small delay.
quickly overload the destination’s buffer resulting in dropping the attack packets which in turn reduces the impact of the attack. Also increasing the attack rate consumes more CPU and RAM of the attacker causing less effectiveness of the attack. To address the certitude of this, we repeat the above experiment with larger attack packets as 4500B and the same attack rate. The simulation results and testbed results are presented in Fig. 16 and Fig. 17 respectively.
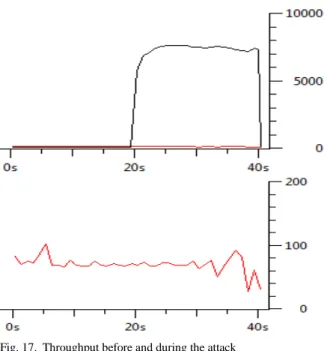
Fig. 16.Throughput before and during the attack
Fig. 17.Throughput before and during the attack
The above outcomes also confirm that due to the massive grow in the number of forgery packets, they are dropped by the target network which consequently decreases the impact of the attack.
G. Experiment 7
As we know, smaller attack packets and intensity can help the attackers to remain anonymous and not be detected. In this experiment, while we keep the same amount of packet interval as the previous experiment, we decrease the size of the attack packets to 100B as mentioned in Table II to see the success rate of the attack despite the smaller attack packets. The simulation results are presented in Fig. 18 and Table XII.
Fig. 18.Throughput and Packet lost before and during the attack
TABLE XII. DELAY BEFORE AND DURING THE ATTACK
Delay before attack (0-9s)
Delay during attack
(10-20s) Lost data
0.112 0.120562 6660Kb
As the graphs show the attack does not reach 100% success rate. Although the attack is not able to degrade the throughput down to zero, it can severely destabilize the network.
In order to determine the impact of this attack on the Ethernet networks in the real world, we implement this attack against the testbed. The testbed results are presented in Fig. 19.
Based on the above results, as we can see the attack in the real world also is not effective.
Since with the attributes specified for all the TCP-based attack experiments we did not lead to much success in the real world, we decided to change the attack parameters to see whether we can have any success with TCP packets in the testbed. Therefore, we configured the attacker’s device to run the attack on the testbed as fast as the network card is capable to and we repeated the experiment. The results are presented in Fig. 20.
Fig. 20.Throughput before and during the attack
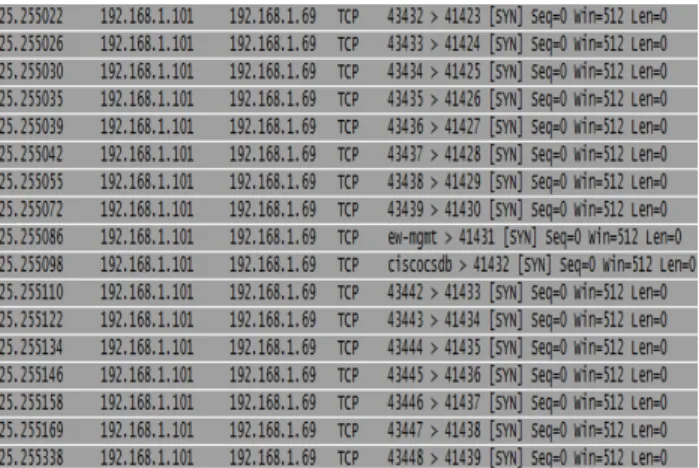
The null throughput during the attack provides evidence that the TCP-based attack successfully crashes the target system in the real world. The Fig. 21 captures the forgery TCP packets overwhelm the target network.
Fig. 21.Forgery TCP packets overwhelm the network
We also repeated the above experiment with a specific type of TCP packet, SYN, to open incomplete connections with the target network. The testbed results of the SYN attack is presented in Fig. 22.
Fig. 22.Throughput before and during the attack
As the above results show, by providing the null throughput, the attack severely disrupts the target system’s operation and renders the services entirely unavailable for the intended users. The SYN packets received by the victim router are presented in Fig. 23.
Fig. 23.Forgery TCP-SYN packets overwhelm the network
H. Experiment 8
Fig. 24.Throughput and Packet lost before and during the attack
TABLE XIII. DELAY BEFORE AND DURING THE ATTACK
Delay before attack (0-9s)
Delay during attack
(10-20s) Lost data
0.112 0.265483 2568Kb
As the throughput results indicate the influence of the attack is not remarkable. The zigzag patterns, as we mentioned before, are related to overloading the buffer of the router. The difference between the delay before and during the attack is high due to the small number of lost packets. Since only a few packets are lost, the number of legal packets is high in the network. Therefore, congestion occurs in the system and consequently the packets experience higher delay during the delivery process to the destination.
In order to see if the above effects are also valid in the real world, we implement the attack over target system on the testbed. The testbed results are presented in Fig. 25.
Fig. 25.Throughput before and during the attack
The testbed results are similar to the simulation results in term of slowing down the network. However, the simulation results show higher throughput than the testbed outcomes.
We observed that in the testbed, the attack did not disable the target network but it dramatically slows it down so that even a simple network task such as opening a website took a relatively long time.
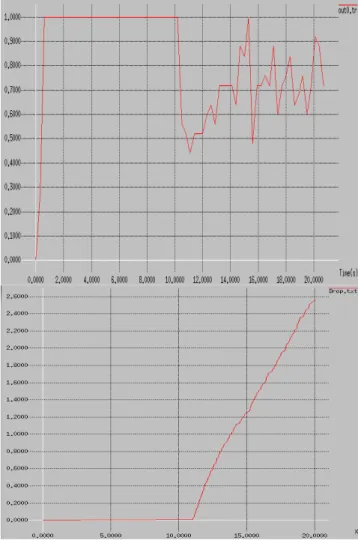
I. Experiment 9
Fig. 26.Throughput and Packet lost before and during the attack
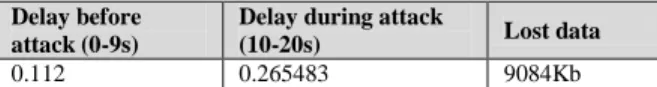
TABLE XIV. DELAY BEFORE AND DURING THE ATTACK
Delay before attack (0-9s)
Delay during attack
(10-20s) Lost data
0.112 0.265483 9084Kb
Comparing the above results with the outcomes of the previous experiments shows that under the same attack rate, the ICMP-based attack with the smaller packets is more efficient than the larger packets in term of making the network unreachable. The reason, as already explained, is related to the extreme grow in the number of the attack packets which results in dropping them and reducing the efficiency of the attack. However, since in this experiment the attack packets are much smaller than the previous experiment, the attack packets are not dropped and efficiently make a break in the network performance.
Like before, the two peaks in the throughput graph at 17th and 19th seconds show the overloading of the router buffer. Due to the huge number of attack packets, they are dropped which makes the media free and available for the normal users for a very short time.
To evaluate the impact of the above attack on Ethernet networks in the real world, we run the same attack on the testbed. The results are presented in Fig.
Fig. 27.Throughput before and during the attack
The above testbed results confirm the simulation results. The attack successfully brings the target network to a complete halt and makes it inaccessible for its legal users. Based on the above results, soon after launching the attack, the victim is saturated and the forgery packets render the network shut down.
J. Experiment 10
In this experiment we decrease both the attack packets size and the attack intensity to see whether the lower rate ICMP-based attack with features listed in Table III can still infect the normal operation of the target network. The simulation results are presented in Fig. 28 and Table XV.
TABLE XV. DELAY BEFORE AND DURING THE ATTACK
Delay before attack (0-9s)
Delay during attack
(10-20s) Lost data
0.112 0.113103 9720Kb
The above results confirm our previous results so that larger attack packets or attack rate do not necessarily cause the attack to be more destructive. To conclude and confirm it, we repeated the above experiment by increasing the attack size from 200B to 550B. The results are presented in Fig. 29.
Fig. 29.Throughput and Packet lost before and during the attack
As we expected, these new results show that largely increasing the size of the attacks packets can degrade the impact of the attacks because of dropping of huge number of the attacks packets due to the overloading of the buffer.
The above experiment with 200B attack packets performed over the testbed to observe the attack effectiveness in the real world. The testbed results are presented in Fig. 30.
Fig. 30.Throughput before and during the attack
The above results confirm the simulation results being that the attack severely limits access to the network. The null
throughput during the attack indicates that the attack is completely successful to render the network shutdown.
V. CONCLUSION
In this work we conducted several protocol-based attacks against Ethernet networks through both simulation and testbed. By comparing the results of the experiments we conclude that the size of the attack packets and attack rate are the two key factors which directly affect the success rate of the attackers. However, there are no specific values for these parameters to shut down the target network. It relies on different items including the target networks topology, traffic transmission aspects, and bandwidth of the target network. Based on the results increasing both the attack packets size and attack rate can self-congest at some bottleneck and not reach the intended destination which consequently decreases the effectiveness of the attack. By considering the fact that larger attack packets or higher attack intensity can reveal the attackers location, providing a balance between these parameters must be taken into account by the attackers.
REFERENCES
[1] W.Kim, O.Jeong, C.Kim, and J.So. The dark side of the Internet:
Attacks, costs and responses. Elsevier journal of Information Systems, Vol. 36, No. 3, pp. 675-705, 2011.
[2] C.Aldar and F.Chan. Efficient defense against misbehaving TCP
receiver DoS attacks. Elsevier journal of Computer Networks, Vol. 55,
No. 17, pp. 3904–3914, 2011.
[3] M.Narita, T.Katoh, B.Bahadur, and T.Takata. A Distributed Detecting
Method for SYN Flood Attacks and Its Implementation Using Mobile Agents. In Proceedings of the International Conference on Multiagent System Technologies (Springer MATES), pp. 91-102, 2009.
[4] J.Sen. A Novel Mechanism for Detection of Distributed Denial of
Service Attacks. In Proceedings of the First International Conference on Computer Science and Information Technology (Springer CCIS), Vol. 133, pp. 247–257, 2011.
[5] L.Kavisankar and C.Chellappan. T-RAP: (TCP Reply
Acknowledgement Packet) a Resilient Filtering Model for DDoS Attack with Spoofed IP Address. Trends in Network and Communications in
Computer and Information Science, Vol. 197, pp. 138–148, 2011.
[6] X.Wei. Analysis and Protection of SYN Flood Attack. Springer journal
of Advances in Computer Science, Intelligent System and Environment, pp. 183–187, 2011.
[7] M.Jensen, N.Gruschka, and N.Luttenberger. The Impact of Flooding
Attacks on Network-based Services. IEEE Third International Conference on Availability, Reliability and Security, pp. 509-513, 2008.
[8] W.Liu. Research on DoS Attack and Detection Programming. IEEE
Third International Symposium on Intelligent Information Technology Application, Vol. 1, pp. 207-210, 2009.
[9] S.Tritilanunt, S.Sivakorn, C.Juengjincharoen, and A.Siripornpisan.
Entropy-based Input-Output Traffic Mode Detection Scheme for
DoS/DDoS Attacks. IEEE International Symposium on
Communications and Information Technologies (ISCIT), pp. 804-809, 2010.
[10] H.Beitollahi and G.Deconinck. Analyzing well-known countermeasures
against distributed denial of service attacks. Elsevier Journal of
Computer Communications, Vol. 35, No. 11, pp. 312–1332, 2012.
[11] S.Gavaskar, R.Surendiran, and E.Ramaraj. Three Counter Defense
Mechanism for TCP SYN Flooding Attacks. International Journal of Computer Applications, Vol. 6, No. 6, pp. 12-15, 2010.
[12] B.Qasim and M.Musawi. Mitigating DoS/DDoS attacks using iptables.
International Journal of Engineering & Technology (IJET), Vol. 12, No. 3, pp. 1-11, 2012.
[14] S. Oshima and T. Nakashima. Performance Evaluation for Linux under SYN Flooding Attacks. International Journal of Innovative Computing, Information and Control (IJICIC), Special Issue on New Trends in Information Processing and Applications, Vol. 5, No. 3, pp. 1-4, 2009.
[15] K.W.M. Ghazali and R.Hassan. Flooding Distributed Denial of Service
Attacks-A Review. Journal of Computer Science, Vol. 7, No. 8, pp. 1218-1223, 2011.
[16] A.Kumar, A.Sharma, and A.Singh. Performance Evaluation of