Transcriptome Profiling of Two Asparagus
Bean (
Vigna unguiculata subsp
.
sesquipedalis
) Cultivars Differing in Chilling
Tolerance under Cold Stress
Huaqiang Tan1, Haitao Huang2, Manman Tie3, Yi Tang1, Yunsong Lai1, Huanxiu Li1*
1College of Horticulture, Sichuan Agricultural University, Chengdu, Sichuan, China,2Mianyang Institute of Agricultural Sciences, Mianyang, Sichuan, China,3Dazhou Institute of Agricultural Sciences, Dazhou, Sichuan, China
Abstract
Cowpea (V.unguiculataL. Walp.) is an important tropical grain legume. Asparagus bean (V.
unguiculata ssp.sesquipedialis) is a distinctive subspecies of cowpea, which is considered one of the top ten Asian vegetables. It can be adapted to a wide range of environmental sti-muli such as drought and heat. Nevertheless, it is an extremely cold-sensitive tropical spe-cies. Improvement of chilling tolerance in asparagus bean may significantly increase its production and prolong its supply. However, gene regulation and signaling pathways related to cold response in this crop remain unknown. Using Illumina sequencing technol-ogy, modification of global gene expression in response to chilling stress in two asparagus bean cultivars—“Dubai bean”and“Ningjiang-3”, which are tolerant and sensitive to chilling, respectively—were investigated. More than 1.8 million clean reads were obtained from each sample. After de novo assembly, 88,869 unigenes were finally generated with a mean length of 635 bp. Of these unigenes, 41,925 (47.18%) had functional annotations when aligned to public protein databases. Further, we identified 3,510 differentially expressed genes (DEGs) in Dubai bean, including 2,103 up-regulated genes and 1,407 down-regu-lated genes. While in Ningjiang-3, we found 2,868 DEGs, 1,786 of which were increasing and the others were decreasing. 1,744 DEGs were commonly regulated in two cultivars, suggesting that some genes play fundamental roles in asparagus bean during cold stress. Functional classification of the DEGs in two cultivars using Mercator pipeline indicated that RNA, protein, signaling, stress and hormone metabolism were five major groups. In RNA group, analysis of TFs in DREB subfamily showed that ICE1-CBF3-COR cold responsive cascade may also exist in asparagus bean. Our study is the first to provide the transcrip-tome sequence resource for asparagus bean, which will accelerate breeding cold resistant asparagus bean varieties through genetic engineering, and advance our knowledge of the genes involved in the complex regulatory networks of this plant under cold stress.
OPEN ACCESS
Citation:Tan H, Huang H, Tie M, Tang Y, Lai Y, Li H (2016) Transcriptome Profiling of Two Asparagus Bean (Vigna unguiculata subsp.sesquipedalis) Cultivars Differing in Chilling Tolerance under Cold Stress. PLoS ONE 11(3): e0151105. doi:10.1371/ journal.pone.0151105
Editor:Matsuo Uemura, Iwate University, JAPAN
Received:October 19, 2015
Accepted:February 22, 2016
Published:March 8, 2016
Copyright:© 2016 Tan et al. This is an open access article distributed under the terms of theCreative Commons Attribution License, which permits unrestricted use, distribution, and reproduction in any medium, provided the original author and source are credited.
Data Availability Statement:1. All the clean reads were deposited into NCBI Sequence Reads Archive (SRA) with accession number SRP061809. 2. This Transcriptome Shotgun Assembly project has been deposited at GenBank under the accession GDKT00000000. The version described in this paper is the first version, GDKT01000000.
Funding:The authors have no support or funding to report.
Introduction
Low temperature is one of the major environmental factors limiting growth, development and geographical distribution of plants, and causes significant losses periodically [1,2]. Stress caused by low temperature can be divided into chilling stress (0–15°C) and freezing stress (<0°C). Most temperate plants, such as spinach andArabidopsis, possess various degree of chilling tolerance and can acquire freezing tolerance after exposure to non-freezing tempera-tures, a process known as cold acclimation [3]. On the other hand, some plants from tropical and subtropical regions, like rice, maize and tomato, are easily damaged by chilling stress due to the inability for cold acclimation. InArabidopsisand winter cereals, the mechanism of cold acclimation and acquired freezing tolerance has been extensively investigated [4]. In order to adapt to cold stress during acclimation, expression of genes is reprogrammed and metabolism is altered. Cold tolerance is a highly complex trait, a large amount of genes are involved in cold response of plants [5]. 4%–14% ofArabidopsistranscriptome is cold responsive [6]. Cold stress triggers membrane rigidification and cytoskeleton reorganization of cells, which is followed by Ca2+-influx from both extra- and intra-cellular sources and activation of protein kinase cas-cades, eventually leading to activation of transcription factors and expression of COR (cold-regulated) genes [7].
Cowpea,Vigna unguiculataL. Walp. (2n = 2x = 22), is an important grain legume, which ranks fifth worldwide as a source of plant protein and fiber [8]. Cowpea is presumed to be orig-inated from Africa [9], and the subspeciessesquipedialisis one of the main cultivated divisions of cowpea worldwide [10]. It is also called asparagus bean or‘yard long’bean, and is mainly cultivated in eastern and southern Asia for production of immature green pods [11]. Current cowpea varieties are sensitive to chilling, and the cool night temperatures of spring would greatly influence its growth and flowering. So far, some progress has been made by Ismail’s group in breeding cowpeas with chilling tolerance during emergence [12]. They proposed that chilling tolerance during emergence is conferred by the presence of a specific dehydrin protein in the seed [13]. Later, they proved the hypothesis that the dehydrin protein confers an incre-ment of chilling tolerance under single nuclear gene inheritance [14,15].
On the other hand, research on low temperature response in asparagus bean is extremely limited by lack of cold tolerant material. Dubai bean is a variety introduced from Dubai, the United Arab Emirates, by Mianyang Institute of Agricultural Sciences, Mianyang, Sichuan, China. Most asparagus bean cultivars cannot survive in late autumn (November) except Dubai bean, which makes it a cold tolerant variety. However, it bears less pods and its productivity is poor. Therefore, improving cold tolerance of asparagus bean cultivars is possible by crossing, but some unfavorable agronomic traits may be imported as well. Although several major-effect QTLs can be identified and cloned by QTL mapping, this is hard to achieve due to the fact that cowpea is an entirely self-pollinated crop [16], the success of artificial pollination has been reported to be low, and that the preparation of mapping populations can take years, and map-based cloning is tedious, hampering the quick identification of candidate genes [17]. To improve cold tolerance without obstacles mentioned above, developing transgenic plants is a fast and effective biotechnological tool. Moreover, with the advancement of RNA-Seq, which is a recently developed approach to transcriptome profiling that uses deep-sequencing technolo-gies [18], it allows us to rapidly analyze cold responsive genes of plants, and use“reverse genet-ics”strategy to identify candidate genes, thus providing available gene resources for molecular breeding.
transcriptomes between different species [19–21] and dissimilar genotypes [22–24]. In order to explore gene regulation and signaling pathways in asparagus bean when subjected to cold stress, and analyze the differences between two varieties, we used RNA-seq to investigate gene expression patterns between Dubai bean (cold tolerant) and Ningjiang-3 (non-cold tolerant) under 4°C treatment. The results will facilitate the discovery of cold resistance genes in aspara-gus bean, which provides resources for genetic improvement, and shed light on the molecular mechanisms related to cold tolerance in this plant.
Materials and Methods
Plant materials
Two asparagus bean cultivars tested in this study, Dubai bean (cold tolerant) and Ningjiang-3 (non-cold tolerant), were provided by Mianyang Institute of Agricultural Sciences, Mianyang, Sichuan, China (SeeS1 Fig). Seeds were presoaked for 4h and incubated in 25°C for 24h, then sowed in pots filled with vermiculite and perlite (V:V = 1:1). Subsequently, these pots were transferred into a growth chamber set to 25°C and 14h light/10h dark period, and watered every two days after seedling emergence. After two weeks, half of the seedlings of each cultivar were transferred to another chamber set to 4°C, while other conditions remained unchanged. 24 hours later, one well developed leaf was harvested from each seedling. Untreated seedlings were used as controls (25°C). More than 20 seedlings were collected for each cultivar. These collected leaves were frozen in liquid nitrogen immediately and stored at−80°C.
RNA extraction and quality determination
Five leaves harvested from each cultivar were pooled for RNA extraction. Total RNA was extracted with plant RNA Reagent (Invitrogen, Cat.No. 12322–012) following the manufactur-er’s protocol. The quality of RNA was determined by a NanoDrop ND-1000 spectrophotome-ter (Thermo Fisher Scientific, MA, USA). RNA integrity was confirmed by electrophoresis on 1.5% agarose gel.
cDNA library construction and sequencing
Approximately 20μg of total RNA from each of four pools (NRT, NCT, CRT and CCT, the
first letter“N”stands for the non-cold tolerant cultivar, i.e. Ningjiang-3;“C”represents the cold tolerant cultivar, i.e. Dubai bean;“RT”means room temperature and“CT”indicates cold treatment) was used for Illumina sequencing at Biomarker technologies (Beijing, China). cDNA library construction was performed via following steps. First, mRNA was purified with biotin-Oligo (dT) magnetic bead and was randomly sheared by Fragmentation Buffer. Second, using these sheared fragments as template, first strand cDNA was synthesized with random hexamers, then buffer, dNTPs, RNase H and DNA polymerase I were added to synthesize sec-ond-strand cDNA, the product of which was purified with AMPure XP beads. Furthermore, purified double-strand cDNA was end-repaired, poly-A tail-added and ligated to Illumina adapter, then AMPure XP beads were used to select fragment size. Finally, cDNA libraries were obtained by PCR enrichment. In total, we constructed four paired-end libraries and sequencing of the purified libraries were carried out on a Hiseq2500 (Illumina Inc., USA).
Data analysis
Trinity (release 20131110) [25] to form a single set of non-redundant unigenes. After assembly, unigenes were compared to NR [26], Swiss-Prot [27], GO [28], COG [29], KOG [30] and KEGG [31] databases using BLAST [32] with a cut-off E-value of10−5. Moreover, using
HMMER software [33] with an E-value threshold of10−10, amino acid sequences translated
from the unigenes were aligned to Pfam [34] database, in order to gather information about the function and structure of proteins of unigenes.
To get assembly statistics for the percentage of reads that could be mapped back to tran-scripts (mapped ratio), bowtie (version 1.1.1) [35] was used to align short reads to the tran-scripts. According to the results, transcript abundance was estimated with RSEM (version 1.2.3) [36]. FPKM (Fragments Per Kilobase of transcript per Million mapped reads) [37] was used to quantify the expression level of unigenes. FPKM/RPKM [38] is currently the most pop-ular method for normalizing RNA-seq gene expression. FPKM is computed similarly to RPKM, except it accounts for the scenario in which only 1 end of a pair-end read is mapped [39]. This value can be directly applied to compare gene expression level among samples. FPKM is calculated as follows:
FPKM¼ cDNA Fragments
Mapped FragmentsðMillionsÞ Transcript LengthðkbÞ
In this formula, cDNA Fragments is the number of reads that aligned to a specific unigene, Mapped Fragments (Millions) is the total number of reads that aligned to all unigenes, Tran-script Length (kb) is the length of the unigene.
Identification of differential expressed genes (DEGs)
Differentially expressed genes (DEGs) between cold treated and control samples were identi-fied by EBSeq (Version 1.6.0) [40] based on a rigorous algorithm developed by Audic and Clav-erie [41]. FDR (False Discovery Rate) control method [42] was applied in multiple hypothesis testing to correct the results for p value. An“FDR<0.01 and FC (fold change)2”was set as the threshold to determine the significance of gene expression difference. FC stands for the ratio of FPKM between cold treated and control samples. At last, Mercator tool [43] was employed to analyze these DEGs for functional annotation and classification.
Validation by qRT-PCR
Leaves harvested from three independent seedlings of both cold-treated and control samples of each cultivar were used as three biological replicates. Total RNA was extracted with RNAiso Plus (TaKaRa, Dalian, China) and cDNA was synthesized by PrimeScript RT reagent Kit With gDNA Eraser (Takara, Dalian, China) according to the manufacturer’s instructions. 16 DEGs, which were up-regulated in both Dubai bean and Ningjiang-3 under cold treatment, were ran-domly picked out for validation. Primers were designed using Primer3 (http://bioinfo.ut.ee/ primer3-0.4.0/) and synthesized by Invitrogen. Details of selected genes and the sequence of primers were listed inS1 Table. All primers were amplified with no template control to make sure the amplicons were not primer dimers. Experiments were carried out with three technical replicates using SYBR1Premix Ex Taq TM II (Takara, Dalian, China) on Bio-Rad CFX96 Real-Time PCR system (Bio-Rad, USA). Gene expression levels were normalized against the geometric mean of two soybean reference genes,GAPDH(GenBank: XM_003523083) and
Results
Illumina sequencing, de novo assembly and annotation
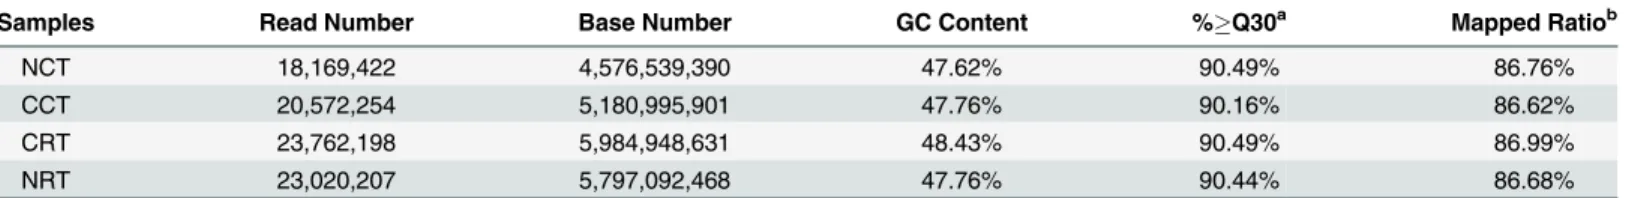
In this experiment, we constructed four cDNA libraries, including NCT and NRT, which rep-resent cold-treated and room-temperature (control) samples from Ningjiang-3, respectively, and likewise, CCT and CRT, except that they are from Dubai bean. Then these cDNA libraries were sequenced on Illumina HiSeq2500. After removing sequencing adaptors and low quality data, we obtained 21.54 Gb clean data, more than 90% reads had a quality score ofQ30 (sequencing error rate, 0.1%). Statistics of sequencing data is listed inTable 1. All the clean reads were deposited into NCBI Sequence Reads Archive (SRA) with accession number SRP061809.
Transcriptomede novoassembly was performed using Trinity, a short reads assembling program [25]. All together, 179,128 transcripts and 88,869 unigenes were generated. The aver-age transcript size exceeded 1237 bp, with the N50 of 2260 bp. The total length of unigene was 56,451,512 bp with a mean length of 635 bp and an N50 of 1169 bp. Detail information is shown inS2 TableandS2 Fig. This Transcriptome Shotgun Assembly project has been depos-ited at GenBank under the accession GDKT00000000. The version described in this paper is the first version, GDKT01000000.
After assembly, the 88,869 all-unigenes were subjected to public protein databases including NR, Swiss-Prot, GO, COG, KOG and KEGG using BLAST (E value10−5). Furthermore,
using HMMER software (E value10−10), amino acid sequences translated from the unigenes
were aligned to Pfam databse. Eventually, a total of 41,925 (47.18%) unigenes were annotated. Statistics and detailed annotation of the unigenes were presented inS3andS4Tables, respectively.
Gene expression level evaluation
FPKM was used to quantify the expression level of unigenes. The expression level detected by RNA-seq is highly sensitive. Normally, FPKM of genes encoding proteins ranged from 10−2to
104[44]. Overall distribution of gene expression level of four libraries is shown inS3 Fig, sug-gesting that the alteration of gene expression is more visible in Dubai bean compared to Ning-jiang-3.
Identification of differential expressed genes (DEGs) under cold stress
In the process of DEGs screening, we used“FDR<0.01 and FC (fold change)2”as the threshold to determine the significance of gene expression difference. FC is the ratio of FPKM
Table 1. Overview of the sequencing results.
Samples Read Number Base Number GC Content %Q30a Mapped Ratiob
NCT 18,169,422 4,576,539,390 47.62% 90.49% 86.76%
CCT 20,572,254 5,180,995,901 47.76% 90.16% 86.62%
CRT 23,762,198 5,984,948,631 48.43% 90.49% 86.99%
NRT 23,020,207 5,797,092,468 47.76% 90.44% 86.68%
NCT, Ningjiang-3 (non-cold tolerant) Cold Temperature; NRT, Ningjiang-3 (non-cold tolerant) Room Temperature; CCT, Dubai bean (cold tolerant) Cold Temperature; CRT, Dubai bean (cold tolerant) Room Temperature.
aThe percentage of clean reads whose quality score was more than 30.
between cold treated and control samples. In total, we identified 3510 DEGs in Dubai bean, including 2103 (60%) up-regulated genes and 1407 (40%) down-regulated genes. In Ningjiang-3, we found 2868 DEGs, among which 1786 (62%) were induced and 1082 (38%) were sup-pressed. Hierarchical cluster analysis was carried out with these DEGs. Genes with same or similar expression profile were clustered, so as to present differential expressing patterns of gene sets under various experimental conditions. Cluster results of DEGs in four libraries are shown inS4 Fig.
1744 DEGs were found in both Dubai bean and Ningjiang-3, reflecting the common cold response in both varieties. When these two cultivars were exposed to low temperature, the number of up-regulated genes was higher than that of down-regulated genes, and Dubai bean had more DEGs than Ningjiang-3, indicating more complex cold response pathways in Dubai bean. The DEGs of Dubai bean and Ningjiang-3 under cold stress are listed inS5andS6 Tables, respectively.
In general, the change of gene expression in Ningjiang-3 is not as noticeable as Dubai bean. In CCT library, fold change of DEGs ranged from -247 to 657, while in NCT library, this parameter fluctuated between -92 and 263. In CCT and NCT, 46 and 9 DEGs changed at least 100 fold, respectively. In CCT, c50195.graph_c0 was the highest up-regulated gene (654 fold). It was annotated as unknown protein by Mercator tool. Whereas c52324.graph_c0 showed the greatest decrease in expression (-248 fold), which encodes a member of Pectate lyase family protein. In NCT, c49580.graph_c2 exhibited the highest expression level (262 fold) and was also annotated as unknown protein. While c50375.graph_c0 expression displayed the most dramatic repression (-92 fold), which encodes ethylene response factor 1 (ERF1). Since the function of the highest up-regulated gene in each library is unclear, further analysis for func-tional identification of these genes is needed.
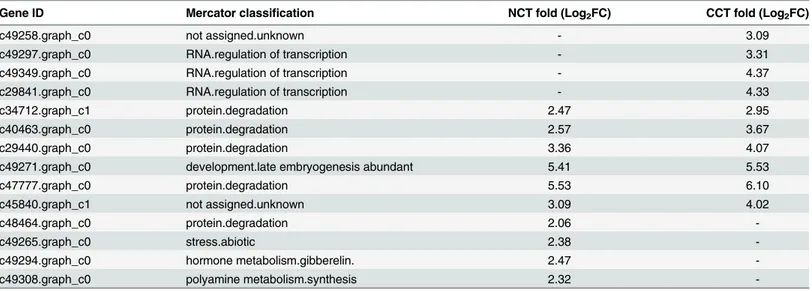
Apart from those genes that showed the greatest changes in expression, some genes with the highest expression level (FPKM value) deserve attention, because these genes may also play important roles in cold tolerance. Genes with the top ten FPKM in CCT and NCT are listed in Table 2. Six genes were common to both libraries, four of which (c34712.graph_c1, c40463. graph_c0, c29440.graph_c0 and c47777.graph_c0) were associated with protein degradation. They encode polyubiquitin UBQ14, UBQ3, matrixin family protein and eukaryotic aspartyl protease family protein, respectively. Another gene, c49271.graph_c0, was related to
Table 2. List of the top ten genes with the highest FPKM in CCT and NCT.Data in bold symbolize genes shared by CCT and NCT.
Gene ID Mercator classification NCT fold (Log2FC) CCT fold (Log2FC)
c49258.graph_c0 not assigned.unknown - 3.09
c49297.graph_c0 RNA.regulation of transcription - 3.31
c49349.graph_c0 RNA.regulation of transcription - 4.37
c29841.graph_c0 RNA.regulation of transcription - 4.33
c34712.graph_c1 protein.degradation 2.47 2.95
c40463.graph_c0 protein.degradation 2.57 3.67
c29440.graph_c0 protein.degradation 3.36 4.07
c49271.graph_c0 development.late embryogenesis abundant 5.41 5.53
c47777.graph_c0 protein.degradation 5.53 6.10
c45840.graph_c1 not assigned.unknown 3.09 4.02
c48464.graph_c0 protein.degradation 2.06
-c49265.graph_c0 stress.abiotic 2.38
-c49294.graph_c0 hormone metabolism.gibberelin. 2.47
-c49308.graph_c0 polyamine metabolism.synthesis 2.32
development, which encodes AtLEA5 (late embryogenesis abundant like protein), also known as SENESCENCE-ASSOCIATED GENE 21 (SAG21). It has a role on oxidative stress tolerance and its mRNA levels are elevated in response to various stresses. Another gene, c45840. graph_c1, had no available description. The expression levels of these six genes were higher in CCT than in NCT.
Besides, CCT and NCT owned four unique genes, respectively. In CCT, three of four spe-cific genes (c49297.graph_c0, c49349.graph_c0 and c29841.graph_c0) were related to regula-tion of transcripregula-tion, which encode related to ABI3/VP1 2 (RAV2), salt tolerance zinc finger (STZ), and zinc finger (CCCH-type) family protein, respectively. The other gene c49258. graph_c0 had unknown function. In NCT, the four exclusive genes (c48464.graph_c0, c49265. graph_c0, c49294.graph_c0 and c49308.graph_c0) encode ubiquitin 11 (UBQ11), germin-like protein (GLP1), Gibberellin-regulated family protein and S-adenosylmethionine decarboxylase proenzyme, respectively.
DEG classification
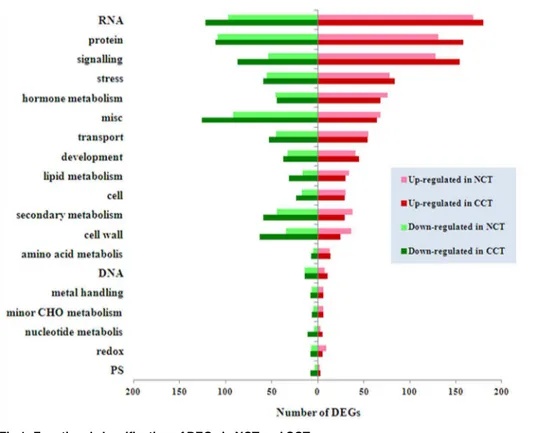
In order to better understand the biological function of DEGs, we used Mercator pipeline to annotate and cluster DEGs of CCT and NCT libraries, annotation results of which are listed in S7andS8Tables, respectively. Clusters with more than ten DEGs are displayed inFig 1. The results showed that in both libraries, genes involved in RNA comprised the largest functional group. Other major groups included protein, signaling, stress and hormone metabolism. There-fore, our analysis is focused on these aspects. In these groups, the number of up-regulated or down-regulated genes in CCT was higher than NCT, except for hormone metabolism group. In CCT and NCT, 1774 (50%) and 1358 (47%) DEGs were clustered in“not assigned”, respectively. Some of them may be novel genes involving in cold response that have never been reported.
Fig 1. Functional classification of DEGs in NCT and CCT.
Transcription factors (TFs)
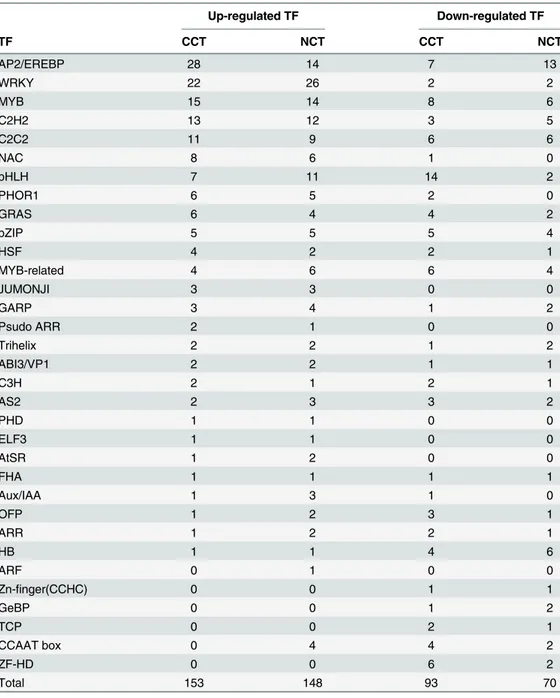
Transcriptional control of the expression of stress-responsive genes is a crucial part of the plant response to various abiotic and biotic stresses [45]. In CCT and NCT, RNA was the big-gest group in Mercator classification, in which“regulation of transcription”was the highest proportion. A total of 33 TF families were identified in DEGs of both libraries (Table 3). The majority of TFs belonged to AP2/EREBP, WRKY, MYB, zinc finger family (including C2C2, C2H2, and C3H), bHLH and NAC families. In most TF families, the number of up-regulated DEGs exceeded down-regulated DEGs. However, in a few TF families like HB (Homobox), there were more down-regulated DEGs. TFs in JUMONJI, Psudo ARR, PHD, ELF3, AtSR and ARF families were all up-regulated. c37420.graph_c0 encodes ARF (Auxin responsive factor)
Table 3. Differential expressed transcription factors in CCT and NCT.
Up-regulated TF Down-regulated TF
TF CCT NCT CCT NCT
AP2/EREBP 28 14 7 13
WRKY 22 26 2 2
MYB 15 14 8 6
C2H2 13 12 3 5
C2C2 11 9 6 6
NAC 8 6 1 0
bHLH 7 11 14 2
PHOR1 6 5 2 0
GRAS 6 4 4 2
bZIP 5 5 5 4
HSF 4 2 2 1
MYB-related 4 6 6 4
JUMONJI 3 3 0 0
GARP 3 4 1 2
Psudo ARR 2 1 0 0
Trihelix 2 2 1 2
ABI3/VP1 2 2 1 1
C3H 2 1 2 1
AS2 2 3 3 2
PHD 1 1 0 0
ELF3 1 1 0 0
AtSR 1 2 0 0
FHA 1 1 1 1
Aux/IAA 1 3 1 0
OFP 1 2 3 1
ARR 1 2 2 1
HB 1 1 4 6
ARF 0 1 0 0
Zn-finger(CCHC) 0 0 1 1
GeBP 0 0 1 2
TCP 0 0 2 1
CCAAT box 0 4 4 2
ZF-HD 0 0 6 2
Total 153 148 93 70
family TF and was up-regulated by 4.1 fold in NCT, but it was not differentially expressed (not a DEG) in CCT. On the other hand, TFs in Zn-finger (CCHC), GeBP, TCP, zf-HD families were all down-regulated. So many TFs were regulated by low temperature, implying the com-plexity of cold regulation network in asparagus bean.
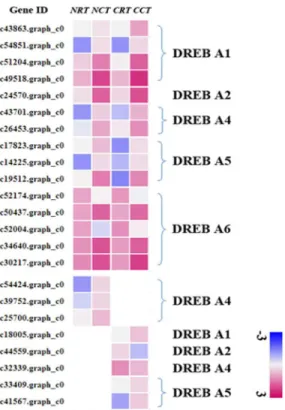
Among all the TF families that have been identified, AP2/ERF (also called AP2/EREBP) family is the largest. AP2/ERF transcription factors have been implicated in hormone, sugar and redox signaling in context of abiotic stresses such as cold and drought [46]. DREB (dehy-dration responsive element binding protein) is a subfamily belonged to AP2/ERF. This group of subfamily was further divided into six subgroups (A-1 to A-6) [1]. DREB1/CBF genes belong to the A1 group and are quickly and transiently induced by low temperature, and their prod-ucts activate the expression of multiple stress-inducible target genes. While the DREB2 genes, which belong to the A2 group, are induced by dehydration, leading to the expression of drought-responsive genes [47]. In CCT and NCT, there were 15 common TFs belonged to DREB (Fig 2), including A1, A2, A4, A5 and A6 subgroup. They exhibited the same expression pattern and similar expression level. Most of these TFs were up-regulated, whereas two TFs, c52174.graph_c0 and c52004.graph_c0, were down-regulated, which belonged to A6. The expression level of TFs in A1, A2 and A4 group were higher in CCT than NCT. On the con-trary, TFs in A5 group expressed more in NCT.
Additionally, there were three unique DREB TFs in NCT, which were all up-regulated and belonged to A4 group. Also, five DREB TFs were CCT-specific. Of these, c18005.graph_c0 belonged to A1 and its expression increased up to 33-fold under cold stress. c44559.graph_c0 and c32339.graph_c0 belonged to A2 and A4, respectively, which were both down-regulated. The other two genes belonged to A5 and were both up-regulated.
Fig 2. Expression level of TFs belonged to DREB family in four libraries.Color bins represent Log10FPKM of a gene.
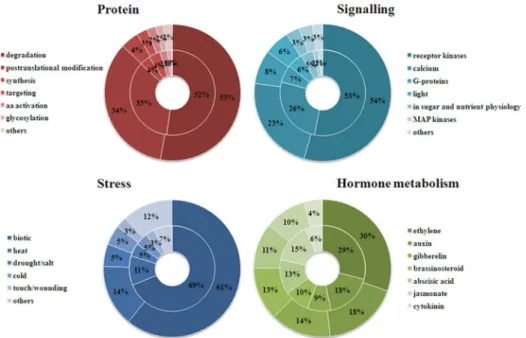
Protein, signaling, stress and hormone metabolism
Aside from RNA, DEGs in each of the other four major groups were further clustered in smaller subgroups (Fig 3). In protein group,“protein degradation”was the biggest subgroup. There were146 and 130 DEGs related to protein degradation in CCT and NCT, respectively, 87 and 89 of which involved in ubiquitin pathway. The second largest subgroup was“ posttransla-tional modification”. There were 94 and 86 DEGs involved in this subgroup in CCT and NCT, respectively, which mainly encode protein kinases and protein phosphatase. Protein phosphor-ylation/dephosphorylation is now well demonstrated to play a part in signal transduction dur-ing cold acclimation.
In signaling group,“receptor kinases”was the largest subgroup, which accounted for 54% and 53% in CCT and NCT, respectively. The next biggest subgroup was“calcium”, which accounted for 23% and 26% in CCT and NCT, respectively. There is mounting evidence that calcium is an important second messenger in a low temperature signal transduction pathway involved in regulating the cold-acclimation response [2]. DEGs in this group primarily encode Calcium-binding EF-hand family protein and Calmodulin-binding protein.
In stress group,“biotic”stress was the largest subgroup, which accounted for 61% and 64% in CCT and NCT, respectively. And in this subgroup, many DEGs were related to PR (patho-gen-related) protein, suggesting that some disease resistant genes were also induced by low temperature. The other subgroups belonged to abiotic stresses including“heat”,“drought/salt”,
“cold”, and“touch/wounding”. Some genes related to a range of stress conditions were also induced by low temperature, indicating a cross-talk between biotic and abiotic stress and between different abiotic stresses. DEGs related to“heat”mainly encode chaperone dnaJ-domain superfamily protein, heat shock protein and heat shock factor.
Plant hormones play critical roles in plants’adaption to changing environments, by mediat-ing growth, development, nutrient allocation, and source/sink transitions [48]. During cold stress, the expression of genes related to biosynthesis and metabolism of phytohormones like
Fig 3. Four major groups of DEG classification in CCT and NCT.The outer circle represents CCT, while the inner circle symbolizes NCT. Each group is further divided into several subgroups, the percentage of which is shown.
IAA, GA, ABA, CK, ETH and BR have also been influenced. In hormone metabolism group,
“ethylene”was the biggest subgroup. DEGs in this subgroup mainly encode ACC synthase and ethylene response factor. The second largest subgroup was“auxin”. DEGs in this subgroup principally encode SAUR-like auxin-responsive protein family and auxin-responsive family protein. Since cold-regulated gene expression itself involves multiple mechanisms including both“ABA-dependent”and“ABA-independent”pathways [2], ABA plays a crucial role in cold tolerance. DEGs in subgroup“ABA”primarily encode nine-cis-epoxycarotenoid dioxy-genase (NCED), ABA 8'-hydroxylase, highly ABA-induced PP2C gene 3 (HAI3), GRAM domain-containing protein. Noteworthy, two genes, c42395.graph_c0 and c52708.graph_c0, encoding ABRE binding factor 4 (ABF4) were down-regulated by 3.5 and 5.6 fold in NCT, respectively. Another two genes, c53208.graph_c0 and c53371.graph_c0, encoding ABRE bind-ing protein 3 (AREB3) were down-regulated by 4.9 and 7.8 fold in NCT, respectively. ABA-responsive element (ABRE) is the major cis-element for ABA-ABA-responsive gene expression under osmotic stress conditions, and ABRE binding protein and ABRE-binding factor TFs control these genes’expression in an ABA-dependent manner [49]. However, these four genes were not differentially expressed in CCT.
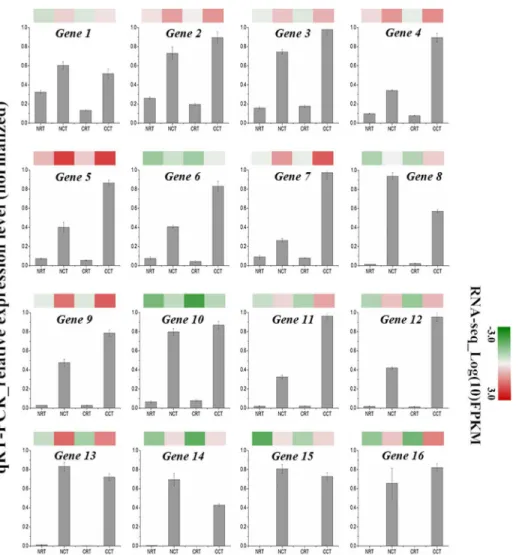
qRT-PCR validation
To verify the reliability and accuracy of our transcriptome data, we randomly selected 16 up-regulated unigenes from common DEGs in CCT and NCT libraries and evaluated their expres-sion profiles using quantitative real-time PCR. Two most widely used reference genes,actin
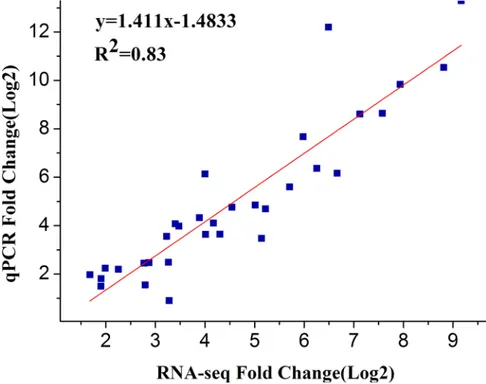
andGAPDH, were selected for internal controls. The expression patterns of selected genes were determined and further compared with those of in RNA-seq assay. Nearly all of these genes displayed similar expression trend in both techniques (Fig 4). Moreover, the correlation between qRT-PCR and RNA-seq was measured by scatter plotting log2-fold changes (Fig 5), which showed a positive correlation coefficient (Pearson coefficient R2= 0.83).
Discussion
Up-regulated genes and down-regulated genes
After 24h incubation at 4°C, the number of up-regulated genes clearly exceeded that of down-regulated genes in both CCT and NCT libraries. There is a notion that cold-stress-induced genes are necessary for cold tolerance whereas cold-repressed genes are important for active growth [50]. Some reported researches ofArabidopsiscold-responsive transcriptome showed that the number of up-regulated genes was more than that of down-regulated genes [51–54].
Arabidopsisis capable of cold acclimation, whereas asparagus bean is not able to cold acclimate. When exposed to low temperature, they both possess more up-regulated genes. On that account, it appears that the ability of cold acclimation is not the key point to determine whether up-regulated genes are more or less. Besides, similar results have been described in transcip-tome research of barley [55], cassava [56],Camellia sinensis[57] andVitis amurensis[23,58]. However, inAnthurium[59],Ammopiptanthus mongolicus[60] andPopulus simonii[61], more down-regulated genes were found. Taken together, the relative ratio between up-regu-lated genes and down-reguup-regu-lated genes in response to cold stress may vary with different plant species.
Expression profile of DREB1/CBF
transcriptional activators [5]. The transcriptional factor DREB1/CBF specifically interacts with the dehydration-responsive element (DRE)/C-repeat (CRT)cis-acting element (A/GCCGAC) and controls the expression of many stress-inducible genes inArabidopsis[62]. There are 6 members in this subfamily including CBF1, CBF2, CBF3, CBF4, DDF1 and DDF2 [63]. As shown inFig 2, four TFs belonged to DREB1 are shared by CCT and NCT. Of these, c43863. graph_c0 encodes DDF2 (DWARF AND DELAYED FLOWERING 2). DDF2 is the closest homolog of DDF1, and both are induced by high-salinity stress [64]. Overexpression of DDF1 or DDF2 reduces bioactive GAs inArabidopsis[65]. The reduction of bio-active GAs leads to accumulation of the nuclear-localized growth-repressing DELLA proteins [66]. It has been pro-posed that DELLAs permit flexible and appropriate modulation of plant growth in response to environmental changes [67]. This gene was inductive, i.e. it was not expressed under normal conditions but was induced by exposure to low temperature. In CCT and NCT, it was up-regu-lated by 74 fold and 13 fold, respectively. Another two genes (c54851.graph_c0 and c51204. graph_c0) encode CBF4. In CCT they were up-regulated by 12 fold and 51 fold, respectively, while in NCT they were up-regulated by 11 fold and 10 fold, separately. Transcription factor
CBF4 is a regulator of drought adaptation inArabidopsis[68]. Unlike CBF1, CBF2 and CBF3, which are known to be induced in cold stress, CBF4 gene expression is up-regulated by drought stress, but not by low temperature. Overexpression of CBF4 in transgenicArabidopsisplants can activate CRT/DRE containing downstream genes, thus making the transgenic plants more tolerant to freezing and drought stress. Another gene, c49518.graph_c0 encodes CBF3/ DREB1A, which was up-regulated by 47 fold and 25 fold in CCT and NCT, respectively. This gene is involved in response to low temperature and abscisic acid. Liu et al. [69] have shown that overexpression of CBF3/DREB1A in transgenicArabidopsisplants causes constitutive expression ofRD29Aand enhances both the freezing and drought tolerance of the transgenic plants. A major positive regulator of CBF3 is ICE1 (inducer of CBF expression1), a basic helix-loop-helix transcription factor that binds to multiple Myc DNA regulatory elements present in the CBF3 promoter and stimulates CBF3 transcription [70]. In our RNA-seq results, we also found a gene, c25032.graph_c0, which encodes ICE1. It was expressed in both cold treated and control samples, but it was not a differentially expressed gene. This is consistent with its consti-tutively expressed property [71]. Therefore, the ICE1-CBF3-COR transcription cascade may also exist in asparagus bean.
Noticeably, there was a unique gene in CCT, c18005.graph_c0, which encodes CBF1. In control samples, its expression level was zero. But in low temperature, it was up-regulated by 33 fold. Increased expression ofArabidopsisCBF1 inducedCORgene expression and increased the freezing tolerance of non-acclimatedArabidopsisplants [72]. Moreover, Achard et al. [66] found that transgenic plants that constitutively expressCBF1accumulate less bioactive GA, leading to the accumulation of DELLA protein, and as a consequence exhibit dwarfism, late flowering and enhanced freezing tolerance.
Fig 5. Scatter plot of 16 selected genes based on fold change measured by RNA-seq and by qRT-PCR analysis.A linear trend line is shown.
Possible mechanism underlying cold tolerance of Dubai bean
Based on our transcriptome data, we speculate that there may exist three reasons that contrib-uted to the higher cold tolerance of Dubai bean. Firstly, during cold stress, some previously reported genes responsible for cold tolerance were differentially expressed in Dubai bean, but not in Ningjiang-3. An example is c41219.graph_c0. It encodes ESK1, which functions as a negative regulator of cold acclimation [73]. Mutation in theESK1gene provides strong freezing tolerance. Unlike CBF pathway, theESK1gene may participate in the control of another set of freezing tolerance responses that includes synthesis of proline and sugars and expression of RAB18 [2]. This gene was down-regulated by 5.4 fold only in CCT, which agrees with its nega-tive regulator role.
In the second place, Dubai bean featured higher expression level of some commonly changed genes. For instance, in“heat”of stress group, three genes (c24017.graph_c0, c50903. graph_c0 and c51953.graph_c0) encode heat shock factor (HSF). They were all up-regulated in both libraries, but in CCT its expression level was higher than NCT. InArabidopsis, four HSF were also found to be cold responsive and up-regulated [52]. HSF regulate the expression of heat shock protein (HSP), which is also induced by low temperature in plants. These HSPs function in membrane protection, in the refolding of denatured proteins and in preventing protein aggregation [74].
Thirdly, the results of Mercator classification showed that in most functional groups, the number of DEGs was larger in CCT compared to NCT (Fig 1), implying that Dubai bean has more complex regulatory networks to deal with cold stress. For example, Mitogen activated protein kinase (MAPKs) are mediators of several signal transduction pathways in eukaryotic cells, including responses to a variety of environmental stresses [7]. Transcripts for a MAPK kinase kinase, ATMEKK1, and a MAPK, ATMPK3 have been shown to accumulate rapidly in
Arabidopsisin response to low temperature [75]. In“MAP kinases”of signaling group, there were eight genes in CCT, while the number was four in NCT.
Conclusion
In this experiment, we analyzed the global transcriptome modification of two asparagus bean cultivars, Dubai bean and Ningjiang-3, that are differing in cold tolerance under low tempera-ture. 3510 and 2868 DEGs were identified from two cultivars, respectively, and functional anal-ysis with these DEGs was performed. The results showed that the most prevalent functional groups in both genotypes were RNA, protein, signaling, stress and hormone metabolism. We further analyzed these groups separately. TFs were the largest subgroup in RNA group. We focused on the expression pattern of TFs that belonged to DREB family, especially DREB A1 in both cultivars, which were found to be expressed with higher level in CCT library. Moreover, there was a unique gene encoding CBF1 existed in CCT. We also discussed the possible reasons why Dubai bean is more tolerant to cold stress than Ningjiang-3, including higher expression level of cold responsive genes and more abundant DEGs in most of common functional groups, highlighting the multiple gene control and complexity of cold stress response mechanism in Dubai bean. In summary, as a non-cold acclimated crop, asparagus bean also has CBF pathway, which may play an important role in cold tolerance of Dubai bean.
Supporting Information
S1 Fig. Dubai bean (left) and Ningjiang-3 (right).This picture is taken in mid-October at Mianyang Institute of Agricultural Sciences, Sichuan, China.
S2 Fig. The length distribution of unigenes.
(TIF)
S3 Fig. Overall distribution of unigenes in four libraries measured by FPKM.
(TIF)
S4 Fig. Hierarchical cluster analysis of DEGs in four libraries.
(TIF)
S1 Table. Details of selected genes and the sequence of primers.Functional annotation of these genes was performed by Mercator pipeline.
(XLSX)
S2 Table. Statistics of de novo assembly results.
(DOCX)
S3 Table. Statistics of unigene annotation.All unigene sequences were subjected to a BLAST comparison against NR, Swiss-Prot, GO, COG, KOG, KEGG and Pfam databases.
(DOCX)
S4 Table. Functional annotation of the unigenes.
(XLS)
S5 Table. The DEGs of Dubai bean during cold stress.Unigenes that expressed differentially during chilling tolerance were list in this file.
(XLS)
S6 Table. The DEGs of Ningjiang-3 under 4°C treatment.
(XLS)
S7 Table. Functional annotation of DEGs of Dubai bean by Mercator pipeline.
(XLSX)
S8 Table. Functional annotation of DEGs of Ningjiang-3 by Mercator pipeline.
(XLSX)
Author Contributions
Conceived and designed the experiments: HT HL. Performed the experiments: HT YT. Ana-lyzed the data: HT MT. Contributed reagents/materials/analysis tools: HH. Wrote the paper: HT YL.
References
1. Heidarvand L, Amiri RM. What happens in plant molecular responses to cold stress? Acta Physiologiae Plantarum. 2010; 32(3):419–431.
2. Thomashow MF. PLANT COLD ACCLIMATION: Freezing Tolerance Genes and Regulatory Mecha-nisms. Annual review of plant physiology and plant molecular biology. 1999; 50:571–599. doi:10.1146/ annurev.arplant.50.1.571PMID:15012220.
3. Miura K, Furumoto T. Cold signaling and cold response in plants. International journal of molecular sci-ences. 2013; 14(3):5312–5337. doi:10.3390/ijms14035312PMID:23466881; PubMed Central PMCID: PMC3634503.
4. Knight MR, Knight H. Low-temperature perception leading to gene expression and cold tolerance in higher plants. The New phytologist. 2012; 195(4):737–751. doi:10.1111/j.1469-8137.2012.04239.x PMID:22816520.
6. Hannah MA, Heyer AG, Hincha DK. A global survey of gene regulation during cold acclimation in Arabi-dopsis thaliana. PLoS genetics. 2005; 1(2):e26. doi:10.1371/journal.pgen.0010026PMID:16121258; PubMed Central PMCID: PMC1189076.
7. Heino P, Palva ET. Signal transduction in plant cold acclimation. In: Hirt H, Shinozaki K, editors. Plant Responses to Abiotic Stress. Berlin: Springer-Verlag; 2003. p. 151–186.
8. Gillaspie A Jr, Hopkins M, Dean R. Determining genetic diversity between lines of Vigna unguiculata subspecies by AFLP and SSR markers. Genetic Resources and Crop Evolution. 2005; 52(3):245–247. 9. Fang J, Chao C- CT, Roberts PA, Ehlers JD. Genetic diversity of cowpea [Vigna unguiculata (L.) Walp.] in four West African and USA breeding programs as determined by AFLP analysis. Genetic Resources and Crop Evolution. 2007; 54(6):1197–1209.
10. Xu P, Wu X, Wang B, Liu Y, Ehlers JD, Close TJ, et al. A SNP and SSR based genetic map of aspara-gus bean (Vigna. unguiculata ssp. sesquipedialis) and comparison with the broader species. PloS one. 2011; 6(1):e15952. doi:10.1371/journal.pone.0015952PMID:21253606; PubMed Central PMCID: PMC3017092.
11. Ehlers J, Hall A. Cowpea (Vigna unguiculata L. Walp.). Field Crops Research. 1997; 53(1):187–204. 12. Hall AE. Breeding for adaptation to drought and heat in cowpea. European Journal of Agronomy. 2004;
21(4):447–454.
13. Ismail A, Hall A, Close T. Chilling tolerance during emergence of cowpea associated with a dehydrin and slow electrolyte leakage. Crop Science. 1997; 37(4):1270–1277.
14. Ismail AM, Hall AE. Variation in traits associated with chilling tolerance during emergence in cowpea germplasm. Field crops research. 2002; 77(2):99–113.
15. Ismail AM, Hall AE, Close TJ. Allelic variation of a dehydrin gene cosegregates with chilling tolerance during seedling emergence. Proceedings of the National Academy of Sciences of the United States of America. 1999; 96(23):13566–13570. PMID:10557361; PubMed Central PMCID: PMC23988. 16. Asiwe JAN. Insect mediated outcrossing and geneflow in cowpea. African Journal of Biotechnology.
2009; 8(2):226–230.
17. Peters JL, Cnudde F, Gerats T. Forward genetics and map-based cloning approaches. Trends in plant science. 2003; 8(10):484–491. doi:10.1016/j.tplants.2003.09.002PMID:14557045.
18. Wang Z, Gerstein M, Snyder M. RNA-Seq: a revolutionary tool for transcriptomics. Nature reviews Genetics. 2009; 10(1):57–63. doi:10.1038/nrg2484PMID:19015660; PubMed Central PMCID: PMC2949280.
19. Carvallo MA, Pino MT, Jeknic Z, Zou C, Doherty CJ, Shiu SH, et al. A comparison of the low tempera-ture transcriptomes and CBF regulons of three plant species that differ in freezing tolerance: Solanum commersonii, Solanum tuberosum, and Arabidopsis thaliana. Journal of experimental botany. 2011; 62 (11):3807–3819. doi:10.1093/jxb/err066PMID:21511909; PubMed Central PMCID: PMC3134341. 20. Lei X, Xiao Y, Xia W, Mason AS, Yang Y, Ma Z, et al. RNA-seq analysis of oil palm under cold stress reveals a different C-repeat binding factor (CBF) mediated gene expression pattern in Elaeis guineen-sis compared to other species. PloS one. 2014; 9(12):e114482. doi:10.1371/journal.pone.0114482 PMID:25479236; PubMed Central PMCID: PMC4257668.
21. Zhang X, Fowler SG, Cheng H, Lou Y, Rhee SY, Stockinger EJ, et al. Freezing‐sensitive tomato has a functional CBF cold response pathway, but a CBF regulon that differs from that of freezing‐tolerant Ara-bidopsis. The Plant Journal. 2004; 39(6):905–919. PMID:15341633
22. Liu H, Ouyang B, Zhang J, Wang T, Li H, Zhang Y, et al. Differential modulation of photosynthesis, sig-naling, and transcriptional regulation between tolerant and sensitive tomato genotypes under cold stress. PloS one. 2012; 7(11):e50785. doi:10.1371/journal.pone.0050785PMID:23226384; PubMed Central PMCID: PMC3511270.
23. Xin H, Zhu W, Wang L, Xiang Y, Fang L, Li J, et al. Genome wide transcriptional profile analysis of Vitis amurensis and Vitis vinifera in response to cold stress. PloS one. 2013; 8(3):e58740. doi:10.1371/ journal.pone.0058740PMID:23516547; PubMed Central PMCID: PMC3596283.
24. Zhang T, Zhao X, Wang W, Pan Y, Huang L, Liu X, et al. Comparative transcriptome profiling of chilling stress responsiveness in two contrasting rice genotypes. PloS one. 2012; 7(8):e43274. doi:10.1371/ journal.pone.0043274PMID:22912843; PubMed Central PMCID: PMC3422246.
25. Grabherr MG, Haas BJ, Yassour M, Levin JZ, Thompson DA, Amit I, et al. Full-length transcriptome assembly from RNA-Seq data without a reference genome. Nature biotechnology. 2011; 29(7):644–
652. doi:10.1038/nbt.1883PMID:21572440
27. Apweiler R, Bairoch A, Wu CH, Barker WC, Boeckmann B, Ferro S, et al. UniProt: the Universal Protein knowledgebase. Nucleic acids research. 2004; 32:D115–119. doi:10.1093/nar/gkh131PMID: 14681372; PubMed Central PMCID: PMC308865.
28. Ashburner M, Ball CA, Blake JA, Botstein D, Butler H, Cherry JM, et al. Gene ontology: tool for the unifi-cation of biology. The Gene Ontology Consortium. Nature genetics. 2000; 25(1):25–29. doi:10.1038/ 75556PMID:10802651; PubMed Central PMCID: PMC3037419.
29. Tatusov RL, Galperin MY, Natale DA, Koonin EV. The COG database: a tool for genome-scale analysis of protein functions and evolution. Nucleic acids research. 2000; 28(1):33–36. PMID:10592175; PubMed Central PMCID: PMC102395.
30. Koonin EV, Fedorova ND, Jackson JD, Jacobs AR, Krylov DM, Makarova KS, et al. A comprehensive evolutionary classification of proteins encoded in complete eukaryotic genomes. Genome biology. 2004; 5(2):R7. doi:10.1186/gb-2004-5-2-r7PMID:14759257; PubMed Central PMCID: PMC395751. 31. Kanehisa M, Goto S, Kawashima S, Okuno Y, Hattori M. The KEGG resource for deciphering the
genome. Nucleic acids research. 2004; 32:D277–280. doi:10.1093/nar/gkh063PMID:14681412; PubMed Central PMCID: PMC308797.
32. Altschul SF, Madden TL, Schaffer AA, Zhang J, Zhang Z, Miller W, et al. Gapped BLAST and PSI-BLAST: a new generation of protein database search programs. Nucleic acids research. 1997; 25 (17):3389–3402. PMID:9254694; PubMed Central PMCID: PMC146917.
33. Eddy SR. Profile hidden Markov models. Bioinformatics. 1998; 14(9):755–763. PMID:9918945. 34. Finn RD, Bateman A, Clements J, Coggill P, Eberhardt RY, Eddy SR, et al. Pfam: the protein families
database. Nucleic acids research. 2014; 42:D222–230. doi:10.1093/nar/gkt1223PMID:24288371; PubMed Central PMCID: PMC3965110.
35. Langmead B, Trapnell C, Pop M, Salzberg SL. Ultrafast and memory-efficient alignment of short DNA sequences to the human genome. Genome biology. 2009; 10(3):R25. doi:10.1186/gb-2009-10-3-r25 PMID:19261174; PubMed Central PMCID: PMC2690996.
36. Li B, Dewey CN. RSEM: accurate transcript quantification from RNA-Seq data with or without a refer-ence genome. BMC Bioinformatics. 2011; 12:323. doi:10.1186/1471-2105-12-323PMID:21816040; PubMed Central PMCID: PMC3163565.
37. Trapnell C, Williams BA, Pertea G, Mortazavi A, Kwan G, van Baren MJ, et al. Transcript assembly and quantification by RNA-Seq reveals unannotated transcripts and isoform switching during cell differenti-ation. Nat Biotechnol. 2010; 28(5):511–515. doi:10.1038/nbt.1621PMID:20436464; PubMed Central PMCID: PMC3146043.
38. Mortazavi A, Williams BA, McCue K, Schaeffer L, Wold B. Mapping and quantifying mammalian tran-scriptomes by RNA-Seq. Nature methods. 2008; 5(7):621–628. doi:10.1038/nmeth.1226PMID: 18516045.
39. Guo Y, Sheng Q, Li J, Ye F, Samuels DC, Shyr Y. Large scale comparison of gene expression levels by microarrays and RNAseq using TCGA data. PloS one. 2013; 8(8):e71462. doi:10.1371/journal. pone.0071462PMID:23977046; PubMed Central PMCID: PMC3748065.
40. Leng N, Dawson JA, Thomson JA, Ruotti V, Rissman AI, Smits BM, et al. EBSeq: an empirical Bayes hierarchical model for inference in RNA-seq experiments. Bioinformatics. 2013; 29(8):1035–1043. doi: 10.1093/bioinformatics/btt087PMID:23428641; PubMed Central PMCID: PMC3624807.
41. Audic S, Claverie JM. The significance of digital gene expression profiles. Genome research. 1997; 7 (10):986–995. PMID:9331369.
42. Reiner A, Yekutieli D, Benjamini Y. Identifying differentially expressed genes using false discovery rate controlling procedures. Bioinformatics. 2003; 19(3):368–375. PMID:12584122
43. Lohse M, Nagel A, Herter T, May P, Schroda M, Zrenner R, et al. Mercator: a fast and simple web server for genome scale functional annotation of plant sequence data. Plant, cell & environment. 2014; 37 (5):1250–1258. doi:10.1111/pce.12231PMID:24237261.
44. Djebali S, Davis CA, Merkel A, Dobin A, Lassmann T, Mortazavi A, et al. Landscape of transcription in human cells. Nature. 2012; 489(7414):101–108. doi:10.1038/nature11233PMID:22955620; PubMed Central PMCID: PMC3684276.
45. Singh K, Foley RC, Onate-Sanchez L. Transcription factors in plant defense and stress responses. Cur-rent opinion in plant biology. 2002; 5(5):430–436. PMID:12183182.
46. Dietz KJ, Vogel MO, Viehhauser A. AP2/EREBP transcription factors are part of gene regulatory net-works and integrate metabolic, hormonal and environmental signals in stress acclimation and retro-grade signalling. Protoplasma. 2010; 245(1–4):3–14. doi:10.1007/s00709-010-0142-8PMID: 20411284.
48. Peleg Z, Blumwald E. Hormone balance and abiotic stress tolerance in crop plants. Current opinion in plant biology. 2011; 14(3):290–295. doi:10.1016/j.pbi.2011.02.001PMID:21377404.
49. Nakashima K, Yamaguchi-Shinozaki K, Shinozaki K. The transcriptional regulatory network in the drought response and its crosstalk in abiotic stress responses including drought, cold, and heat. Fron-tiers in plant science. 2014; 5:170. doi:10.3389/fpls.2014.00170PMID:24904597; PubMed Central PMCID: PMC4032904.
50. Zhu J, Dong CH, Zhu JK. Interplay between cold-responsive gene regulation, metabolism and RNA processing during plant cold acclimation. Current opinion in plant biology. 2007; 10(3):290–295. doi: 10.1016/j.pbi.2007.04.010PMID:17468037.
51. Fowler S, Thomashow MF. Arabidopsis transcriptome profiling indicates that multiple regulatory path-ways are activated during cold acclimation in addition to the CBF cold response pathway. The Plant cell. 2002; 14(8):1675–1690. PMID:12172015
52. Lee BH, Henderson DA, Zhu JK. The Arabidopsis cold-responsive transcriptome and its regulation by ICE1. The Plant cell. 2005; 17(11):3155–3175. doi:10.1105/tpc.105.035568PMID:16214899; PubMed Central PMCID: PMC1276035.
53. Matsui A, Ishida J, Morosawa T, Mochizuki Y, Kaminuma E, Endo TA, et al. Arabidopsis transcriptome analysis under drought, cold, high-salinity and ABA treatment conditions using a tiling array. Plant & cell physiology. 2008; 49(8):1135–1149. doi:10.1093/pcp/pcn101PMID:18625610.
54. Zeller G, Henz SR, Widmer CK, Sachsenberg T, Rätsch G, Weigel D, et al. Stress‐induced changes in the Arabidopsis thaliana transcriptome analyzed using whole‐genome tiling arrays. The Plant Journal. 2009; 58(6):1068–1082. doi:10.1111/j.1365-313X.2009.03835.xPMID:19222804
55. Svensson JT, Crosatti C, Campoli C, Bassi R, Stanca AM, Close TJ, et al. Transcriptome analysis of cold acclimation in barley albina and xantha mutants. Plant physiology. 2006; 141(1):257–270. doi:10. 1104/pp.105.072645PMID:16603669; PubMed Central PMCID: PMC1459312.
56. An D, Yang J, Zhang P. Transcriptome profiling of low temperature-treated cassava apical shoots showed dynamic responses of tropical plant to cold stress. BMC genomics. 2012; 13:64. doi:10.1186/ 1471-2164-13-64PMID:22321773; PubMed Central PMCID: PMC3339519.
57. Wang XC, Zhao QY, Ma CL, Zhang ZH, Cao HL, Kong YM, et al. Global transcriptome profiles of Camellia sinensis during cold acclimation. BMC genomics. 2013; 14:415. doi: 10.1186/1471-2164-14-415PMID:23799877; PubMed Central PMCID: PMC3701547.
58. Xu W, Li R, Zhang N, Ma F, Jiao Y, Wang Z. Transcriptome profiling of Vitis amurensis, an extremely cold-tolerant Chinese wild Vitis species, reveals candidate genes and events that potentially connected to cold stress. Plant molecular biology. 2014; 86(4–5):527–541. doi:10.1007/s11103-014-0245-2 PMID:25190283
59. Tian DQ, Pan XY, Yu YM, Wang WY, Zhang F, Ge YY, et al. De novo characterization of the Anthurium transcriptome and analysis of its digital gene expression under cold stress. BMC genomics. 2013; 14:827. doi:10.1186/1471-2164-14-827PMID:24267953; PubMed Central PMCID: PMC4046746. 60. Pang T, Ye CY, Xia X, Yin W. De novo sequencing and transcriptome analysis of the desert shrub,
Ammopiptanthus mongolicus, during cold acclimation using Illumina/Solexa. BMC genomics. 2013; 14:488. doi:10.1186/1471-2164-14-488PMID:23865740; PubMed Central PMCID: PMC3728141. 61. Song Y, Chen Q, Ci D, Zhang D. Transcriptome profiling reveals differential transcript abundance in
response to chilling stress in Populus simonii. Plant cell reports. 2013; 32(9):1407–1425. doi:10.1007/ s00299-013-1454-xPMID:23652820.
62. Maruyama K, Sakuma Y, Kasuga M, Ito Y, Seki M, Goda H, et al. Identification of cold‐inducible down-stream genes of the Arabidopsis DREB1A/CBF3 transcriptional factor using two microarray systems. The Plant Journal. 2004; 38(6):982–993. PMID:15165189
63. Yamaguchi-Shinozaki K, Shinozaki K. Transcriptional regulatory networks in cellular responses and tol-erance to dehydration and cold stresses. Annual review of plant biology. 2006; 57:781–803. doi:10. 1146/annurev.arplant.57.032905.105444PMID:16669782.
64. Magome H, Yamaguchi S, Hanada A, Kamiya Y, Oda K. dwarf and delayed‐flowering 1, a novel Arabi-dopsis mutant deficient in gibberellin biosynthesis because of overexpression of a putative AP2 tran-scription factor. The Plant Journal. 2004; 37(5):720–729. PMID:14871311
67. Achard P, Cheng H, De Grauwe L, Decat J, Schoutteten H, Moritz T, et al. Integration of plant responses to environmentally activated phytohormonal signals. Science. 2006; 311(5757):91–94. doi: 10.1126/science.1118642PMID:16400150.
68. Haake V, Cook D, Riechmann J, Pineda O, Thomashow MF, Zhang JZ. Transcription factor CBF4 is a regulator of drought adaptation in Arabidopsis. Plant physiology. 2002; 130(2):639–648. PMID: 12376631
69. Liu Q, Kasuga M, Sakuma Y, Abe H, Miura S, Yamaguchi-Shinozaki K, et al. Two transcription factors, DREB1 and DREB2, with an EREBP/AP2 DNA binding domain separate two cellular signal transduc-tion pathways in drought- and low-temperature-responsive gene expression, respectively, in Arabidop-sis. The Plant cell. 1998; 10(8):1391–1406. PMID:9707537; PubMed Central PMCID: PMC144379. 70. Chinnusamy V, Ohta M, Kanrar S, Lee BH, Hong X, Agarwal M, et al. ICE1: a regulator of cold-induced
transcriptome and freezing tolerance in Arabidopsis. Genes & development. 2003; 17(8):1043–1054. doi:10.1101/gad.1077503PMID:12672693; PubMed Central PMCID: PMC196034.
71. Thomashow MF. Molecular basis of plant cold acclimation: insights gained from studying the CBF cold response pathway. Plant physiology. 2010; 154(2):571–577. doi:10.1104/pp.110.161794PMID: 20921187; PubMed Central PMCID: PMC2948992.
72. Jaglo-Ottosen KR, Gilmour SJ, Zarka DG, Schabenberger O, Thomashow MF. Arabidopsis CBF1 over-expression induces COR genes and enhances freezing tolerance. Science. 1998; 280(5360):104–106. PMID:9525853.
73. Xin Z, Mandaokar A, Chen J, Last RL, Browse J. Arabidopsis ESK1 encodes a novel regulator of freez-ing tolerance. The Plant journal: for cell and molecular biology. 2007; 49(5):786–799. doi:10.1111/j. 1365-313X.2006.02994.xPMID:17316173.
74. Timperio AM, Egidi MG, Zolla L. Proteomics applied on plant abiotic stresses: role of heat shock pro-teins (HSP). Journal of proteomics. 2008; 71(4):391–411. doi:10.1016/j.jprot.2008.07.005PMID: 18718564.