ECONOMIC ANALYSIS OF COWPEA PRODUCTION IN NIGERIA
Abba M. Wakili, Researcher
Department of Agricultural Education, Federal College of Education, Nigeria E-mail: boyaabba@yahoo.com
ABSTRACT
This study employs a stochastic frontier production function analysis to examine the productivity and technical efficiency of cowpea production in Adamawa State, Nigeria and also to identify the factors affecting the technical inefficiency using farm level survey data collected from 150 cowpea farmers selected using multi stage sampling technique. Findings from the analysis show that cowpea farmers operated on a very small scale and are profitable. The productivity analysis shows that agro chemicals, fertilizer, farm size and labor were all positively and significantly related to the technical efficiency. The return to scale (RTS) of 0.9904 shows that cowpea production was in the rational stage of the production surface. The technical efficiency varies from 0.1094 to 0.9568 with a mean technical efficiency of 0.6649, indicating that farmers were operating below the efficiency frontier. Thus, in the short run, there is a scope to increase output by 34%. The inefficiency model revealed that education of the farmers; extension visits and access to credit are the main factors that affect technical efficiency of the farmers.
KEYWORDS
Cowpeas; Production functions; Family labour; Efficiency; Farm size; Nigeria.
Cowpea (Vigna Unguiculata Walp) is a very important crop which is grown in many parts of Nigeria. It provides protein to rural as well as the urban dwellers as a substitute for the animal protein. However, cowpea production is generally low as a result of some factor such as diseases and pest, drought, insect pest and weeds (Gungula and Garjila, 2005). Nigeria is the largest producer of cowpea in Africa; Agboola (1979) reported that an average yield of 271.5 kg/ha from the vast area of 3.8 million hectares cultivated to cowpea in Nigeria. In addition Singh and Jackai, (1985) further reported that with the use of improved technologies in cowpea production, yield of 1500-2000 kg/ha can be obtained on sole crops. According to gibbon and pain 1985), increase in demand for cowpea in the past few decades has led to the cultivation of cowpea as a sole crop in many parts of the country. Similarly in the northern part of Adamawa State, Cowpea which is used to be grown in mixture with cereals is now being produced as a sole crop (Sajo and Kadams, 1999). The role of agriculture is to provide adequate output to assure global food security and enhance economic development, nevertheless agricultural development in Nigeria has suffered a lot of setback due to the shift of emphasis and manpower to petroleum sector. Priority must be given to small holder farmers because they constitute about 95% of farming household in Nigeria and produce most of the food crops consumed in the country (Adesina, 1991). Cowpea is a major food crop and is widely grown in Adamawa state, however, with increasing population over the years, the demand for the crop had gone up but the production has not been increase significantly (Agwu, 2001). This study is therefore to evaluate the profitability and technical efficiency of production of the crop in Adamawa State Nigeria and also identifies the factors affecting the inefficiency in the production process.
where keeping of accurate records is not always a priority hence available data on production are subject to measurement errors. The application of the stochastic frontier model for efficiency analysis include: Aigner, et al. (1977) in which the model was applied to U.S. agricultural data. Battese and Corra (1977) applied the technique to the pastoral zone of eastern Australia. More recently, empirical analysis has been reported by Bravo Ureta and Pinheiro (1993).
The stochastic frontier production function model is specified as Y= f(Xi, )+e, where Y is output in a specified unit, X denotes the actual input vector, is the vector of production function parameters and e is the error term that is decomposed into two components, V and U. the V is a normal random variable that is independently and identically distributed (iid) with zero mean and constant variance .it is introduced to capture the white noise in the production, which are due to factors that are not within the influence of the producers. It is independent of U. the U is a non negative one sided truncation at zero with the normal distribution (Tadesse and Krishnamoorthy, 1977) it measures the technical inefficiency relative to the frontier production function, which is attributed to controllable factors (technical inefficiency). It is half normal, identically and independently distributed with zero mean and constant variance. The variance of the random errors ( ) and that of the technical inefficiency effects ( ) and overall model variance ( ) are related thus: = + , and the ratio = / is called Gama. Gama measures the total variation of output from the frontier, which can be attributed to technical inefficiency.
The technical efficiency of an individual firm is defined in terms of the observed output Yi to the corresponding frontier output . The is maximum output achievable given the existing technology and assuming 100% efficiency. It is denoted as: = f(Xij, ) +V, that is TE= Yi / .
Also the TE can be estimated by using the expectation of Ui conditioned on the random variable (V-U) as shown by Battese and Coelli 1988. That is TE = f(Xi, ) + V-U / f(Xi, ) +V and that 0 TE 1.
Gross Margin. It was used under the assumption that fixed cost component is negligible as in the case with subsistence farming and that the analysis is for short term. It is expressed as:
GM= - ….(1), where:
GM = gross margin (N/ha); = output of crop (kg);
= unit price of the output (100kg); = total revenue from the crop (N/kg);
= quantity of the ith input used in kg per hectare; = price per kg of the ith (N/kg);
= total cost associated with the ith input per hectare; = summation sign.
METHODOLOGY
Study area. The study was based on farm level data on cowpea farmers in Adamawa State, Nigeria. Adamawa state is made up of 21 local government areas divided into four zones by the Adamawa state Agricultural Development Programme. The state has a tropical climate marked by dry and rainy seasons. The major economic activity of the inhabitants is agriculture. The main food crops grown are maize, millet, rice, cowpea/beans, groundnut sweat potatoes and cassava. Farming practice in the study area involves the use of hand tools and other simple implements.
Madagali local government areas are purposively selected because of their prominence in cowpea production. Secondly 50 farmers were randomly selected from each of the three local government, making a total number of 150 respondents. Data were collected with the use of a structured questionnaire on inputs, output and income during the production season. Data were also collected on the socio-economic variables such as educational level of the farmers, farming experience, farm size and age of the farmers.
Data analysis. Descriptive statistics (means), gross margin and the stochastic frontier production function were used to analyze the socio economic characteristics of the cowpea farmers, profitability and technical efficiency of cowpea production in the study area respectively.
The production technology of the cowpea farmers was expressed following the adoption of Battese and Coelli, 1988 with the explicit Cob Douglass functional form specified as follows:
lnYi = o+ 1 lnX1i + 2 ln X2i + 3lnX3i + 4lnX4i + 5lnX5i +Vi - Ui….(2),
where:
Y = output of cowpea produced (kg); X1= Farm size (ha);
X2 = family labour (man-days); X3 = fertilizer (kg);
X4 = hercides (litres).
The inefficiency model Ui is defined by:
Ui = 0 + 1 Z1 + 2 Z2 + 3 Z3 + 4 Z4 + 5 Z5…(3),
where: Z1 Z2 Z3 Z4 Z5 represent years of formal education, farming experience, extension visits, age of the farmer respectively. The socio economic variables were included in the model to indicate their possible influence on the technical efficiencies of the farmers. The ’s ’s are scalar parameters to be estimated. The variances of the random errors and that of the technical inefficiency effects and overall variance of the model are related, thus, = + and the ratio = / , Gama measures the total variation of output from the frontier which can be attributed to technical inefficiency (Battese and Corra 1977).
RESULTS AND DISCUSSION
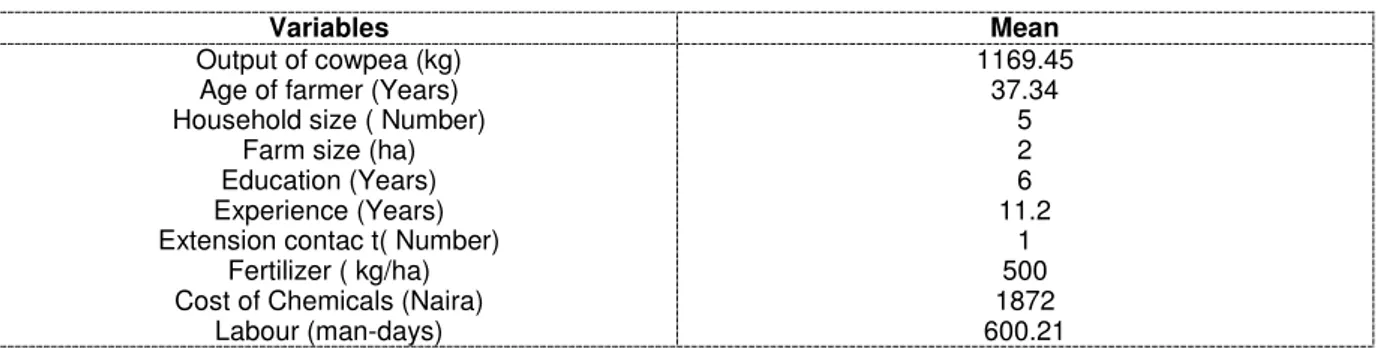
The mean output of the cowpea harvested by farmers was 1,169.45 kg, this indicates that the farmers operated at different levels of farm size. The mean age of the cowpea farmer is 37 years, this suggest that cowpea farming is dominated by the youth. The mean years of education shows that on average the highest level of education attained by a farmer is primary school. Average household size is 5 per household, large household size ensures adequate supply of family labour. Average farm size is 2 ha and they received only once visit by extension workers, this indicates that farmers operate on a smaller scale and received limited or no extension contact. The labour used in cowpea production had an average of 600.00 man-days, the findings indicated that production of cowpea require a lot of labour for efficient productivity. Labour was intensively used which required both the used of hired and family labour for more output to be achieved. The average cost of chemicals used in cowpea production was N 1,872, this shows that cowpea production requires a lot of chemical for viable output.
Table 1. Summary statistics of variables of the stochastic frontier production function for cowpea production
Variables Mean
Output of cowpea (kg) Age of farmer (Years) Household size ( Number)
Farm size (ha) Education (Years) Experience (Years) Extension contac t( Number)
Fertilizer ( kg/ha) Cost of Chemicals (Naira)
Labour (man-days) 1169.45 37.34 5 2 6 11.2 1 500 1872 600.21
Estimates of stochastic frontier production function: for estimating technical efficiency stochastic production function approach was used. The parameters of the frontier production function were estimated using the maximum likelihood estimation MLE and the results are presented in table 2.
Table 2. Estimates of stochastic frontier production function
Variables Coefficient t-ratio
Constant Farm size Family labour Chemicals Fertilizer Inefficiency model Constant Age of the farmer
Education Farming experience
Extension visits Access to credit
Gender Variance parameters
Sigma square Gama Log likelihood function
3.4626 0.6651 0.0302 0.0143 0.0725 -4.5448 -0.2878 -8.7457 -1.3427 -2.0216 -0.1454 -0.1231 6.9513 0.8756 -147.69 42.2219*** 4.8785*** 2.1881** 2.8941*** 2.5825** -3.2502*** -0.2983 -2.7405*** -2.6208*** -2.4120** -2.3652** -0.7454 6.8465*** 4.2312***
** Significance at 5 %, ***Significant at 1 %
The estimated stochastic frontier function shows that all the coefficients had the expected sign, indicating that an increase in these variables will lead to an increase of the output. It is also evident from the analysis that the estimate of gama (ϒ) is large and significantly different from zero, indicating that a good fit and the correctness of the specified distributional assumption. Moreover, the estimate of gama, which is the ratio of the variance output was 0.8756. This means that more than 87% of the variations in output among the cowpea farmers are due to differences in technical efficiency. The variable farm size had a coefficient of 0.6651 and is statistically significant at 1% level, meaning that a 1% increase in the use of land will increase output by about 6.6 %.similarly, the variable family labour, fertilizer and chemicals are statistically significant at 5% level. This observation is in line with a priori expectation and implies that the output of the farmers in the study area would be expected to increase with the increasing use of such production inputs. Amaza et al. (2005), and Ebong (2005) also reported a positive and significant relationship between these variables and technical efficiency. The return to scale (RTS) which is the summation of all the estimated elasticities of production was 0.9904 and showed decreasing return to scale.
Table 3. Elasticity of production and return to scale
Variable Elasticity of production
Farm size Family labour
Chemicals Fertilizer
RTS
0.6651 0.0302 0.0143 0.0725 0.9904
The inefficiency model also revealed that the variable education and farming experience are statistically significant at 1% level, meaning that education of farmers and their experience affect technical efficiency. The implication is that farmers that are experienced, with high level of education and have more extension contact tend to be more efficient in farming and hence increase in the output level which is consistence with the findings of Amaza and Olayemi, (2000), while extension visits and access to credit is significant at 5% level which is also in consistence with the findings of Onyenweaku, et al. (2005).
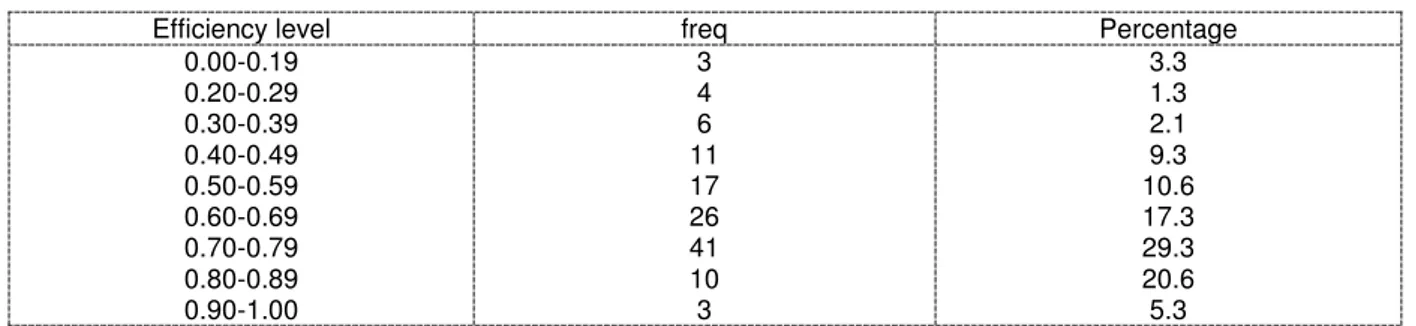
Technical Efficiency Analysis. The technical efficiency analysis is presented in table 4. The Technical efficiency of the sampled farmers is less than one (i.e. 100%) indicating that all the farmers are producing below the maximum efficiency frontier. The farmers technical efficiency ranged from 0.3318 to 0.9801 with a mean technical efficiency of 0.6649. The distribution of the technical efficiency shows that 54% of the farmer had technical efficiency of 70% above while about 46% of the farmers had technical efficiency of below 70%. The distributions of the technical efficiency suggest that in the short run, there is a scope of increasing cowpea production by about 40%.
Table 4. Frequency distribution of technical efficiency
Efficiency level freq Percentage
0.00-0.19 0.20-0.29 0.30-0.39 0.40-0.49 0.50-0.59 0.60-0.69 0.70-0.79 0.80-0.89 0.90-1.00
3 4 6 11 17 26 41 10 3
3.3 1.3 2.1 9.3 10.6 17.3 29.3 20.6 5.3
Mean 0.6649, Min 0.3318, Max 0.9801
CONCLUSION
Cowpea production is a profitable venture, the return to scale indicates decreasing return to scale, this also indicates that all inputs were used within the rational stage of production surface and therefore its production is inefficient in the study area. The technical inefficiency is also found in the production process. Farmers are also technically inefficient, in order to improve the technical efficiency of the farmers; the government should enhance its extension services and provision of credit facilities in order for the farmers boost cowpea production through financing its agricultural activities.
REFERENCES
[1] Agboola,S.A (1979). An Agricultural Atlas of Nigeria, Oxford University Press, London. pp 95-97.
[3] Aigner,D.J,Lovell, C.A.K and Schmidts, (1977). Formulation and estimation of stochastic frontier production model. J.Econometrics, 6: 21-37.
[4] Amaze, P.S, Kwaghe, P.V and Ojo, N. (2005). Determinants of wheat production and technical efficiency in the Chad Basin Development area Nigeria. Nigeria Journal of Agric. Food Environ 2:1-6.
[5] Amaze PS and Olayemi JK 2000. The influence of education and extension contact in food crop production in Gombe state, Nigeria. Nigeria Journal of Agricbus. Rural Develop. 1: 80-92.
[6] Battesse, G.E and Corra,G.S 1977. Estimation of production frontier model with application to the pastoral of eastern austrilia. Australian Journal of Agricultural Economics,2 :169-179.
[7] Bravo-Ureta,B.E and Pinheiro, A.E. (1993). Efficiency analysis of developing country agriculture. A Review of the frontier function literature. Agricultural and Resource Economics Review, 22 :88-101.
[8] Ekunme,PA and Emokaro, CO( 2009).Technical efficiency of catfish farmers in Kaduna, Nigeria. Journal of Applied Sciences Research 5(7):80-85.
[9] Ebong, V.O. 2005).Resource use efficiency in oil palm production in Akwa Ibom State, Nigeria. J. Cult. Develop. 7:23-38.
[10] Ebong VO, Okoro US and Effiong, EO 2009. Determinants of technical efficiency of urban farming in uyo metropolis of Akwa Ibom State. Nigeria Journal of Agric and Social Sciences.
[11] Gungula,D.T andGarjila, Y (2005). The effects of phosphorus application on growth and yield of cowpea in yola. Journal of Sustainable Development in Agriculture Environment 1(1).
[12] Gibbon, D and Pain, A (1985).crops of the drier regions of the tropics. Longman Group. Singapore pp. 111-112.
[13] Sajo,A.A and Kadams, A.M (1999). Food and cash crops in A.A. Adebayo and A.I .Tukur (eds). Adamawa State in Maps,Yola, Nigeria. Paraclete Publishers pp 37-40. [14] Singh, S.R and Jakai, E.N (1985). Insect pest and of cowpea in Africa: Their Life
Cycle, Economic Importance and Potential Control. In singh,R.S and Rachie,K.O (eds).Cowpea research production and utilization (CRPU) John Willey,S.R and Sons Ltd pp 217-231.
[15] Tadesse, B. and Krishnamoorthy, 1977. Technical efficiency in paddy farms of tamil nadu: An analysis based on farm size and ecology zone. Agric. Eco. 16: 185-192. [16] Omonona, B.T,Egbetokun, A.O and Akanbi, A.T (2010). Farmers resource-use and
technical efficiency in cowpea production in Nigeria. Economic Analysis and Policy Vol 40. No1.
[17] Ojo,SO and Ehinmowo, OO (2010). Economic analysis of Kolanut production in Nigeria. Journal of Social Science 22(1):1-5.