Abstract—With the advance of semiconductor technology,
microprocessors become highly integrated and therefore multi-processor servers are widely used. On the other hand, only limited application programs can use such multi-processors efficiently. In this paper, we show a method to improve utilization of multi-processor servers based on server virtualization technology, including the measured results of performance improvements in example systems. In some examples it was possible to multiply system performance of a physical server.
Index Terms— concurrency, multicore, multiprocessor, server virtualization, performance
I. INTRODUCTION
ervers based on the x86 architecture are now widely used , not only for simple servers but also for mission critical systems in enterprises or government, because microprocessor performance has increased significantly. They are called IA-server, Intel Architecture server, and often Microsoft Windows OS or open source Linux OS is used on them.
Every year, microprocessor chips become more integrated due to advances in semiconductor technology. This results not only in increased single processor performance but also in increased performance of shared memory type multiple processor systems, SMP: Symmetric Multiple Processor, where multiple CPU cores are integrated on a processor chip. One factor of the direction of technology is the heat problem, high frequency clocks cause increased heat on the microprocessor chip. For this reason chip vendors don't develop higher performance single processors, but multiply the CPU cores on a chip.
Meanwhile, not all application programs have efficient characteristics to utilize a single OS environment on multiple processors. There are many information systems which don’t benefit from multiple processor environments. Software resource contentions prevent concurrency of processes, if application programs create many processes or threads.
A virtualization feature may allow improved concurrency for applications with limited scalability by executing multiple OS environments on a multi-processor server. However, it is known that server virtualization features have some performance overhead. It is therefore recommended to
Manuscript received February 17, 2011; revised March 28, 2011. H. Ueno is with Enterprise Server Division, Hitachi, Ltd., Hadano, Kanagawa, Japan (e-mail: hitoshi.ueno.uv@hitachi.com).
T. Hasegawa is with Enterprise Server Division, Hitachi, Ltd., Hadano, Kanagawa, Japan (e-mail: tomohide.hasegawa.tv@hitachi.com).
K. Yoshihama is with Information Technology Division, Hitachi, Ltd., Tokyo, Japan (e-mail: yoshihama_k@itg.hitachi.co.jp).
evaluate the effect of concurrency with using virtualization by studying its advantages and disadvantages.
In this paper, we discuss about improvements of system performance by dividing physical servers which have a large number of physical CPU cores, into a number of LPARs which have a smaller number of logical CPU cores, in our example using the server virtualization feature "Virtage" implemented on Hitachi BladeSymphony servers. We show that it is possible to improve system performance by using virtualization even for tough application programs with limited concurrency in multi-processor environments.
II. EFFICIENT MULTI-PROCESSOR SERVER USE CASE USING
SERVER VIRTUALIZATION FEATURE
Traditional use of IA server systems in a business environment uses a simple design approach where one subsystem is built using one OS environment of one physical server. For example, if you want to build two subsystems, like a CRM subsystem and a Sales Management subsystem, you deploy two physical servers, one physical server with the CRM application and another server with the Sales Management application.
However there are many inefficient applications for multi-processor servers because not all CPU cores on the servers can be used. In that situation, a strange phenomenon can be observed, where most server resources such as CPU, storage, network, are idle, but system throughput can’t be increased.
In this paper, we call physical processor chip as "processor" and we call each instruction execution unit in the
System Performance Improvement
By Server Virtualization
Hitoshi Ueno, Tomohide Hasegawa, and Keiichi Yoshihama
S
Fig. 1. An example of multiprocessing behavior.
a b c d
data
four physical CPU cores
four processes
#0 #1 #2 #3
time
execution time idle time
t
t
t
t
data
Start of the transaction
End of the transaction t
data
data
data
waiting processes
[b][c][d]
CPU core usage count = 5t/4t = 1.25 CPU core busy ratio = 5t/(4t*4) = 0.31
physical server
processor as "core" or "CPU core." It means that there are multiple cores in one processor.
Here we think about characteristic application programs which have only a single process concurrency, even if the program runs on a four core multi-processor server. If no other resources except the processors are bottle neck for the performance, 100% busy of one core means reaching the upper limitation of performance. In this case, the processor usage ratio is,
1 (core)/ 4(core) = 0.25.
In general, we assume that N is number of cores and c(P) is the average number of cores which the application programs use, the processor usage ratio is c(P)/N. Values of c(P) are different and depend on characteristics of the OS and/or the application programs. The maximum value is N for high concurrency programs, and lowest value is 1 for low concurrency ones. It is not easy to develop application programs which can use multi-processor servers efficiently[1][2]. Most application programs use multi-processing or multi-threading for better efficiency, but it is rare for processes to be able to run completely independent each other. The reason of the phenomenon is exclusive control like lock mechanisms for common resources in the application program. Dependency between processes can also the reason of it, where a process has to wait to receive data from another processes for synchronization. Fig. 1. shows an example, a transaction processing system which has four processes. The process "a" receives transactions from other systems, it makes some computations and sends the processed data to two other processes, "b" and "c" for other data processing. After that the process "d" waits for receiving data from processes, "b" and "c". In such a situation, the system has physically four cores, but average processing ability is 1.25 cores, because each process consumes t seconds with using one core, and this transaction totally consumes 5t seconds but elapsed time is just 4t seconds. In this case, core use ratio in whole physical server is 0.31 that is 1.25/4.
In case of low concurrency application programs, in other words very small c(P)/N case, usually the systems manager wants to use high speed single processor server to keep good systems performance, he does not want to use relatively slow multi-processor servers. As we described before, the development of high performance single processor servers is difficult, and the availability ofsuch servers is limited. So as a matter of fact many users have to achieve the required performance using multi-processor servers.
You have to divide the target system as well as the data into multiple small system instances, and then run these systems in parallel, if you have to achieve the required performance using servers with a slower clock. Each divided system works independently, and it becomes a kind of load balancing system configuration. However it is difficult for some applications to run multiple instances on a single OS of the same server, because there are many programs which can’t run multiple instances on one OS, as they may collide to get the same resources from the OS. Generally it is better to use server virtualization technology for multiple OS environment on a physical server, because different physical servers for application programs increase low CPU core usage rate servers which is not efficient.
It is known that virtualization technology has some loss of processor performance by control overhead like emulations. Accordingly the total performance improvement ratio depends on the virtualization overhead and the efficiency of program concurrency, on whole physical server by dividing OS instances. In the following section, we describe an evaluation method for finding relations of one physical server system's performance and total performance of multiple logical servers.
III. EVALUATION OF MULTIPLE LOGICAL SERVER
The comparison is made by comparing the performance of one OS instance on a physical server and total performance of “n” OS instances on “n” logical servers. Here, we define physical server system performance as "Sph," and logical server performance as "Svt(1)…Svt(n)," and then we understand relations among physical server and logical server as follows, and assume that the number of logical cores assigned to logical servers are sufficient for the evaluation of target application concurrency. (Fig. 2.)
(a) The difference of performance on one server case,
Sph Svt is simply affected by the virtualization overhead.
(b) The difference between performance of i logical servers and ideal performance which is i times of the one logical server performance,
i Svt Svt i ,
is the overhead against logical server's scalability. (c) Define “iovc” as the number that satisfy the condition
of logical servers that total logical CPU core count exceeds physical core count, and that condition is called "CPU over commitment" condition. On this condition area, we can consider that the difference between the ideal scalability and the performance of iovc logical servers is from physical CPU core access overhead caused by sharing core for logical cores of LPARs.
We define performance improvement ratio as
max , .
If it is less than 1, it means no performance improvement. However, even in the best case, it never exceeds the number of physical cores N, this best case being an application that does not have idle time. When the application has no concurrency and can use one core only, we can divide the
Fig. 2. Model of performance characteristic. (a) virtualization overhead
(b) scalability overhead by hypervisor control (c) limitation by CPU over-commitment total
system performance
number of servers
1 2 3 4
physical server logical server
(a)
(b)
(b) (c)
ideal scalability
Sph Svt(1) Svt(2) Svt(3)
process of the application program into N processes, and the performance is N times that of a physical server with one core.
IV. EXAMPLES OF SYSTEMS EVALUATION
In this chapter we study three cases for performance improvement ratio evaluation.
A. Simple Load Case
At first we study simple application program behavior, in this case only CPUs are used by the program, I/Os are not, and CPUs execute only user mode instructions, but don't execute supervisor mode instructions, as these might generate virtualization overhead. If an application program uses only C cores on a physical server, the maximum performance ratio to M logical servers which has C logical cores is expected to be C: M C . In this section, we show the measurement result of a simple application program to verify above theory.
The simple application program runs two cores (C=2) with using two threads, and it uses user mode instructions only to exclude the effects of hypervisor intervention. From one to
40 logical servers M 4 are used for this experiment. (Fig. 3.)
Fig. 4. shows the result of the experiments. This program executes a certain instruction routine many times, and measures performance by counting number of loops per a second. Because not even an OS is not used for this program, little virtualization overhead is monitored therefore physical single server performance is about the same as single logical server performance. We clearly see the scalability of it, because the total performance of 32 logical servers is 31.7 times that of a physical server. The total logical server performance is in proportion to increases of the number of the logical servers M. The performance reaches a ceiling above M=33, because of the CPU over commitment condition. This physical server has 64 cores and in the M=32 case, all logical servers with two logical cores each use the total of 64 cores.
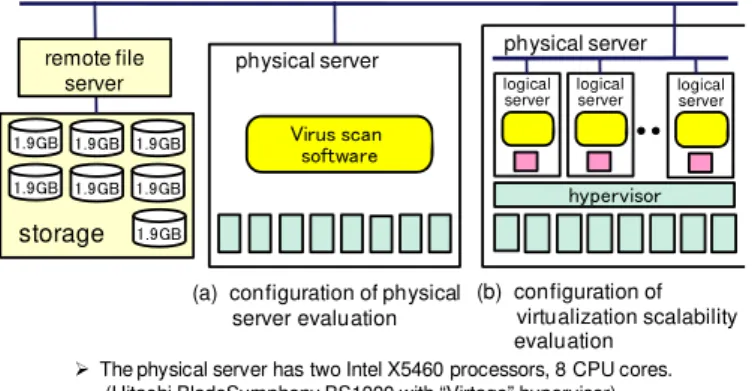
B. Virus Scan System Case
A practical example of systems performance improvement using server virtualization is a virus scan system. This is a network file system and virtualized virus protect servers
Fig. 3. Configurations of the simple workload case. physical server
load program with two threads
64 CPU cores
physical server
y
logical
server logicalserver logicalserver
(a) configuration of physical
server evaluation (b) configuration of virtualization scalability evaluation
¾The physical server has eight Intel X7560 processors and 64 CPU cores (The server is configured by four server blades integrated into one SMP. It is implemented in Hitachi BladeSymphony BS2000 and "Virtage“ logical partitioning hypervisor)
¾Each logical server is assigned two logical cores by the hypervisor.
Fig. 5. Configuration of virus scan system case.
physical server
y
logical
server logicalserver logicalserver
(a) configuration of physical server evaluation
(b) configuration of virtualization scalability evaluation
¾The physical server has two Intel X5460 processors, 8 CPU cores. (Hitachi BladeSymphony BS1000 with “Virtage” hypervisor)
¾Each logical server is assigned one or two logical cores by the hypervisor. ¾The hypervisor supports up to 16 logical servers on a physical server.
physical server
V ca
a
storage
remote file server
1.9GB 1.9GB 1.9GB 1.9GB 1.9GB 1.9GB 1.9GB
Fig. 4. Measured scalability for the simple workload case.
Physical server has 64 cores.
For up to 32 LPARs ideal scalability can be seen, because physical resources are sufficient. Over 32 LPARs the scalability is limited. total
system performance
number of servers
8 16 32 40 physical server
(only 2 cores used) logical server (2 logical cores for
each LPAR)
1 4
physical server performance
N of sv. (M)
N of CPU cores
(C) total perf .*1 physical server 1 2 3.58
logical server
1 2 3.58
2 2f or each 7.13 4 2f or each 14.3 8 2f or each 28.5 16 2f or each 57.0 32 2f or each 113.6 33 2f or each 113.5 34 2f or each 113.4 40 2f or each 112.7
*1 loop count (*104/sec)
Fig. 6. Measured scalability on the virus scan system case.
performance ratio
number of servers
2 4 6
physical server logical server
1 5.0
0.0 10.0
3 5
(a)
Virtualization overhead(a) exists for single server case, but total throughput is extremely high in case of 6 logical servers. Scalability overhead(b) is relatively small.
(b)
physical server performance
N of sv. N of CPU cores exec time f ile (GB) perf ratio phy. sv. 1 8 11’17” 1.9 2.8
log. sv.
1 1 16’40” 1.9 1.9
2 1 f or each 16’40” 3.8 3.8 3 1 f or each 16’40” 5.7 5.7 4 1 f or each 16’40” 7.6 7.6 5 1(4 sv), 2(1 sv) 17’10” 9.5 9.2 6 1(4 sv), 2(2 sv) 17’32” 11.4 10.8
scanning the whole storage. It is a kind of network file systems, and here we study the scanning throughput of whole storage by virtualized virus protection servers.
In a file sharing system of an enterprise, the system managers check all files once a week to maintain security , but this is not easy because the total file size is very large and it takes much time to complete scanning. Scanning time has to be as short as possible, because the check has to be completed in limited time during the weekend. When performing a virus scan with a physical server, its processors are not so busy because they wait for storage access time or resources exclusive control by the application program. Multiple virus protection programs can't be active on a server, so we can't increase the processor usage rate.
For this system, we can shorten scan execution time by using concurrent virus protection program on a server divided into multiple logical servers and OSs by server virtualization.
In this evaluation case, we made a configuration which has a physical server, 1.9GB shared disk (Fig. 5.(a)), and we made another configuration which has maximum six logical servers on a physical server, six 1.9GB shared disks for each logical server for scan target (Fig. 5.(b)), and we measured their time to scan.
Fig. 6. shows results of the measurements. In one server case, scan performance by a physical server is 47% better than it by a logical server. However once two logical servers are used the performance is 36% more than for the physical server, for six logical servers, the performance is 3.9 times higher. From a view point of the scalability, it is good performance for six logical servers to have 5.7 times the performance of a single logical server.
In this case, number of logical servers is six, total logical CPU cores are eight, therefore we see it does not reach to the performance upper limit of CPU over commitment condition.
C. Mixed Application Program Case
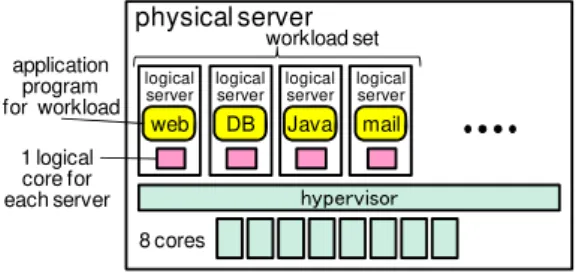
In this section, we show results of measurements when four kinds of applications are run on a physical server virtualized into four logical servers.
We chose web, DB, Java applications and mail server systems as four kinds of application programs because these are the applications used widely around enterprises. These systems are implemented each on a separate logical servers. Obviously, we can’t compare the performance of different applications with each other, but we have to evaluate total performance scalability when we increase the number of
logical servers. Therefore, four logical servers corresponding four systems are defined as a workload set, and four, eight and twelve logical servers cases are being evaluated (Fig. 7.). Fig. 8. shows the results. Those performance values are normalized by physical server performance for each application. In case of four logical servers, the total performance is 15% lower than for physical servers, but it is 60% higher for eight logical servers and 84% higher for twelve logical servers. In the case of twelve logical servers there is CPU over commitment condition which uses total 12 logical cores on 8 physical cores. Physical resources are not sufficient, but the performance is still increasing because each system does not consume cores at 100%, due to idle time.
V. ANALYSIS OF PERFORMANCE IMPROVEMENT
A. Performance Scalability of Virtualization
Here we analyze the performance improvement ratio of the three systems described in the previous chapter. Table I shows performance data and the conditions under which those systems are not in a CPU over commitment state.
Column (a) shows the ratio of physical and logical servers for a single server or single workload set environment. Although it depends on kinds of application or processor types used in the server, we see virtualization overheads between 0% and a maximum of around 30%.
The value in column (c) shows the performance increase for multiple logical servers or workload sets against a physical server. In all cases, the performance achieved by a
Fig. 8. Measured scalability on the mixed server systems case. performance
ratio
number of servers4 8 12 physical server logical server
1.0
0.0 2.0
1
physical server performance (a)
(b)
• Virtualization overhead(a) exists in 4 servers case. • Scalability overhead(b) is small on 8 servers case. • Limitation by CPU over commitment (c)
(Sum of logical CPU cores exceeds physical cores.) (c)
N of sv.
core *1
f our servers workload set Geo. mean web
server Java server
DB server
mail server
phy. sv. 4 8 1 1 1 1 1
log. sv.
4 1 1.094 0.938 0.675 0.757 0.851
8
1 0.973 0.802 0.712 0.751 -1 0.978 0.811 0.727 0.750 - 1.951 1.613 1.439 1.501 1.615
12
1 0.823 0.664 0.382 0.830 -1 0.816 0.672 0.398 0.661 1 0.789 0.665 0.355 0.629 - 2.428 2.001 1.135 2.120 1.849
¾Values are normalized by physical server performance.
¾One workload set is configured by four servers.
¾Total performance is calculated by geometrical mean. *1 N of cores for each physical/logical server
Fig. 7. Configuration of the mixed server systems case. physical server
y
web
logical server
configuration of virtualization scalability evaluation ¾The physical server has two Intel X5570 processors and 8 CPU cores.
(Hitachi BladeSymphony BS2000 and "Virtage“ hypervisor)
¾Each logical server is assigned one logical core in shared mode.
DB
logical server
Java
logical server
logical server
8 cores
workload set
1 logical core for each server
number of logical servers is better than a single physical server which indicates a performance improvement by virtualization.
Column (g) indicates the scalability, how systems performance increases in proportion to the number of logical servers or workload sets (f) when some logical servers are added. It is calculated by
column(d) / column(f).
Under optimal circumstances, the value is 1. Intuitively it means "the performance is close to n when we prepare n units of logical servers" and we define it as the scalability indicator in a virtualization environment. In all cases, it is over 0.95, therefore we understand the scalability is almost optimal.
With the above study, we verified that, in an environment with sufficient physical resources, multiple logical servers can achieve increased system performance compared with a physical server running a single OS. We understand also we are able to satisfy required performance by preparing enough number of logical servers for our systems.
B. Evaluation Method for General Use Case
Generally, we can estimate the performance improvement ratio by following calculation steps that are based on characteristics of the performance as described before.
step 1. Run the target systems and measure Sph as the performance of application programs on a physical server. Measure processor usage ratio "P" on the physical server also with performance monitor functions of the OS. Here we calculate the substantial number "C" of cores. We assume "N" as the number of physical cores.
C N P
step 2. Run the target systems on a logical server by using the same OS and software, and measure the performance of application programs as Svt(1). Here the logical server must be assigned more than C logical cores calculated above. The number of logical cores assigned here, we assume "Cvt".
step 3. Calculate the maximum system performance at CPU non over commitment condition area, because in the area virtualization scalability is good as we discussed before. The maximum number of logical servers under this condition is calculated as
Lvt N/Cvt
and that the maximum performance can be estimated as Estimation of Svt Lvt Svt Lvt R. Here "R" is the coefficient determined by kinds of application programs and it indicates the characteristics of
scalability, as in column (g) of TABLE I.
After the calculations as above steps, if the number of logical server Lvt is larger than 1, and estimated system performance Svt(Lvt) is large enough compare with Sph, we can assume that the virtualized system will show improvement from the physical server.
In practical business systems, finding P is relatively easy, and as a result of that determining Lvt is also easy. Measuring Svt(1) is not so easy when using a software based virtualization environment, but it is relatively easy in case of a logical partitioning type virtualization feature like Virtage. You can make survey the virtualized server after simply change the server mode from physical to virtual, because the logical partition's disk format is same with physical server's format. The R value is expected to be in the range from 0.9 to 0.99 as we measured at three example systems, but if your application program's R is unknown you may estimate it smaller.
Confirmation of performance improvement using virtualization is possible by the calculations we showed here.
VI. CONCLUSION
In this paper, we have described that one physical server's performance will be increased by improving concurrency using virtualization technology, because there are a many applications which can’t use multi-processors efficiently. Essentially, it means that virtualization assists improvement of efficient resource utilization, but we can also say that the virtualization technology can improve physical server's performance.
How the performance will improve depends on characteristics of application programs. Virtualization overhead may be striking, if the target programs already have high concurrency on a physical server. When you apply virtualization to your systems, you should evaluate their characteristics carefully, but this method to improve multi-processor's performance is very important in future, because microprocessor technologies advance in the direction of multi-processor and multi-core.
We will continue to study methods of performance evaluations as well as methods to improve systems performance for server virtualization environments.
REFERENCES
[1] Angela C. Sodan, et.al., “Parallelism via Multithreaded and Multicore CPUs,” IEEE Computer, Vol.43,No.3: pp.24-32 (2010).
[2] Wu-chun Feng, et.al. “Tools and Environments for Multicore and Many-Core Architectures,” IEEE Computer, Vol.42,No.12: pp.26-27 (2009).
[3] H. Ueno, et al.; Virtage: Hitachi’s Virtualization Technology. In: GPC 2009 Workshop Proceedings of Conference, pp. 121-127. IEEE-CS, Los Alamitos (2009)
[4] H. Ueno, et al.; Virtage: Server Virtualization with Hardware Transparency. In: Euro-Par 2009 Workshops, LNCS 6403, pp. 404-413, Springer-Verlag Berlin Heidelberg (2010)
[5] P. Apparao, et al.: Architectural Characterization of VM Scaling on an SMP Machine: ISPA 2006 Workshops, LNCS 4331, pp.464--473, Springer, Heidelberg (2006)
[6] H. Umeno, et al.: Development of a High Performance Virtual Machine System and Performance Measurements for it: IPSJ J. Information Processing, Vol.4 pp. 68--78 (1981)
[7] J.E. Smith, R. Nair: The Architecture of Virtual Machines: IEEE Computer, pp. 32--38 (2005)
[8] R. Uhlig, et al.: Intel Virtualization Technology: IEEE Computer, pp. 48--56 (2005)
TABLE I
PERFORMANCE ANALYSIS OF THREE EXAMPLE SYSTEMS
item
case
1 workload set workload set at maximum core
scalability in virtuali-zation V:P
perf . ratio N of cores
total perf . ratio N of cores
N of workload
set f or phy.
sv. f or virt.
sv.
(a) (b) (c) (d) (e) (f ) (g)
Simple 1.00 2 31.7 31.7 64 32 0.99
Virus scan 0.68 1 3.85 5.68 8 6 0.95
4-applications 0.85 4 1.615 1.9 8 2 0.95
[9] J.E. Smith, R. Nair: Virtual Machines, Versatile Platforms for Systems and Processes, Elsevier Inc. (2005)
[10] A. Barham, et al.: Xen and the Art of Virtualization: Proc. The 19th ACM Symposium on Operating Systems Principles, pp. 164--177 (2003)
[11] H. Umeno and S. Tanaka: New Methods for Realizing Plural Near-Native Performance Virtual Machines: IEEE Transactions on Computers, Vol. C-36, No.9, pp. 1076--1087 (1987)