Newport Lineages by Whole Genome Sequencing
Guojie Cao1, Jianghong Meng1, Errol Strain2, Robert Stones3, James Pettengill4, Shaohua Zhao5, Patrick McDermott5, Eric Brown4, Marc Allard4*
1Department of Nutrition and Food Science, University of Maryland, College Park, Maryland, United States of America,2Biostatistics Branch, Center for Food Safety and Applied Nutrition, U.S. Food and Drug Administration, College Park, Maryland, United States of America,3Food and Environment Research Agency, York, United Kingdom,4Division of Microbiology, Office of Regular Science, Center for Food Safety and Applied Nutrition, U.S. Food and Drug Administration, College Park, Maryland, United States of America,5Division of Animal and Food Microbiology, Office of Research, Center for Veterinary Medicine, U.S. Food and Drug Administration, Laurel, Maryland, United States of America
Abstract
SalmonellaNewport has ranked in the top threeSalmonellaserotypes associated with foodborne outbreaks from 1995 to
2011 in the United States. In the current study, we selected 26S. Newport strains isolated from diverse sources and geographic locations and then conducted 454 shotgun pyrosequencing procedures to obtain 16–246coverage of high
quality draft genomes for each strain. Comparative genomic analysis of 28 S. Newport strains (including 2 reference genomes) and 15 outgroup genomes identified more than 140,000 informative SNPs. A resulting phylogenetic tree consisted of four sublineages and indicated that S. Newport had a clear geographic structure. Strains from Asia were divergent from those from the Americas. Our findings demonstrated that analysis using whole genome sequencing data resulted in a more accurate picture of phylogeny compared to that using single genes or small sets of genes. We selected loci around themutSgene ofS. Newport to differentiate distinct lineages, including those betweeninvHandmutSgenes at the 39 end ofSalmonellaPathogenicity Island 1 (SPI-1), ste fimbrial operon, and Clustered, Regularly Interspaced, Short Palindromic Repeats (CRISPR) associated-proteins (cas). These genes in the outgroup genomes held high similarity with eitherS. Newport Lineage II or III at the same loci.S. Newport Lineages II and III have different evolutionary histories in this region and our data demonstrated genetic flow and homologous recombination events around mutS. The findings suggested that S. Newport Lineages II and III diverged early in the serotype evolution and have evolved largely independently. Moreover, we identified genes that could delineate sublineages within the phylogenetic tree and that could be used as potential biomarkers for trace-back investigations during outbreaks. Thus, whole genome sequencing data enabled us to better understand the genetic background of pathogenicity and evolutionary history ofS. Newport and also provided additional markers for epidemiological response.
Citation:Cao G, Meng J, Strain E, Stones R, Pettengill J, et al. (2013) Phylogenetics and Differentiation ofSalmonellaNewport Lineages by Whole Genome Sequencing. PLoS ONE 8(2): e55687. doi:10.1371/journal.pone.0055687
Editor:Paul J. Planet, Columbia University, United States of America
ReceivedJuly 14, 2012;AcceptedJanuary 2, 2013;PublishedFebruary 11, 2013
This is an open-access article, free of all copyright, and may be freely reproduced, distributed, transmitted, modified, built upon, or otherwise used by anyone for any lawful purpose. The work is made available under the Creative Commons CC0 public domain dedication.
Funding:Research funds were provided by the U. S. Food and Drug Administration. The funders had no role in study design, data collection and analysis, decision to publish, or preparation of the manuscript.
Competing Interests:The authors have declared that no competing interests exist.
* E-mail: [email protected]
Introduction
Salmonellosis is a major contributor to global public health burden. In the United States, non-typhoid Salmonella annually cause an estimated 1.4 million gastroenteritis cases [1] and several billion dollars of economic loss [2]. Non-typhoidSalmonellaaccount for only 11% of foodborne illnesses [3], but cause 35% of hospitalizations and 28% of the deaths related to foodborne illnesses [4]. There are over 1,500 serotypes inSalmonella. enterica subsp. enterica[5]. According to CDC [3],S.Newport ranked in the top three Salmonella serotypes associated with foodborne outbreaks in the United States. The number of S. Newport outbreaks increased markedly since 1995, causing at least 100,000 infections annually [3]. S. Newport was responsible for several major outbreaks associated with tomatoes, ground beef, alfalfa sprouts, and other food products since 2002 [3,6,7,8,9]. S. Newport displays high levels of genomic diversity and is poly-phyletic according to multilocus enzyme electrophoresis (MLEE)
[10] and multilocus sequence typing (MLST) [11,12,13]. S. Newport has been split into three lineages in its evolutionary tree using MLST [14]. Most strains from Europe belong toS. Newport Lineage I, whereas most strains from North America belong toS. Newport Lineages II and III [14].
genetic elements as well as to help microbes survive phage predation; the CRISPR/cas system also facilitated the microbes to adapt to specific niche [22,23,24]. A recent study on CRISPR/cas system in E. coli and Salmonella revealed phylogeny of the cas protein family for different serotypes [25].
Since the first two Salmonella whole genome sequences were available in 2001 [26,27], there were 28 complete genomes and over 90 draft genomes available in GenBank, including two S. Newport genomes, S. Newport SL254 and S. Newport SL317. Whole genome sequencing has been increasingly used as a tool for evolutionary studies and epidemiological investigations [9,28,29,30,31,32]. In the current study, we performed pyrose-quencing to obtain 16–24 6 coverage (except strain from
canine_AZ_2003 with 96coverage) of high quality draft genomes of 26 S. Newport strains from wide range of sources and geographic locations. Our data demonstrated the phylogenetic relationship among S. Newport strains and revealed variations around mutS gene, providing genetic evidence of recombination events. Moreover, genes that delineate major lineages and sublineages were identified and could be used as biomarkers to develop tools for trace-back studies for epidemiology and outbreak investigations.
Materials and Methods
Bacterial Strains
We selected 26S.Newport strains isolated from diverse sources and geographic locations (Table 1). S. Newport SL254 (ABEN01000000) andS.Newport SL317 (ABEW00000000) were downloaded from GenBank as reference genomes. There are total 15 Salmonella genomes were chosen to be outgroup genomes according to pervious study [33,34]. They are S. I 4, [5],12:i-SL474 (ABAO00000000),S. Kentucky CDC191 (ABEI00000000), S. Kentucky CVM29188 (ABAK00000000), S. Dublin CT_02021853 (CP001144), S. Gallinarum 287/91 (AM933171), S. Tennessee CDC07-0191 (ACBF00000000), S. Typhimurium 14028S (NC_016856.1),S. Typhimurium LT2 (NC_003197.1),S. Typhimurium SL1344 (NC_016810.1),S. Typhimurium D23580 (NC_016854),S.Choleraesuis SC-B67 (AE017220),S.Paratyphi C RKS4594 (CP000857),S.Virchow SL491 (ABFH00000000),S. Saintpaul SARA29 (ABAN00000000) and S. Hadar RI_05P066 (ABFG00000000).
Pulsed Field Gel Electrophoresis (PFGE)
PFGE was performed according to the procedure as previously described [11].
Genome Sequencing, Assembling and Annotation Bacterial cells were pelleted from one ml of pure Tryptic-Soytone-Broth from overnight culture by centrifugation and DNA prepared using the DNeasy Blood & Tissue Kit (Qiagen, Valencia, CA) according to the manufacturer’s instructions. We sequenced 26 S. Newport strains using Roche 454 GS-FLX Titanium sequencer (Roche, Branford, CT) to obtain 16–246coverage of
draft genomes (except strain from canine_AZ_2003 with 9 6
coverage). This platform provides longer read lengths than other sequencing platforms to obtain raw sequences.De novoassemblies were performed using the Roche Newbler (v 2.3) software package. Annotation of resulting contigs was finished by NCBI according to Prokaryotic Genomes Automatic Annotation Pipeline (PGAAP) [35]. Phylogenetically informative SNPs were identified via two independent alignment methods: 1) multiple genome alignment of whole genome sequencing contigs using MAUVE [36], and 2) clustering of annotated open reading frames (ORFs)
using reciprocal best Basic Local Alignment Search Tool (BLAST, http://blast.ncbi.nlm.nih.gov/Blast.cgi) hits with a 70% sequence identity setting followed by alignment with Multiple Sequence Comparison by Log-Expectation (MULCLE) [37].
Phylogenetic Tree Reconstruction
Parsimony phylogenetic tree was constructed based on 147,780 concatenated informative SNPs by TNT [38] with finding minimum tree length 20 times and 100,000 iterations. We extracted seven housekeeping genes to perform MLST analysis. Concatenated housekeeping gene sequences were analyzed by TNT [38] with finding minimum tree length 20 times and 100,000 iterations. Moreover, we performed multiple sequence alignment using MULCLE [37] in SeaView 4 [39] and collected concate-nated sequences ofcas genes (cas1, cas2, cas5, cse1, cse2, cse3 and cse4) with around 6k bps. Strains from frog_Vietnam, fish_-Hong_Kong, fish_Vietnam, canine_AZ_2003 and pig_ear_CA were not involved in this analysis. We performed TNT [38] with finding minimum tree length 20 times and 100,000 iterations to display evolutionary relatedness ofcasgenes.
Recombination Analysis
We used ClonalFrame [40] to analyze effects of recombination events on the evolutionary history ofS. Newport Lineages II and III.S. DublinCT_02021853 was used as an outgroup genome to display the recombination events and substitutions between S. Newport Lineages II and III, which showed close relatedness to both lineages. All 29 Salmonella genomes were aligned using progressive MAUVE [36] with the default settings. We used the stripSubsetLCBs (locally collinear blocks) (http://gel.ahabs.wisc. edu/mauve/snapshots/) script to extract core blocks, which created core alignments longer than 500 bp that included all 29 genomes. We obtained total 510 LCBs. Given the computational demands necessary to analyze all 510 blocks simultaneously, we created three separate datasets each consisting of 50 randomly selected blocks. We ran ClonalFrame [40] on each of these three datasets with estimated parameters based on 200,000 generations of which the first 100,000 generations served as burn-in. The thinning interval was set to 100. We then used the Gelmin-Rubin statistic to determine whether the independent runs had converged on similar parameter estimates, which also provided evidence that random subsets of the genome did not bias our results. Furthermore, we used MAUVE [36] to compare the genomic organizations.
Differences of Gene Cluster betweeninvHandmutS Genes
We performed blastp to search best match of genes between invHandmutSgenes, including Gene Clusters 1, 2 and 3. Tblastn was employed to verify the searching results.
Pairwise Distance Matrix
MEGA 5.05 [41] was employed to construct evolutionary distance (no. of differences) over sequence pairs between groups with 1,000 bootstrap iterations.
Searching for Most Variable Genes
default settings with a 95% sequence identities cutoff. Maximum and minimum length of a gene cluster to search was 58,000 and 10 bp, respectively. MUSCLE [37] was employed to perform alignment with default settings. SNPs of these gene clusters were detected and were used to create phylogenetic matrix to construct phylogenetic tree using TNT [38] and count the informative SNPs that delineating major and sublineages on the nodes. Then we selected the genes containing the largest number of informative SNPs that defined major lineages and sublineages.
Results
Phylogenetic Relationship
Pyrosequencing was used to obtain 16–246coverage (except strain from canine_AZ_2003 with 96coverage) of high quality draft genomes of the 26 S. Newport strains with genome sizes ranging from 4.6 M bp to 5.0 M bp (Table 1). A total of 15 GenBank strains were selected as outgroup genomes to determine evolutionary relatedness and test polyphyly with S. Newport
according to previous studies [33,34] and one unpublished study of Center for Food Safety and Applied Nutrition, FDA. The outgroup genomes had close relatedness withS. Newport or were able to separate S. Newport strains. S. Newport SL254 and S. Newport SL317 were selected as reference genomes ofS. Newport Lineages II and III, respectively [14]. S. Newport strains farm_1_VA_2007 and farm_15_VA_2007 are environmental isolates from a farm on the Virginia Eastern Shore. Among the 26 draft genomes, the largest genome size was 5.01 M bp of cannine_AZ_2003, while the smallest one was 4.65 M bp of pepper_Vietnam. There was no correlation between genome size and major lineages or sublineages.
A total of 147,780 informative SNPs were obtained from multiple genome alignment and were used to construct a parsi-mony phylogenetic tree (Figure 1) with 100,000 iterations by TNT [38]. All 28S. Newport genomes (includingS. Newport SL254 and SL317) were grouped into two major lineages (Figure 1), S. Newport Lineages II and III [14]. S. Newport Lineage II was further divided into sublineages IIA, IIB and IIC. Our data Table 1.Characteristics ofSalmonellaNewport strains used in the study.
ID Tree Label
PFGE Pattern
Number Antimicrobial Resistance Profile*
WGS Accession Number
Draft Genome Size (Mbp)
Number of Contigs
180 bison_TN_2004 JJPX01.0218 SUL AHTJ00000000 4.71 95
181 caprine_TN_2004 JJPX01.0381 SUL AHTK00000000 4.75 72
182 chicken_MO JJPX01.0030 NA AHTL00000000 4.71 71
183 ground_turkey_MD_2003 JJPX01.0502 NA AHTM00000000 4.80 88
184 equine_TN_2004_1 JJPX01.0025 SUL AHTN00000000 4.71 66
185 turkey_CO NA NA AHTO00000000 4.74 64
186 frog_Vietnam JJPX01.3333 NA AHTP00000000 4.67 59
187 fish_Hong_Kong JJPX01.0327 TET AHTQ00000000 4.70 76
188 fish_Vietnam JJPX01.1947 NA AHTR00000000 4.67 53
189 equine_TN_2004_2 NA SUL AHTS00000000 4.96 72
190 swine_TX NA NA AHTT00000000 4.92 73
191 cattle_NC_2003 JJPX01.0042 AMC,AMP,FOX,CHL,KAN,STR,SUL,TET,TIO AHTU00000000 4.90 72
192 chicken_GA JJPX01.0238 NA AHTV00000000 4.93 70
193 cattle_AZ_2003 JJPX01.0014 AMC,AMP,FOX,CHL,STR,SUL,TET,TIO AHTW00000000 4.93 69
194 canine_AZ_2003 JJPX01.0014 AMC,AMP,FOX,CHL,STR,SUL,TET,TIO AHTX00000000 5.02 384
195 ground_turkey_NM_2008 JJPX01.0238 TET AHTY00000000 4.93 85
196 ground_beef_GA_2004 JJPX01.0042 AMC,AMP,FOX,AXO,CHL,STR,SUL,TET,TIO AHTZ00000000 4.89 77
197 swine_IL_2001 NA AMC,AMP,FOX,CHL,GEN,KAN,STR,SUL,TET,TIO AHUA00000000 4.69 44
198 shrimp_India NA NA AHUB00000000 4.81 70
199 spinach_CO_2008 JJPX01.0538 NA AHUC00000000 4.80 49
200 cheese_Mexico JJPX01.0372 NA AHUD00000000 4.65 74
201 squid_Vietnam NA NA AHUE00000000 4.73 84
202 pepper_Vietnam NA NA AHUF00000000 4.65 70
203 pig_ear_CA NA NA AHUG00000000 4.73 62
117 farm_1_VA_2007#
NA NA AJMN00000000 4.81 91
118 farm_15_VA_2007#
NA NA AJMO00000000 4.81 75
NA S. Newport SL254 NA AMP, CHL, GEN, STR,AXO,SUL,TET ABEN01000000 4.83 0
NA S. Newport SL317 NA NA ABEW00000000 4.95 63
*AMC = Amoxicillin/Clavulanic Acid, AMP = Ampicillin, FOX = Cefoxitin, AXO = Ceftriaxone, CHL = Chloramphenicol, GEN = Gentamicin, KAN = Kanamycin, STR = Streptomycin, SUL = Sulfamethoxazole or Sulfisoxazole, TET = Tetracycline, TIO = Ceftiofur.
#
demonstrated that S. Newport displayed a clear geographic structure. For example, isolates from frog_Vietnam, fish_Hong_-Kong, fish_Vietnam, shrimp_India, squid_Vietnam and pepper_-Vietnam were placed in two sublineages (IIA and IIB) within Lineage II, and divergent from those from the Americas (IIC). The two Vietnamese strains in IIA grouped together to the exclusion of the other Asian strain and the same grouping of Vietnamese strains was also seen in IIB. Furthermore, IIC including one Mexican strain (cheese_Mexico) and many North American strains defined an Americas clade and were separated from the Asian clades within Lineage II. However, this structure was imperfect with pig_ear_CA located in IIA, an otherwise Asian clade. The U.S. strains from various sources were diverse and grouped into both major lineages. All strains in Lineage III were isolated from the United States.S. Newport Lineages II and III were polyphyletic, namely, Lineage III displayed closer evolution-ary relationship with S. Hadar and S. Typhimurium outgroups than Lineage II (Figure 1).
Since multilocus sequence typing (MLST) has been used as a common analysis tool to study the phylogenetic relatedness and
epidemiology ofSalmonella, we extracted seven housekeeping genes (aroC, dnaN, hemD, hisD, purE, sucA, and thrA) of genomes in the current study (except strain from canine_AZ_2003 because of sequence quality) and performed MLST analyses (Figure 2). MLST indicated that S. Newport Lineage II was grouped into three sublineages with minor differences. For example, sublineage IIA showed closer relatedness with IIB than IIC. Additionally, Lineages II and III were separated by outgroup genomes, although outgroups displayed different relatedness compared with the parsimony phylogenetic tree (Figure 1). For example,S. Virchow, S. Paratyphi C andS. Choleraesuis showed closer relationship with Lineage II.
Furthermore, we listed pairwise SNP variation among these four S. Newport sublineages (IIA, IIB, IIC and III) and five different outgroups (Table 2). The inter-lineage SNP diversity was remark-able indicating the extensive genomic diversity withinS. Newport. For example, the distance between Lineage III and sublineage IIB was approximately 36,800 SNPs, which was greater than that between Lineage III and S. Hadar RI_05P066 (approximately
34,400). Within Lineage II, sublineage IIC had closer relationship with IIB than IIA (Figure 1, Table 2).
We analyzed informative SNPs that define sublineages in the phylogenetic trees (Table S1). The SNPs that delineated the sublineages originated from various regions around the genome of S. Newport and included a variety of genes assigned to diverse functions including virulence, DNA replication and repair, and metabolism. For example, there were approximately 13,000 informative SNPs that changed only once and could differentiated Lineages II and III. Additionally, we analyzed genes defining the sublineages of Lineage II as well. For example, there are 2831, 2508, 1259 informative SNPs that defined sublineages IIA, IIB, IIC, respectively.
Moreover, we listed variable genes delineating various sublineages with their SNP changes, gene names and genome locus alignment coordinates (Table S1). We selected informative SNPs from 20 most variable genes (with highest number of informative SNPs that changed once and defined all members
of each major lineage and sublineage) defining the two major lineages and delineating sublineages IIA, IIB and IIC. For example,tpiAgene (SNSL254_A4410) could be used as a marker to differentiate Lineages II and III. At position 91 of the alignment, nucleotides inS. Newport SL254 and SL317 were A and G, respectively, and amino acid changed from threonine to alanine. Variable genes found within sublineages IIA and IIB could be used as markers for Asian strains. Furthermore, the most variable genes with the largest numbers of informative SNPs could be used as targets of resequencing (Table S1). For example, there were 78 SNPs incarB(3228 bp) and 71 SNPs in aceE (2664 bp).
A cluster of multidrug-resistantS. Newport strains was placed in IIC, namely, node M in the parsimony tree (Figure 1). Previous studies indicated thatS. Newport MDR-AmpC (resistant to third generation cephalosporins containing an ampC ß–lactamase gene [43,44]) strains belonged to S. Newport Lineage II [14]. We identified the 20 most variable genes containing informative SNPs
Figure 2. MLST analysis ofS. Newport and outgroup genomes. Seven housekeeping genes were selected and MLST dendrogram was performed by TNT [38] with 100,000 iterations.S. Newport was divided into two major clusters, which were separated by outgroup genomes. Lineage II was divided into three sublineages, which display minor differences compared with the parsimony tree. Sublineage IIA showed closer relatedness with IIC than IIB.
defining this sublineage (Table S1). Interestingly, acrD (SNSL254_A2674), encoding a multidrug efflux protein, con-tained 12 informative SNPs defining sublineage IIC with 3114 bp length. All strains of sublineage IIC had nucleotide C at the position 84, whereas all otherS. Newport strains had T at the same locus.
Additionally, five MDR strains were grouped together, in-cluding cattle_AZ_2003, S. Newport SL254, cattle_NC_2003, cannine_AZ_2003, ground_beef_GA_2004 (Figure 1, Table 1). The one exception was swine_IL_2001, which was MDR but separated from the other MDR strains by ground_tur-key_NM_2008 that was only resistant to Tetracycline. Further-more, we analyzed the informative SNPs that delineating the five-MDR-strains group (Node M, Figure 1) within sublineage IIC and discovered a total of 33 informative SNPs (Table S1). It is notable that 17 of the informative SNPs were non-synonymous. For example, within ksgA gene encoding RNA dimethyltransferase associated with antibiotic resistance [45], the MDR group had nucleotide A at the position of 689, whereas the otherS. Newport strains had G at the same position (Table S1), resulting in an amino acid change from asparagine to glycine.
We compared the genomic organization ofS. Newport genomes of distinct subgroups (Figure S1). We usedS. Newport SL254 as reference genome, which was completed genome and located inS. Newport Lineage IIC, to compare with S. Newport SL317, pig_ear_CA and fish_Vietnam, which located at Lineage III, IIA and IIB, respectively. Our MAUVE [36] data indicated that large indels and rearrangement events could be found, although the general genomic organizations are same.
Because of the importance of recombination events in the evolution ofS. Newport, we performed ClonalFrame [40] analyses to display the effects of recombination events on the evolutionary history ofS. Newport (Figure S2). Our data indicated that the r/m (Figure S2A: r/m equals the ratio of possibilities that a given site is altered through recombination event and substitution) and r/h (Figure S2B:r/hequals the ratio of rates of recombination event and substitution occur at a locus) ratios were 1.68 and 0.1, respectively. Moreover, the genomic representation mode was selected to display the recombination events (red line) and substitution (green triangle) on the node of II vs. III and IIA vs. IIB&C (Figure S2 C and D). Our data indicated that re-combination events with Lineage II happened more frequently than the ones between Lineages II and III.
Loci betweeninvHandmutS
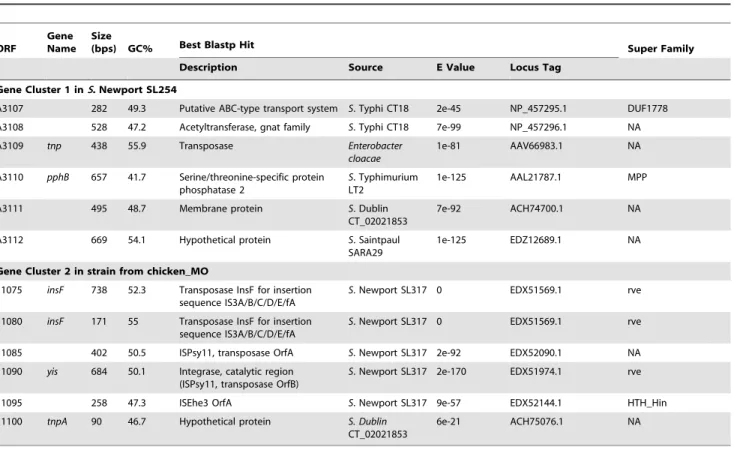
Genes at loci betweeninvHandmutSgenes in both Lineages II and III displayed distinct contents and were defined as Gene Clusters 1 and 2, respectively (Table 3). Because they were conserved within each lineage, S. Newport strains SL254 and chicken_MO were selected for further analysis of these gene clusters. All 15 outgroup genomes shared Gene Cluster 1 at the same locus withS. Newport SL254, although minor differences were found.
In Gene Cluster 1 ofS. Newport SL254, there were six genes that ranged from 282 to 669 bp, encoding ABC transport system protein, transposase, phosphatase and membrane protein (Table 3). They had distinct G+C% contents ranging from 41.7 to 55.9%. The best hits of blastp against these genes were found in various serotypes. For example, the best blast match ofpphBgene in Gene Cluster 1 wasS.Typhimurium LT2; and the best blastp match oftnpgene encoding a transposase inS. Newport SL254 wasEnterobacter cloacaewith 84% identities and 95% coverage.S. Typhimurium andS. Bardo had 62% identities and 95% coverage oftnpwithS. Newport SL254. BLAST matches of other genes in Gene Cluster 1 were distributed broadly across Salmonella serotypes. Additionally, one large insertion (Gene Cluster 3) was observed at the 39end of Gene Cluster 1 inS.Newport strain from fish_Hong_Kong (Figure 1), including ORFs homologous to genes encoding transposase, integrase, phage related proteins and proteins of Type I Restriction Modification System inVibrio. For example, according to blastp search hsdS gene showed 61% identities and 79% positives to gene inVibrio splendidus;hsdMgene showed 84% identities and 92% positives to gene in Vibrio metschnikovii. Detailed information of Gene Cluster 3 was available in Table S2. These findings suggested that loci betweeninvHand mutSwere hot spots for horizontal gene transfer or recombination events and could facilitate acquisitions of new genetic elements.
A total of six genes ranging from 90 to 738 bp (46.7 to 55% G+C% contents) were identified in Gene Cluster 2 of chick-en_MO (Table 3). The best blastp hits of the genes, excepttnpA gene, wereS. Newport SL317; and the best BLAST match oftnpA was S. Dublin CT_02021853. The best blastp hit of insF in chicken_MO was a transposase ofS. Newport SL317 with 100% identities and 100% coverage, and insF was also found in S. arizonae 62:z4,z23 with 88% identities and 68% coverage and in S. Hadar RI_05P066 with 93% identities and 100% coverage, but not in otherSalmonella serotypes. The other four genes in Gene Cluster 2 had a broader distribution among different serotypes of Table 2.Average pairwise distance (no. of nucleotide difference) for the major groups shown in Figure 1.
sublineage III Hadar Typhimurium sublineage IIC sublineage IIA sublineage IIB Dublin Gallinarum
sublineage III
Hadar 34418 (93)
Typhimurium 36094 (90) 35900 (105)
sublineage IIC 35048 (128) 37133 (147) 38640 (144)
sublineage IIA 35627 (108) 37320 (152) 38893 (154) 17497 (95)
sublineage IIB 36812 (106) 38529 (122) 38752 (131) 15605 (91) 25768 (85)
Dublin 39879 (118) 40575 (133) 39275 (154) 40314 (175) 40878 (130) 41749 (136)
Gallinarum 43027 (100) 43758 (159) 42824 (151) 43453 (158) 42666 (133) 44822 (124) 22070 (144)
Kentucky 49260 (106) 49409 (80) 48612 (90) 50194 (96) 50694 (128) 48236 (146) 50955 (98) 53464 (96)
The valve refers to number of SNPs differences (standard deviation) between different selected groups and strains. The numbers of base differences per sequence from averaging over all sequence pairs between groups were shown.
Salmonella. The best blastp hits of these four genes were proteins fromS. Newport SL317 andS. Dublin CT_02021853 with at least 93% identities and with 100% coverage. Additionally,tnpAgene in chicken_MO was absent inS. Newport Lineage II andS. Virchow SL491 but present in all other genomes in the current study.
Gene Cluster Encoding Fimbrial Operon andcasGenes Similar to those betweeninvHandmutS, genes at the 39end of mutSdisplayed significant variations between Lineages II and III, and genes of Lineage II shared high similarity with those of the outgroup genomes (Table 4).steABCDEFfimbrial operon located betweenrelAandmazGgenes was conserved in Lineage II and all outgroup genomes, but was not found in Lineage III. Blastp results demonstrated that this fimbrial operon was present in certain Salmonellaserotypes. Lineage III strains had only two genes at the same locus, encoding RelE/ParE family plasmid stabilization system protein (SNSL317_A4074) and putative addiction module antidote protein (SNSL317_A4073). Interestingly,steFgene inS. Newport SL254 and genes betweenrelAandmazGinS. Newport SL317 were found adjoining each other inS. Typhi CT18.
We definedcasgenes located at the 39end ofmutSin Lineages II and III ascasSequence 1 and 2, respectively. Multiple sequence alignments of concatenated nucleotide acids for cas Sequence 1 and 2 showed significant variations. Moreover, there are four collapsing groups in the parsimony tree because the sequence identities were almost 100% in each group, respectively. For example, there was only one substitution found at position 333 of strain from ground_turkey_MD_2003 in total 5,781 bp compared
with other four sequences in the group (data not shown). A parsimony tree was generated based oncasalignments using TNT [38] with 100,000 bootstrap iterations (Figure 3), showing thatcas proteins in Lineages II and III displayed divergent phylogenetic relatedness, and were separated by outgroup genomes. For example,casgenes ofS. Paratyphi C andS. Choleraesuis displayed closer relatedness withcasSequence 2 of Lineage III than Lineage II strains (Figure 3).
Discussion
In the current study, whole genome sequencing data revealed that strains ofS. Newport Lineages II and III are polyphyletic to each other and are separated by other Salmonella serotypes, includingS. Hadar andS. Typhimurium (Figure 1). A phyloge-netic tree based on whole genome sequencing data by Fricke et al. [15] suggested similar relationships and illustrated thatS.Virchow SL491 phylogenetically displayed closer relationship with S. Newport lineages than others. In Fricke’s [15] study, 28 sequenced genomes representing 21 serotypes ofS. enterica were selected to demonstrate the evolutionary history of sublineages ofS. enterica. Conversely, we focused on variability between major lineages and sublineages ofS. Newport with 15 outgroup genomes. Although a phylogenetic tree based on whole genome sequencing data provided a more accurate dendrogram than traditional subtyping methods [32], sampling was a critical factor to accomplish study research goals. Importantly, our data provides an insightful picture to reconstruct the evolutionary history of variation within S. Table 3.Characteristics of genes/open reading frames (ORFs) betweeninvHandmutSgenes in Gene Cluster 1 ofS. Newport SL254 and Gene Cluster 2 of strain from chicken_MO.
ORF
Gene Name
Size
(bps) GC% Best Blastp Hit Super Family
Description Source E Value Locus Tag
Gene Cluster 1 inS. Newport SL254
A3107 282 49.3 Putative ABC-type transport system S. Typhi CT18 2e-45 NP_457295.1 DUF1778 A3108 528 47.2 Acetyltransferase, gnat family S. Typhi CT18 7e-99 NP_457296.1 NA
A3109 tnp 438 55.9 Transposase Enterobacter
cloacae
1e-81 AAV66983.1 NA
A3110 pphB 657 41.7 Serine/threonine-specific protein phosphatase 2
S. Typhimurium LT2
1e-125 AAL21787.1 MPP
A3111 495 48.7 Membrane protein S. Dublin
CT_02021853
7e-92 ACH74700.1 NA
A3112 669 54.1 Hypothetical protein S. Saintpaul
SARA29
1e-125 EDZ12689.1 NA
Gene Cluster 2 in strain from chicken_MO
11075 insF 738 52.3 Transposase InsF for insertion sequence IS3A/B/C/D/E/fA
S. Newport SL317 0 EDX51569.1 rve
11080 insF 171 55 Transposase InsF for insertion sequence IS3A/B/C/D/E/fA
S. Newport SL317 0 EDX51569.1 rve
11085 402 50.5 ISPsy11, transposase OrfA S. Newport SL317 2e-92 EDX52090.1 NA
11090 yis 684 50.1 Integrase, catalytic region (ISPsy11, transposase OrfB)
S. Newport SL317 2e-170 EDX51974.1 rve
11095 258 47.3 ISEhe3 OrfA S. Newport SL317 9e-57 EDX52144.1 HTH_Hin
11100 tnpA 90 46.7 Hypothetical protein S. Dublin CT_02021853
6e-21 ACH75076.1 NA
Differences between Gene Cluster 1 and 2 demonstrated the mosaic genomic structure aroundmutSgene. Transposase and integrase were found in both sequences, indicating that both of them could be the hot spots for recombination events. The genes in bothS. Newport SL254 and strain from chicken_MO are ordered top to bottom as their synteny on bacterial chromosome from 59to 39.
Newport. As more sequenced Salmonella genomes become avail-able, more accurate and comprehensive phylogenetic information will give us a better understanding of the evolution and ecology of Salmonella, for both subspecies and single serotypes [46].
Conventional subtyping methods, such as MLST and Pulsed Field Gel Electrophoresis (PFGE), have been used to differentiate pathogenic strains during outbreaks and trace-back investigations and to study the phylogenetic organization of pathogens. MLST analyses (Figure 2) indicated thatS. Newport was divided into two major clusters and was separated by outgroup genomes. Lineage II was grouped into three sublineages; however, sublineage IIA displayed closer relatedness with IIC than IIB, which was different with the genomic based parsimony tree (Figure 1). This was not unexpected as the genomic database was significantly larger than the MLST database. MLST indicated that these seven house-keeping genes were valuable to differentiate major and sublineages of S. Newport, though MLST may not accurately show the relationships among the sublineages. Therefore, whole genome sequencing data was able to provide more accurate phylogenetic relationship than small sets of genes. However, PFGE often may not be able to differentiate highly clonal strains [28,32]. A combination of whole genome sequencing and phylogenetic analysis has been proven to provide enough accuracy and sensitivity for epidemiological investigations [28,32]. In the current study, comparisons of PFGE (Figure 4) and the phylogenetic tree (Figure 1) illustrated that PFGE was not able to delineate the major lineages correctly, as expected. For example, according to the PFGE profile (Figure 4), three strains of sublineage IIB, namely, frog_Vietnam, fish_Hong_Kong and fish_Vietnam, were located with strains of Lineage III to form a lineage unsupported by sequence analysis. Bell et al. [9] demonstrated that whole genome sequencing and phylogenetic analysis were able to differentiate S. Newport strains with an identical PFGE pattern during an outbreak case study, providing detailed information aboutS. Newport’s complex ecology to the investigators.
The parsimony tree had a clear geographic structure, which appears to be a common characteristic of Salmonella [28,32]. S. Newport strains isolated from Asia were grouped together and
divergent from those isolated from the Americas (Figure 1). Lineages II and III displayed extensive genomic diversity. For example, Lineage II strains from North America had closer evolutionary relatedness with those of Lineage II from Asia than ones of Lineage III from North America, suggesting that the geographic structure could be observed only among highly clonal lineages, but may not be apparent among the major lineages. Moreover, there was a diverse phylogenetic structure with S. Newport strain from cheese_Mexico genetically unique to other strains of North America (sublineage IIC in Figure 1), suggesting thatS. Newport strains isolated from different states in the United States and in the Americas may have finer geographic structure.S. Newport strains from Asia showed very diverse geographic structure. Strains from Vietnam within sublineages IIA and IIB displayed closer relationship than with another Asian strain within the same sublineage (Figure 1). In addition, strains from Vietnam originated from different sublineages of Lineage II, such as frog_Vietnam and squid_Vietnam. However, there was one exception in that one isolate from the United States, pig_ear_CA was located within sublineage IIA, which was otherwise composed of Asian strains (Figure 1). This result indicated thatS. Newport strains from Asia or this sublineage may have extensive genomic diversity and that geographic structure may be better identified among the most highly clonal lineages. We hypothesized that strain pig_ear_CA may be related to a food import or export from the Pacific Rim. Analysis of more isolates is needed to confirm the pig-ear sublineage.
The SNPs that delineating each sublineage (Table S1) were the most valuable for both targeted resequencing efforts and for rapid subtyping methods for trace-back of futureS. Newport outbreak investigations and diagnosis, including the SNPs defining MDR strains, though plasmids likely play a critical role for antibiotic resistance ofS. Newport [47,48]. Sangal et al. [14] indicated that most of Lineage III strains were pan-susceptible and all MDR-AmpC strains were exclusively associated with two sequence types (STs) of Lineage II. Similarly, all MDR strains in the present study were grouped together within sublineage IIC. We hypothesized that the plasmids of MDR strains in the present study had the Table 4.Characteristics of genes/open reading frames (ORFs) betweenrelAandmazGgenes ofS. Newport SL254 and SL317.
ORF
Gene Name
Size
(bps) GC% Best Blastp Hit Super Family
Description Source E Value Locus Tag
S. Newport SL254
A3171 steA 588 49.3 putative fimbrial subunit S. Newport SL254 3e-136 ACF63661.1 Fimbrial A3172 steB 2646 55.5 fimbrial usher protein S. Newport SL254 0 ACF64468.1 PRK15223 A3173 steC 774 55 chaperone protein PapD S. Newport SL254 0 ACF62389.1 Pili_assembly A3174 steD 507 56.6 fimbrial subunit S. Newport SL254 2e-118 ACF63171.1 Fimbrial A3175 steE 471 50.7 fimbrial subunit S. Newport SL254 1e-110 ACF62527.1 Fimbrial A3176 steF 537 52.3 fimbrial subunit S. Newport SL254 1e-128 ACF62131.1 Fimbrial S. Newport SL317
A4073 288 48.3 putative addiction module antidote protein
S. Typhi CT18 2e-47 NP_457351.1 RHH_2
A4074 297 38.7 plasmid stabilization
system protein, RelE/ParE family
S. Newport SL317 2e-51 ZP_02697812.2 Plasmid_stabil
We listed the detailed information of genes betweenrelAandmazGgenes.S. Newport SL254 and SL317 were selected. Our data indicated the genomic diversity of this region between Lineages II and III. Interestingly, ORF SNSL254_A3176 and SNSL317_A4073 were found adjoining together inS. Typhi CT18. The existence ofstefimbrial operon might enable Lineage II strains to infect variable hosts. The genes in bothS. Newport SL254 and SL317 are ordered top to bottom as their synteny on bacterial chromosome from 59to 39.
same backbone as Y. pestis plP1202 and S. Newport pSN254, which could be broadly disseminated among MDR pathogens via horizontal or vertical gene transfer [47]. Our data found that genes associated with antibiotic resistance, acrD and ksgA, could delineate sublineage IIC and node M (Figure 1), respectively. Matsumura et al. [49] suggested thatacrDcontributed significantly to the formation of biofilm ofE coliK-12. AcrD also played a major role in the intrinsic and elevated resistance ofS.Typhimurium to a wide range of compounds [50]. Lama et al. [51] indicated that a nonsense mutation ofksgAcaused resistance to amicoumacin A in methicillin-resistantStaphylococcus aureus(MRSA).
The region aroundmutSwas thought to be an old region in the genome because it was part of the DNA mismatch repair system and SPI-1, which was acquired after Salmonella and E. coli separated from their common ancestor 100 million years ago [52]. Our findings indicated that diversities around conserved regions of the genome were found and provided an insightful understanding of the evolutionary process. Loci aroundmutSwere thought to be hot spots for horizontal gene transfer and
recombination events because this region was associated with pathogenicity and positive selection [53,54,55]. For example, our data showed that Gene Cluster 1 betweeninvHandmutSincluded genes encoding ABC transport system protein. Another recent study hypothesized that an ABC transporter gene was associated with the ability ofSalmonellato acquire nutrients for survival during host infection [56] and drug resistance [57]. A major finding from our study is that Gene Cluster 1 exists in Lineage II and all outgroup genomes, but not in Lineage III, suggesting that strains from these two major lineages may have different pathogenic capability. Moreover, the existence of transposable elements also could facilitate further genetic exchange within Gene Cluster 1. For example, Gene Cluster 3 in strain from fish_Hong_Kong (Table S2) was inserted at the 39end of Gene Cluster 1, illustrating that the evolution of this region is an ongoing process. Additionally, our data suggested that genes encoding restriction-modification (RM) subunits ofVibriowere homologous to ORFs in Gene Cluster 3.
The limit of serological classification is that some unrelated strains were considered to be the same serotype [10,58]. As more data is available, distinct lineages of the same serotype are commonly found [32]. Our data indicates thatS. Newport displays extensive genomic variation between the two major lineages, which are separated by other serotypes. Our data shows approximately 13,000 informative SNPs differences (SNPs that change once and define all members of these two major lineages) betweenS. Newport Lineages II and III. Moreover, the pairwise distance matrix (Table 2) suggests that the number of SNP differences between Lineage III and any sublineage of Lineage II was larger than that between Lineage III and S. Hadar RI_05P066.
S. Newport has been proposed to be paraphyletic or poly-phyletic [10,11,12,13,14] with distinct clonal lineages and it acted as a frequent donor or recipient of recombination events [46]. According to the cross-link analysis, Sangal et al. [14] hypothe-sized that Lineages II and III had arisen from a single lineage then differentiated or that recombination events frequently happened after Lineages II and III shared a niche and then would merge in the future. However, our data indicated that the recombination events between Lineages II and III were less frequent than those within Lineage II. In the current study, our phylogenetic analysis (Figure 1) demonstrated that Lineages II and III were polyphyletic and were divergent from each other by otherSalmonellaserotypes. The remarkable inter-lineage distance (Table 2) suggested thatS. Newport Lineages II and III diverged early on in the serotype evolution of S. Newport and that they have evolved largely independently. Horizontal gene transfer and recombination events have been the major force for evolution ofS. Newport [14] and
our data supports that this pathogenic serotype has extensive genomic diversity. It is likely that geographic and ecological structure provided physical proximity to facilitate the recombina-tion events among bacteria, which may form sublineages of pathogen populations [59].
Additionally, a study of the pan-genome family tree indicated thatS. Newport SL254 was separated fromS. Newport SL317 in some single gene trees by another serotype,S. Hadar RI_05P066 [34], which showed close relatedness with Lineage III in the present study (Figure 1, Table 2). This separation was confirmed by both the parsimony tree (Figure 1) and phylogenetic dendro-gram ofcas genes (Figure 3). In the current study, both of the MLST and cas genes could differentiate Lineage II and III; however, they could not delineate strains within Lineage II accurately. Therefore, full genome information or an improved MLST panel is needed to improve our understanding of the evolution of Salmonella [33,46]. Lineages II and III may have acquired thecasgene cluster from various sources. Although we do not fully understand the process of this genetic exchange, horizontal gene transfer also occasionally happened to housekeep-ing genes and this supports the hypothesis that the loci around mutSare hot spots for horizontal gene transfer.
As shown in Table 4,S. Newport Lineage II and the outgroup genomes containedstefimbrial operon between locirelAandmazG genes. The existence of the ste fimbrial operon may facilitate Lineage II strains differing in their adhesion abilities and competing within various ecological environments [33,60]. As den Bakker et al. suggested [33], genes enriched in different bacterial subpopulations could reveal various selective pressures acting on different subpopulations. Because genes between locirelA
Figure 4. Pulsed Field Gel Electrophoresis (PFGE) profile digested withXbaI.We performed PFGE analysis of 24S. Newport strains (without two environmental farm isolates) isolated from diverse sources and geographic locations. PFGE profiles divided these strains into two major clusters with different groupings compared with the phylogenetic tree based on whole genome wide SNPs.
and mazGof these two lineages were both adjoining inS. Typhi CT18, we thought this fimbrial operon may exist in Lineage III before it was lost. Thus, our data suggested that loci aroundmutS [61,62] displayed mosaic structure because of recombination events.
Supporting Information
Figure S1 S1. Genomic organization comparisons
be-tween sublineages.
(TIF)
Figure S2 S2. ClonalFrame analyses of recombination
events.
(TIF)
Table S1 S1. Most variable genes defining the major
lineages and sublineages ofS. Newport. (DOC)
Table S2 S2. Characteristics of genes/open reading
frames (ORFs) in Gene Cluster 3 of strain from fish_-Hong_Kong.
(DOC)
Acknowledgments
We thank the NCBI rapid annotation pipeline team, Dr. Ruth Timme, Dr. Yan Luo for key genome annotation services and Charles Wang for great help and expert data collection. We appreciate Dr. Xavier Didelot for help on ClonalFrame analyses. We also would like to acknowledge Rebecca Bell for providing historical environmental farm isolates. In particular, we would like to acknowledge Dr. Jie Zheng, Dr. Andrea Ottesen, Christine Keys, Tim Muruvanda, Cong Li from FDA-CFSAN for important discussion of this manuscript. We also acknowledge Jason Abbott from FDA-CVM for providing antibiotic resistance profiles. No human subjects or animals were used in this study. All authors have read the manuscript and agree to its content, subject matter, and author-line order. These data are novel and have not been previously published elsewhere.
Author Contributions
Conceived and designed the experiments: JM SZ EB MA. Performed the experiments: GC. Analyzed the data: GC JM ES RS JP SZ EB MA. Contributed reagents/materials/analysis tools: SZ PM EB MA. Wrote the paper: GC JM MA.
References
1. Mead PS, Slutsker L, Dietz V, McCaig LF, Bresee JS, et al. (1999) Food-related illness and death in the United States. Emerg Infect Dis 5: 607–625. 2. Voetsch AC, Van Gilder TJ, Angulo FJ, Farley MM, Shallow S, et al. (2004)
FoodNet estimate of the burden of illness caused by nontyphoidalSalmonella infections in the United States. Clin Infect Dis 38 Suppl 3: S127–134. 3. CDC (2006)SalmonellaSurveillance: Annual Summary. Atlanta, Georgia: US
Department of Health and Human Services, CDC.
4. Scallan E, Hoekstra RM, Angulo FJ, Tauxe RV, Widdowson MA, et al. (2011) Foodborne illness acquired in the United States–major pathogens. Emerg Infect Dis 17: 7–15.
5. Patrick AD GF-X (2007) Antigenic formulae of the Salmonella serovars, 9th ed. 6. Attorney S (2009) Multi-stateSalmonellaNewport outbreak leads to huge ground
beef recall.
7. Attorney S (2011) SproutSalmonellaNewport outbreak sickens six in Oregon and Washington.
8. CDC (2010) Investigation update: multi-state outbreak of human Salmonella Newport infections linked to raw alfalfa sprouts. Atlanta, Georgia: US Department of Health and Human Services, CDC.
9. Bell RL, Cao G, Meng J, Allard MW, Keys CE, et al. (2012)SalmonellaNewport Contamination of Produce: Ecological, Genetic, and Epidemiological Aspects. Salmonella: Classification, Genetics and Disease: Nova Publishers, Hauppauge NY. pp. In press.
10. Beltran P, Musser JM, Helmuth R, Farmer JJ, 3rd, Frerichs WM, et al. (1988) Toward a population genetic analysis of Salmonella: genetic diversity and relationships among strains of serotypesS. choleraesuis,S. derby,S. dublin,S. enteritidis,S. heidelberg,S. infantis,S. newport, andS. typhimurium. Proc Natl Acad Sci U S A 85: 7753–7757.
11. Harbottle H, White DG, McDermott PF, Walker RD, Zhao S (2006) Comparison of multilocus sequence typing, pulsed-field gel electrophoresis, and antimicrobial susceptibility typing for characterization ofSalmonella enterica serotype Newport isolates. J Clin Microbiol 44: 2449–2457.
12. Sukhnanand S, Alcaine S, Warnick LD, Su WL, Hof J, et al. (2005) DNA sequence-based subtyping and evolutionary analysis of selected Salmonella enterica serotypes. J Clin Microbiol 43: 3688–3698.
13. Torpdahl M, Skov MN, Sandvang D, Baggesen DL (2005) Genotypic characterization of Salmonella by multilocus sequence typing, pulsed-field gel electrophoresis and amplified fragment length polymorphism. J Microbiol Methods 63: 173–184.
14. Sangal V, Harbottle H, Mazzoni CJ, Helmuth R, Guerra B, et al. (2010) Evolution and population structure of Salmonella enterica serovar Newport. J Bacteriol 192: 6465–6476.
15. Fricke WF, Mammel MK, McDermott PF, Tartera C, White DG, et al. (2011) Comparative genomics of 28Salmonella entericaisolates: evidence for CRISPR-mediated adaptive sublineage evolution. J Bacteriol 193: 3556–3568. 16. Didelot X, Achtman M, Parkhill J, Thomson NR, Falush D (2007) A bimodal
pattern of relatedness between theSalmonellaParatyphi A and Typhi genomes: convergence or divergence by homologous recombination? Genome Res 17: 61– 68.
17. Brown EW, Mammel MK, LeClerc JE, Cebula TA (2003) Limited boundaries for extensive horizontal gene transfer amongSalmonellapathogens. Proc Natl Acad Sci U S A 100: 15676–15681.
18. Mills DM, Bajaj V, Lee CA (1995) A 40 kb chromosomal fragment encoding Salmonellatyphimurium invasion genes is absent from the corresponding region of theEscherichia coliK-12 chromosome. Mol Microbiol 15: 749–759. 19. Hu Q, Coburn B, Deng W, Li Y, Shi X, et al. (2008)Salmonella entericaserovar
Senftenberg human clinical isolates lacking SPI-1. J Clin Microbiol 46: 1330– 1336.
20. Sorek R, Kunin V, Hugenholtz P (2008) CRISPR–a widespread system that provides acquired resistance against phages in bacteria and archaea. Nat Rev Microbiol 6: 181–186.
21. Ishino Y, Shinagawa H, Makino K, Amemura M, Nakata A (1987) Nucleotide sequence of the iap gene, responsible for alkaline phosphatase isozyme conversion inEscherichia coli, and identification of the gene product. J Bacteriol 169: 5429–5433.
22. Deveau H, Garneau JE, Moineau S (2010) CRISPR/Cas system and its role in phage-bacteria interactions. Annu Rev Microbiol 64: 475–493.
23. Barrangou R, Fremaux C, Deveau H, Richards M, Boyaval P, et al. (2007) CRISPR provides acquired resistance against viruses in prokaryotes. Science 315: 1709–1712.
24. Vale PF, Little TJ (2010) CRISPR-mediated phage resistance and the ghost of coevolution past. Proc Biol Sci 277: 2097–2103.
25. Touchon M, Rocha EP (2010) The small, slow and specialized CRISPR and anti-CRISPR ofEscherichiaandSalmonella. PLoS One 5: e11126.
26. McClelland M, Sanderson KE, Spieth J, Clifton SW, Latreille P, et al. (2001) Complete genome sequence ofSalmonella entericaserovar Typhimurium LT2. Nature 413: 852–856.
27. Parkhill J, Dougan G, James KD, Thomson NR, Pickard D, et al. (2001) Complete genome sequence of a multiple drug resistantSalmonella entericaserovar Typhi CT18. Nature 413: 848–852.
28. Lienau EK, Strain E, Wang C, Zheng J, Ottesen AR, et al. (2011) Identification of a salmonellosis outbreak by means of molecular sequencing. N Engl J Med 364: 981–982.
29. Chin CS, Sorenson J, Harris JB, Robins WP, Charles RC, et al. (2011) The origin of the Haitian cholera outbreak strain. N Engl J Med 364: 33–42. 30. Harris SR, Feil EJ, Holden MT, Quail MA, Nickerson EK, et al. (2010)
Evolution of MRSA during hospital transmission and intercontinental spread. Science 327: 469–474.
31. Maki DG (2009) Coming to grips with foodborne infection–peanut butter, peppers, and nationwideSalmonellaoutbreaks. N Engl J Med 360: 949–953. 32. Allard MW, Luo Y, Strain E, Li C, Keys CE, et al. (2012) High resolution
clustering of Salmonella enterica serovar Montevideo strains using a next-generation sequencing approach. BMC Genomics 13: 32.
33. den Bakker HC, Moreno Switt AI, Govoni G, Cummings CA, Ranieri ML, et al. (2011) Genome sequencing reveals diversification of virulence factor content and possible host adaptation in distinct subpopulations ofSalmonella enterica. BMC Genomics 12: 425.
34. Jacobsen A, Hendriksen RS, Aaresturp FM, Ussery DW, Friis C (2011) The Salmonellaenterica pan-genome. Microb Ecol 62: 487–504.
35. Klimke W, Agarwala R, Badretdin A, Chetvernin S, Ciufo S, et al. (2009) The National Center for Biotechnology Information’s Protein Clusters Database. Nucleic Acids Res 37: D216–223.
37. Edgar RC (2004) MUSCLE: multiple sequence alignment with high accuracy and high throughput. Nucleic Acids Res 32: 1792–1797.
38. Goloboff P, Farris S, Nixon K (2008) TNT, a program for phylogenetic analysis. Cladistics 24: 774–786.
39. Gouy M, Guindon S, Gascuel O (2010) SeaView version 4: A multiplatform graphical user interface for sequence alignment and phylogenetic tree building. Mol Biol Evol 27: 221–224.
40. Didelot X, Falush D (2007) Inference of bacterial microevolution using multilocus sequence data. Genetics 175: 1251–1266.
41. Tamura K, Peterson D, Peterson N, Stecher G, Nei M, et al. (2011) MEGA5: molecular evolutionary genetics analysis using maximum likelihood, evolution-ary distance, and maximum parsimony methods. Mol Biol Evol 28: 2731–2739. 42. Edgar RC (2010) Search and clustering orders of magnitude faster than BLAST.
Bioinformatics 26: 2460–2461.
43. Fey PD, Safranek TJ, Rupp ME, Dunne EF, Ribot E, et al. (2000) Ceftriaxone-resistantSalmonellainfection acquired by a child from cattle. N Engl J Med 342: 1242–1249.
44. Dunne EF, Fey PD, Kludt P, Reporter R, Mostashari F, et al. (2000) Emergence of domestically acquired ceftriaxone-resistant Salmonella infections associated with AmpC beta-lactamase. JAMA 284: 3151–3156.
45. Park AK, Kim H, Jin HJ (2010) Phylogenetic analysis of rRNA methyltrans-ferases, Erm and KsgA, as related to antibiotic resistance. FEMS Microbiol Lett 309: 151–162.
46. Didelot X, Bowden R, Street T, Golubchik T, Spencer C, et al. (2011) Recombination and population structure inSalmonella enterica. PLoS Genet 7: e1002191.
47. Welch TJ, Fricke WF, McDermott PF, White DG, Rosso ML, et al. (2007) Multiple antimicrobial resistance in plague: an emerging public health risk. PLoS One 2: e309.
48. Fricke WF, Welch TJ, McDermott PF, Mammel MK, LeClerc JE, et al. (2009) Comparative genomics of the IncA/C multidrug resistance plasmid family. J Bacteriol 191: 4750–4757.
49. Matsumura K, Furukawa S, Ogihara H, Morinaga Y (2011) Roles of multidrug efflux pumps on the biofilm formation ofEscherichia coliK-12. Biocontrol Sci 16: 69–72.
50. Yamasaki S, Nagasawa S, Hayashi-Nishino M, Yamaguchi A, Nishino K (2011) AcrA dependency of the AcrD efflux pump in Salmonella enterica serovar Typhimurium. J Antibiot (Tokyo) 64: 433–437.
51. Lama A, Pane-Farre J, Chon T, Wiersma AM, Sit CS, et al. (2012) Response of Methicillin-Resistant Staphylococcus aureus to Amicoumacin A. PLoS One 7: e34037.
52. Fookes M, Schroeder GN, Langridge GC, Blondel CJ, Mammina C, et al. (2011)Salmonella bongoriprovides insights into the evolution of the Salmonellae. PLoS Pathog 7: e1002191.
53. Orsi RH, Sun Q, Wiedmann M (2008) Genome-wide analyses reveal lineage specific contributions of positive selection and recombination to the evolution of Listeria monocytogenes. BMC Evol Biol 8: 233.
54. Wirth T, Falush D, Lan R, Colles F, Mensa P, et al. (2006) Sex and virulence in Escherichia coli: an evolutionary perspective. Mol Microbiol 60: 1136–1151. 55. Lefebure T, Stanhope MJ (2007) Evolution of the core and pan-genome of
Streptococcus: positive selection, recombination, and genome composition. Genome Biol 8: R71.
56. Osborne SE, Tuinema BR, Mok MC, Lau PS, Bui NK, et al. (2012) Characterization of DalS, an ATP-binding cassette transporter for D-alanine, and its role in pathogenesis inSalmonella enterica. J Biol Chem.
57. Chang G (2003) Multidrug resistance ABC transporters. FEBS Lett 555: 102– 105.
58. Selander RK, Beltran P, Smith NH, Helmuth R, Rubin FA, et al. (1990) Evolutionary genetic relationships of clones ofSalmonellaserovars that cause human typhoid and other enteric fevers. Infect Immun 58: 2262–2275. 59. Didelot X, Maiden MC (2010) Impact of recombination on bacterial evolution.
Trends Microbiol 18: 315–322.
60. Porwollik S, editor (2011) Salmonella: from Genome to Function: Caister Academic Press. 153–157 p.
61. Brown EW, Kotewicz ML, Cebula TA (2002) Detection of recombination amongSalmonella entericastrains using the incongruence length difference test. Mol Phylogenet Evol 24: 102–120.
![Figure 1. Parsimony phylogenetic tree of S . Newport and outgroup genomes. This phylogenetic tree was reconstructed by TNT [38] with 100,000 iterations based on 147,780 genome wide SNPs](https://thumb-eu.123doks.com/thumbv2/123dok_br/17265497.246605/4.918.91.831.432.991/figure-parsimony-phylogenetic-newport-outgroup-phylogenetic-reconstructed-iterations.webp)
![Figure 3. Parsimony phylogenetic tree for cas genes. We constructed this parsimony tree with 100,000 iterations by TNT [38] based on concatenated sequences of the cas genes](https://thumb-eu.123doks.com/thumbv2/123dok_br/17265497.246605/9.918.93.822.93.718/figure-parsimony-phylogenetic-constructed-parsimony-iterations-concatenated-sequences.webp)
