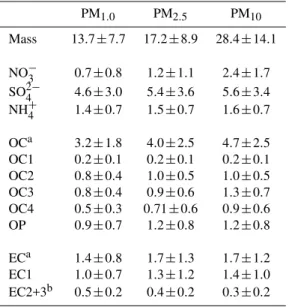
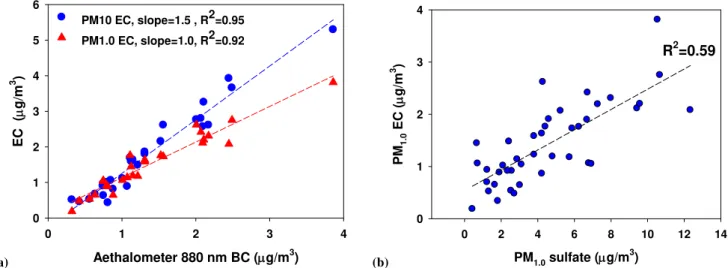
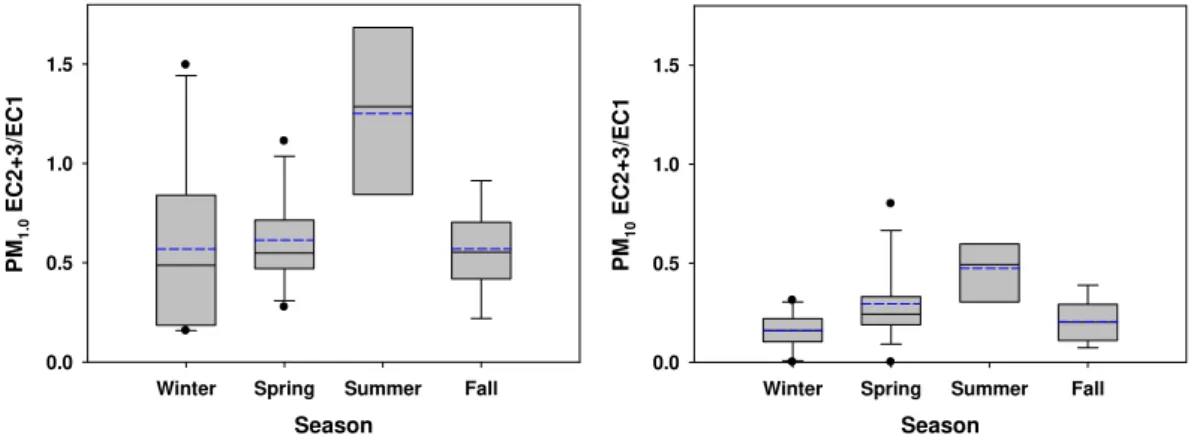
Ionic and carbonaceous compositions of PM<sub>10</sub>, PM<sub>2.5</sub> and PM<sub>1.0</sub> at Gosan ABC Superstation and their ratios as source signature
Texto
Imagem


Documentos relacionados
In this paper we report the first direct measurements of the reactive uptake coefficient of N2O5 onto submicron aerosols of NaCl and natural sea salt, using an aerosol flow
Thus, PM levels measured on the platforms in the Barcelona metro in July 2011 are also in the lowest range reported for metro systems worldwide (Fig. 8 and Table 5) in the case of
Average relative contribution of inorganic water soluble species to the total PM 10 mass measured by the MARGA during 2012 as a function of total mass concentration. The black line
Aerosols at these sites are shown to reflect dust, biomass burning and anthropogenic sources from Europe, South, East and CA, and Russia depending on the time period.... Kulkarni
Triangle plots (a) for day and nighttime source region plumes and (b) for source region averages and for indentified organic groups, i.e., LV-OOA, SV-OOA, OOA and BBOA. The dotted
Time series of daily contributions from each identified source, including soil dust, coal combustion, biomass burning, traf- fic and waste incineration emission, industrial
All of these conditions above made the aerosol pollution in Shiji- azhuang become worrying, and the annual concentrations of secondary inorganic ions, OC, EC, and most crustal
At these sites, about 30% of measured organic carbon was found in the coarse mode and was to a certain level attributed to primary biogenic organic aerosol (Puxbaum et al., 2003),


