3 http://mjbs.num.edu.mn
http://biotaxa.org./mjbs Volume 14(1-2), 2016
Mongolian Journal of Biological
Sciences
ISSN 2225-4994 (online edition)
MJBS
Original Ar• cle
http://dx.doi.org/10.22353/mjbs.2016.14.01
Yearly Diff erence in Normalized Seed Weight of Cultivated
Iris dichotoma
Pall. in Mongolia
Narantsetseg Amartuvshin and Nanjidsuren Ochgerel
Institute of General and Experimental Biology, MAS, Jukov Avenue 77, Ulaanbaatar-51, Mongolia, e-mail: [email protected]
Abstract
Maximum of mean seed weight was observed at 1997 while normalized seed weight was signifi cantly higher at 1982 and 1995, compared with other years. Seed weight variation is positively correlated with mean seed weight for earlier rainy season years, excluding later rainy season years (1982 and 1995). Low and high seed weight variation associated for years with colder and wetter in May and with hotter and drier in May, suggesting drought in May might be eff ective on seed weight variation of I. dichotoma. Moderate normalized seed weight associated for years with hotter in June, while high and low normalized seed weight for years with cooler and cool in June, suggesting I. dichotoma might use both photosynthetic productions and under-ground-storage for seed maturity. Mean seed weight and seed weight variation were linked to precipitation amount, whereas normalized seed weight was linked to precipitation periodicity. Seed weight variation detected delay of regrowth, caused by early drought, while normalized seed weight suggested seed weight response to complete seed maturation after droughty season, using photosynthetic productions and under-ground-storage. The results suggest that normalized seed weight might be useful to recognize seed weight response of I. dichotoma for climatic factors, better than mean seed weight and seed weight variation.
Amartuvshin, N. & Ochgerel, N. 2016. Yearly diff erence in normalized seed weight of cultivated Iris dichotoma Pall. in Mongolia. Mong. J. Biol. Sci., 14(1-2): 3-11. Keyword: cultivation,
Iris dichotoma,
normalized seed weight, drought.
Article information: Received: 07 Apr. 2016 Accepted: 10 Nov. 2016 Published online: 14 Nov. 2016
Correspondence:
amartuvshin@botany. mas.ac.mn
Cite this paper as:
Introduction
Evolution of seed weight is governed by climatic factors (Zhang, 1998; Moles et al., 2005; Liu et al., 2014), and evaluated by spatial and temporal diff erences. Present study considers on temporal diff erences of seed weight. Aniszewski et al. (2001) found diff erent groups of seed weight during the 10 years experiment, suggesting selection pressure. Radic et al. (2013) reported that seed weight of sunfl ower has signifi cantly diff erences between years, and these diff erences are found with observed sterile lines and with restorer lines. Manalo et al. (1998) suggested that seed weight variation due to the diff erence in the climatic condition of the years was greater in non-nodulating lines than
nodulating cultivars.
and its morphology and seed number per capsule were documented, but seed weight and its ecological factors are still unclear.
The purpose of this study was to describe whether mean seed weight or seed weight variation or normalized seed weight of cultivated
Iris dichotoma diff erentially respond to climatic factors.
Material and Method
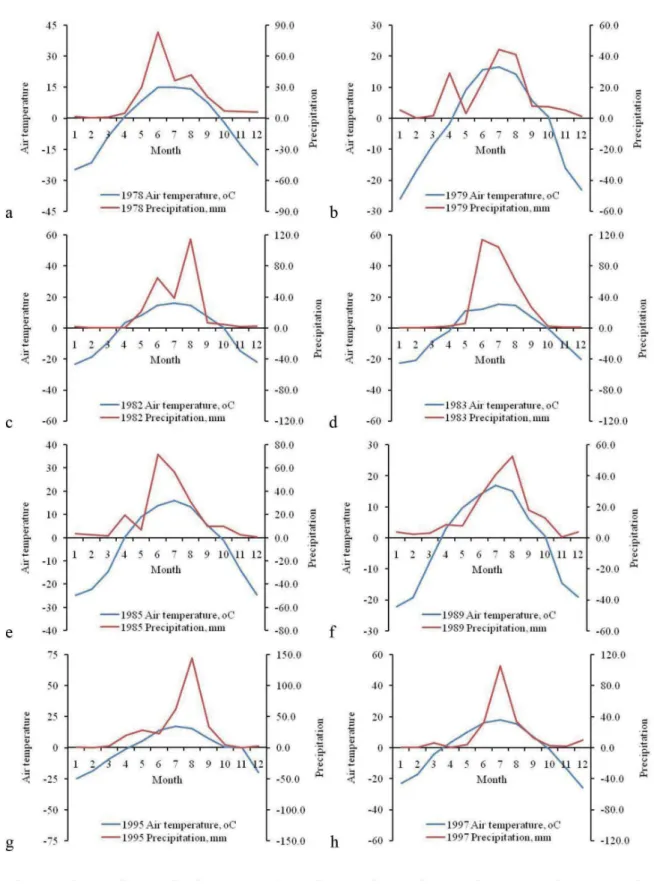
Drought is one of limiting factors for plant growth. Climate data was supported by database of Institute of Meteorology and Hydrology (from 1978 to 1997). According to climate diagrams (Walter & Lieth, 1960), in the Botanical Garden, drought was not observed in 1978 (Fig. 1a.) while it was observed in both spring and autumn in 1979 and 1982 (Fig. 1b, c.). In other years, drought was observed in April, May and June (Fig. 1d-h.). Annual air temperature increased from 1978 to 1997, excluding 1985 which was the coldest. Between 1978 and 1983, annual air temperature (T) was less than -2.0oC, while
between 1989 and 1997 that was more than -1.0oC. Annual sum precipitation (PP) was PP <
200 mm at 1979 and 1989, and 200 < PP < 300 at 1978, 1982, 1985 and 1997 and PP > 300 at 1983 and 1995. I. dichotoma start to grow in May (Enkhtuya, 2009). Hence, we used air temperature and precipitation amounts in May, June and July of each year for analysis. Hotter and drier condition in May found at 1979, 1983-1989 and 1997, but that condition did not found at 1978, 1982 and 1995. Also, hotter and driercondition in June found at 1979, 1989 and 1995, but did not observed for other years. Hotter and drier condition did not found in July for all years.
In 1975, I. dichotoma were cultivated by
was less than 3.0%, indicating seed weight was correctly measured. Hence, to calculate weight variation in each seed sample, we used discrimination between maximum and minimum weights. To calculate normalized seed weight (NSW), mean seed weight (MSW) was divided into seed weight variation (SWV).
where Wmax and Wmin represent the maximum and minimum weight of a replicate within a sample, respectively.
Tukey’s Host-Hoc test was used to detect yearly diff erences of mean seed weight, seed weight variation and normalized seed weight. Also, correlation between two variables was used to calculate correlation between mean seed weight and seed weight variation. Correspondences of mean seed weight, seed weight variation and normalized seed weight with air temperature and precipitation amounts in May, June and July were calculated as one-way ANOVA.
Results
Fig. 1. Climate diagram in the Botanical Garden, Institute of General and Experimental Biology, Mongolian Academy of Sciences, during study years.
of normalized seed weight show that peak of precipitation amount was in August at 1982 and 1995.
Seed weight variation is positively correlated with mean seed weight for earlier rainy season
1995, those were from 257 mm to 318 mm and from -1.3oC to 2.0oC. The results indicated that correlation between seed weight variation and mean seed weight could not associate to annual sum precipitation and annual air temperature. Maximum air temperature within year was occurred in July for all years, suggesting correlation between seed weight variation and mean seed weight did not associate to maximum air temperature. For earlier rainy season years, peak of precipitation amount was in June and July, but for later rainy season years (1982 and 1995), it was in August.
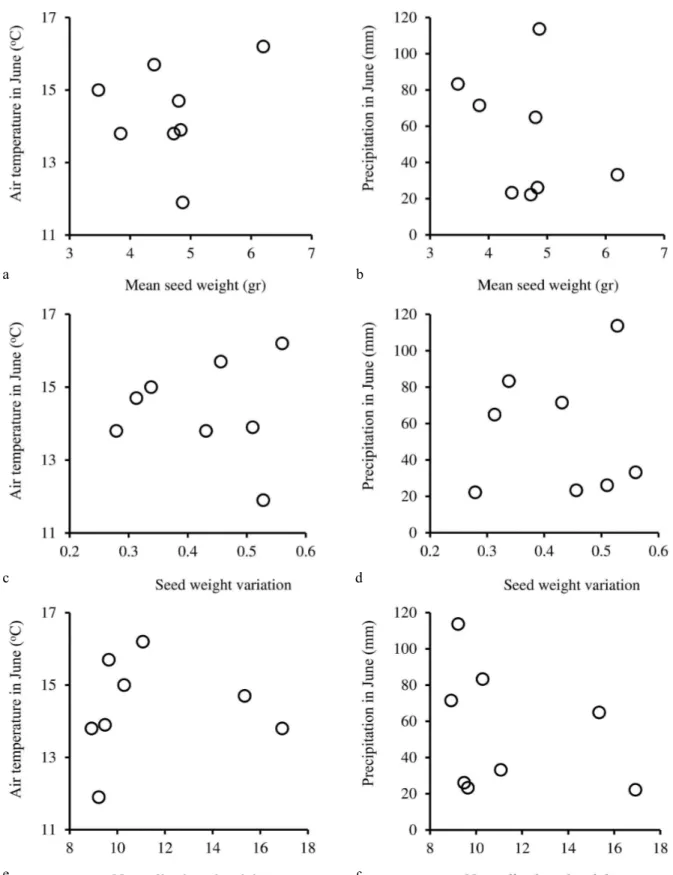
Our results show mean seed weight and normalized seed weight of cultivated I. dichotoma did not correspond with climatic variables in May, such as air temperature and precipitation amount (Fig. 4a, b and 4e, f.) but seed weight variation signifi cantly corresponded
with air temperature and precipitation amount in May (Fig. 4c, d.). Colder and wetter climate was found in May at 1978, 1982 and 1995, whereas hotter and drier ones found for other years. Low and high seed weight variation associated for years with colder and wetter in May and with hotter and drier in May, suggesting drought in May might be eff ective on seed weight variation of I. dichotoma.
One-way ANOVA analysis showed that mean seed weight was insignifi cantly corresponded with air temperature and precipitation in June (Fig. 5a, b.). Also, seed weight variation showed same results (Fig. 5c, d.). Normalized seed weight signifi cantly corresponded with air temperature in June, but insignifi cant with precipitation amount (Fig. 5e, f.). Moderate normalized seed weight (between 9.6 and 11.1) associated for years with hotter in June (more than 15oC) while high (more than 15) and low normalized seed weight (less than 9.5) for years with cooler (between 14oC and 15oC), and cool (less than 14oC) in June. All seed weight variables of cultivated I. dichotoma did not correspond with air temperature and precipitation amount in July (Fig. 6a-f.).
Discussion
Researchers suggested that mean seed weight is diff erent between years, resulting in diff erence of annual sum precipitation (Meyer, 1997; Busso & Perryman, 2005). Also, seed weight Fig. 2.Yearly diff erence of mean seed weight (a),
seed weight variation (b) and normalized seed weight (c) of I. dichotoma which cultivated in the Botanical Garden in Mongolia (Tukey’s Post-Hoc Test, P < 0.05).
b
c
Fig. 4. Correspondence between mean seed weight (a, b), seed weight variation (c, d) and normalized seed weight (e, f) of cultivated I. dichotoma with air temperature and precipitation in May. Mean seed weight and air temperature in May (ANOVA, df = 1, SS = 1.41, MS = 1.41, F = 0.46, P = 0.522); mean seed weight and precipitation in May (ANOVA, df = 1, SS = 101.52, MS = 101.52, F = 0.78, P = 0.412); seed weight variation and air temperature in May (ANOVA, df = 1, SS = 12.1, MS = 12.1, F = 9.46, P = 0.022); seed weight variation and precipitation in May (ANOVA, df = 1, SS = 824.78, MS = 824.78, F = 82.7, P < 0.0001); normalized seed weight and air temperature in May (ANOVA, df = 2, SS = 12.99, MS = 6.49, F = 4.79, P = 0.069); normalized seed weight and precipitation in May (ANOVA, df = 2, SS = 388.5, MS = 194.25, F = 1.96, P = 0.235).
a
b
c
d
Fig. 5. Correspondence between mean seed weight (a, b), seed weight variation (c, d) and normalized seed weight (e, f) of cultivated I. dichotoma with air temperature and precipitation in June. Mean seed weight and air temperature in June (ANOVA, df = 1, SS = 3.81, MS = 3.81, F = 2.59, P = 0.158); mean seed weight and precipitation in June (ANOVA, df = 1, SS = 531.98, MS = 531.98, F = 0.43, P = 0.537); seed weight variation and air temperature in June (ANOVA, df = 1, SS = 0.07, MS = 0.07, F = 0.04, P = 0.856); seed weight variation and precipitation in June (ANOVA, df = 1, SS = 19.68, MS = 19.68, F = 0.015, P = 0.907); normalized seed weight and air temperature in June (ANOVA, df = 2, SS = 8.92, MS = 4.46, F = 6.07, P = 0.045); normalized seed weight and precipitation in June (ANOVA, df = 2, SS = 1188.04, MS = 594.02, F = 0.43, P = 0.669).
a b
c d
Fig. 6. Correspondence between mean seed weight (a, b), seed weight variation (c, d) and normalized seed weight (e, f) of cultivated I. dichotoma with air temperature and precipitation in July. Mean seed weight and air temperature in July (ANOVA, df = 1, SS = 2.53, MS = 2.53, F = 3.63, P = 0.105); mean seed weight and precipitation in July (ANOVA, df = 1, SS = 2278.43, MS = 2278.43, F = 4.01, P = 0.092); seed weight variation and air temperature in July (ANOVA, df = 1, SS = 0.29, MS = 0.29, F = 0.27, P = 0.621); seed weight variation and precipitation in July (ANOVA, df = 1, SS = 1155.68, MS = 1155.68, F = 1.53, P = 0.262); normalized seed weight and air temperature in July (ANOVA, df = 2, SS = 0.54, MS = 0.27, F = 0.22, P = 0.809); normalized seed weight and precipitation in July (ANOVA, df = 2, SS = 354.49, MS = 177.24, F = 0.17, P = 0.851).
a b
c d
of mean seed weight is related with selection pressure, but our result showed that yearly diff erences of mean seed weight could indicate the eff ectiveness of precipitation amount in July on seed weight of cultivated I. dichotoma.
Monthly precipitation amount (March-November) explained 85% of total variation of mean seed weight in Artemisia tridentate (Busso & Perryman, 2005). Our results showed insignifi cant correspondences of mean seed weight of I. dichotoma with air temperature and precipitation amounts in May, June and July. But, seed weight variation signifi cantly corresponded with air temperature and precipitation amount in May. These correspondences suggested that drought condition in May might delay vegetative growth of this species and decrease seed weight and increase seed weight variation. It means that cultivated I. dichotoma was stressed as drought in May and might decrease seed weight as reported by Jørgensen et al. (2011) on Vigna subterranean.
Zhang (1998) reported that populations that had higher mean seed weight also had larger maximum and minimum seed weights and early fl owering populations produced larger seeds than those that fl owered later in the growing season. The correlation between seed weight variation and mean seed weight in cultivated I. dichotoma showed that earlier peak of precipitation might aff ect on both seed weight variation and mean seed weight, whereas later peak of precipitation aff ect on mean seed weight. In natural populations, normalized seed weight could be related with precipitation, climatic aridity (Narantsetseg, 2015). Present results show that normalized seed weight of cultivated I. dichotoma signifi cantly corresponded with air temperature, but not with precipitation amount, because of continuous irrigation.
normalized seed weight. Herbaceous plants keep storage in under-ground-biomass to survive adverse conditions and I. dichotoma is rhizomatous species (Enkhtuya, 2009). Hence, I. dichotoma might use both photosynthetic productions and under-ground-storage for seed maturity within short duration, and it call higher mean seed weight, but unchanged and/or lower seed weight variation and high normalized seed weight.
Busso and Perryman (2005) emphasized the importance of amount and periodicity of precipitation as a major determinant of seed size. Correspondence of mean seed weight and seed weight variation with annual sum precipitation indicated that those were linked to precipitation amount. However, correspondence of normalized seed weight with annual sum precipitation suggests that it was linked to precipitation periodicity. Seed weight variation detected delay of regrowth caused by early drought, while normalized seed weight suggested seed weight response to complete seed maturation after droughty season using both photosynthetic productions and under-ground-storage.
The results suggest that normalized seed weight might be useful to recognize seed weight response of I. dichotoma to climatic factors, better than mean seed weight and seed weight variation.
References
Aniszewski, T., Kupari, M. H. & Leinonen, A. 2001. Seed number, seed size and seed diversity in Washington lupin (Lupinus polyphyllus Lindl.). Annals of Botany, 87: 77–82.
Northern Nevada. Biocell, 29(3): 279–285. Enkhtuya, L. 2009. Irises. (Iris L.). “Bembi san”
Press, Ulaanbaatar, Mongolia. (in Mongolian) Enkhtuya, L. & Tserenkhand, G. 2000.
Comparative study of anatomy leaves of some Iris spesies. Central Asian Ecosystems. Pp. 147.
Erdenejav, G. 1987. Iris dichotoma Pall. In Mongolia Red Listed Book. National Press, Ulaanbaatar, Mongolia, pp. 122–123.(in Mongolian)
Fatokun, C. A., Menancio-Hautea, D. I., Danesh, D. & Young, N. D. 1992. Evidence for orthologous seed weight genes in Cowpea and Mung bean based on RFLP mapping. Genetics, 132: 841–846.
Giroux, M. J., Shaw, J., Barry, G., Cobb, B. G., Greene, T., Okita, T. & Curtis Hannah, L. 1996. A single gene mutation that increases maize seed weight. Proceedings of the National Academy of Sciences of the United States of America, 93: 5824–5829.
Javzan, S. 2001. The results and advances of plant propagation.“Orgil” Press, Ulaanbaatar, Mongolia. (in Mongolian)
Jørgensen, S.T., Ntundu, W.H., Ouedraogo, M., Christiansen, J.L. & Liu, F. 2011. Eff ect of a short and severe intermittent drought on transpiration, seed yield, yield components, and harvest index in four landraces of bambara groundnut. International Journal of Plant Production, 5(1): 25–36.
Konarzewski, T. K., Murray, B. R. & Godfree, R. C. 2012. Rapid development of adaptive, climate-driven clinal variation in seed mass in the invasive annual forb Echium plantagineum L. PLoS ONE, 7(12): e49000. doi:10.1371.
Liu, H. L., Zhang, D. Y., Duan, S. M., Wang, X. Y. & Song, M. F. 2014. The relationship between diaspore characteristics with phylogeny, life history traits, and their ecological adaptation of 150 species from the cold desert of northwest China. The Scientifi c World Journal, ttp://dx.doi. org/10.1155/2014/510343.
Manalo, D. D., Sawada, S., Miura, H. & Kato, K. 1998. Seed weight of nodulating and non-nodulating soybeans at diff erent nitrogen levels and years. Plant Production Science, 1(4): 264–268.
Meyer, S. E. 1997. Ecological correlates of achene mass variation in Chrysothamnus nauseosus (Asteraceae). American Journal of Botany, 84(4): 471–477.
Moles, A. T., Ackerly, D. D., Webb, C. O., Tweddle, J. C., Dickie, J. B., Pitman, A. J. & Westoby, M. 2005. Factors that shape seed mass evolution. Proceedings of the National Academy of Sciences of the United States of America, 102(30): 10540–10544.
Myadag, Ts. 1987. Research on peony
propagation in Mongolia. Proceedings
of Institute of Botany, 9: 137–146. (in Mongolian)
Narantsetseg A. 2015. Normalized Seed Weight of Three Species of the Genus Peganum L. (Peganaceae Van Tieghem) in Mongolia.
Mongolian Journal of Biological Sciences, 13(1-2): 43–53.
Radic, V., Mrda, J., Jockovic, M., Canak, P., Dimitrijevic, A. & Jocic, S. 2013. Sunfl ower 1000-seed weight as aff ected by year and genotype. Ratarstvo i povrtarstvo, 50(1): 1–7. Teng, W., Han, Y., Du, Y., Sun, D., Zhang, Z.,
Qiu, L., Sun, G. & Li, W. 2009. QTL analyses of seed weight during the development of soybean (Glycine max L. Merr.). Heredity, 102: 372–380.
Tsooj, Sh. 2013. Dominant plant photosynthesis in natural zones of Mongolia. “Bembi San” Press, Ulaanbaatar, Mongolia. (full-text in Mongolian; summary in English)
Walter, H & Lieth, H. 1960. Klimadiagramm Weltatlas. Fischer Verlag, Jena, 1: 3–9.
Wirginia, K. K., Elwira, S., Jaroslaw ,W., Otgonbataar, U., Pawel, G & Krystina S. W. 2015. Major secondary metabolites of Iris
spp. Phytochemistry Reviews. 14(1): 51–80. Zhang, J. 1998. Variation and allometry of seed
weight in Aeschynomene americana. Annals of Botany, 82: 843–847.