!"#$%&"%
8
RESEARCH ARTICLE
Adsorption of Reactive Blue 171 from Aqueous Solution using Low Cost Activated
Carbon Prepared from Agricultural Solid Waste:
K. Anitha(*,A) , P. S. Syed Shabudeen(B), S. Karthikeyan(C), N.Aruna devi(D)
(A)Department of Chemistry, A. P. A. College for Women, Palani, TN, India.
(B) Department of Chemistry, Kumaraguru College of Technology, Coimbatore, TN, India. (C) Department of Chemistry, ChikkannaGovernment Arts College, Tirupur, TN, India.
(D) Department of Chemistry,P.S.G.R.Krishnammal College For Women,Coimbatore,TN,India.
Abstract: The adsorption of Reactive Blue 171 (Reactive Dye) from aqueous solution using
activated carbon prepared from ' ( pod shell waste as an adsorbent have been carried out. The experimental adsorption data fitted reasonably well to Langmuir and Freundlich adsorption isotherms. Kinetic parameters as a function of Initial dye concentration have been calculated and the kinetic data were substituted in Pseudo First Order, Elovich and Pseudo Second order equations. A probable explanation is offered to account for the results of kinetic study. The thermodynamic parameter enthalpy change (∆H) suggests the exothermic nature of absorption of Reactive Blue 171 onto activated ' ( pod shell waste carbon.
Keywords: Activated Albizia amara pod shell waste carbon, adsorption, Reactive Blue 171.
1. INTRODUCTION: Environmental threats posed by reactive dyes to the quality of water is alarming throughout the world.Especially in Tamil Nadu, number of dyeing factories located in and around Erode and Tirupur region let out harmful dyes into the water bodies at an alarming rate. This leads to a serious environmental concern in this zone of Southern India. Adsorption of dyes using activated carbon is an effective method adapted in the treatment of hazardous dye wastes. But using a commercially available activated carbon for this purpose is economically unviable. The reason being that the regeneration and reactivation processes to be followed in case of a commercially available activated carbon are unteanable. The gradual loss of activated carbon during regeneration can materially affect the economic viability of the process [1]. The use of highly structured and robust activated carbons based on expensive, starting materials is unjustified [2]. Therefore, other sources of materials for activated carbons are explored. Cellulosic and lignocelluloses wastes have long been recognized as starting materials for the preparation of activated carbon [3, 4]. Agricultural by products and waste materials are used for the production of activated carbons [5] such as as palm ash and chitosan/oil palm ash [6, 7], pomelo ( ) * ) peel[8], sunflower seed hull[9], oil palm trunk fibre [10], durian peel[11]and rice straw derived char [12], biomass fly ash[13], dried biomass of Baker's yeast[14], water hyacinth
[15] Jatropha Curcas stem [16], Cashew nut sheath [17] for the removal of dyes from its aqueous solutions. The chemical and physical factors that play an important role in the adsorption of solutes by activated carbons are: molecular structure of the solute, surface chemistry of the activated carbon and solution chemistry. Typical water treatment conditions at neutral pH values, for enhanced uptake of solutes from the solution, the electrostatic forces between the carbon surface and solute macromolecules should be maximized. In order to increase the extent of solute adsorption, the affinity of carbon surface
ISSN 0974 – 0546
!"#$%&"%
9
toward solute molecules must be enhanced. From a physical interactive perspective, it is important to have a good compatibility between the size distributions of activated carbon pores and solution. Comparison of size information available for commercial activated carbon pores and solute molecules in natural waters suggest that some fractions of solute will not be able to access finer carbon pores [18, 19]. Therefore, they will be prevented from fully employing the large surface area (and pore volume) available for absorption. In the present investigation, the adsorption of Reactive Blue 171 on to Activated carbon prepared from ' ( pod shell waste by carbonization with phosphoric acid has been achieved. The kinetic and equilibrium adsorption data obtained were utilized to characterize the sample prepared.
2. EXPERIMENTAL TECHNIQUE
2.1 Preparation Of Adsorbent: ' ( pod shell waste is collected from local area of Erode
district, Tamil Nadu, India. The dried waste material mixed with excess phosphoric acid, charring of the material occurred immediately accompanied by the evolution of heat and fumes. When the reaction subsided, the mixture was left in an air oven maintained at 80 90 °C for a period of 24 hours. At the end of 24 hours the product was washed with large volume of water to remove free acid and socked with excess of 10 percent sodium bicarbonate solution for a period of 6 hrs. After 6 hrs, the liquid portion is decanted off and the material was dried at 110 °C and finally activated at 800 °C for 20 minutes [20]. The batch adsorption studies were performed at 30 °C. 100 mg of adsorbent is mixed with known initial concentration (Viz. 20 ppm, 40 ppm and 60 ppm) of Reactive Blue 171 solution and agitated. The adsorbent and the adsorbate were separated by filtration and the filtrate was analyzed for residual Reactive Blue 171 concentration spectrophometrically using Double beam UV spectro photometer (Elico model BL198).
Kinetic Models: In order to investigate the mechanisum of sorption and potential controlling steps such as mass transport, several kinetic models were tested including the pseudo first order kinetic model, the Elovich model and the pseudo second order kinetic model for a batch contact time process, where the rate of sorption of dye on to the given adsorbent is proportional to the amount of dye sorbed from the solution phase
Pseudo First Order Model: The first order kinetic equation [21] may be expressed as
log (+ − + )= log +
303 . 2
* ,
t ( 1 )
where
+ = The amount of dye adsorbed at equilibrium, mg/g + = The amount of dye adsorbed at equilibrium, mg/g
*
, = The rate constant for pseudo first order adsorption, l / min.
The values of log (+ −+ ) were linearly correlated with t. The plot of log (+ −+ )versus t should give
a linear relationship from which , * and + can be determined from the slope and intercept of the plot,
respectively.
Elovich Model: The Elovich or Roginsky Zeldovich equation is generally expressed as follows [22].
)
exp( +
+
β
α −
= ( 2 )
where
!"#$%&"%
10 α = the intialdye sorption rate, mg/g min
β = the desorption constant, g/mg, during any one experiment
To simplify the Elovich equation, Chien and Clajton [23] assumed αβt>>l, and on applying the boundary conditions qt =o at t = o and qt = qt at t = t, the above equation :
qt = β ln(α β ) + β lnt ( 3 )
This the constants can be obtained from the slope and intercept of the linear plot of qt versus ln t .
The above equation will be used to test the applicability of the Elovich equation to the kinetics of chosen adsorbent adsorbate system.
Pseudo Second Order Model: To describe dye adsorption, the modified pseudo second order kinetic equation is expressed as [24].
2 2(+ + ) ,
+
−
= ( 4 )
where
+ = The amount of dye adsorbed at equilibrium, mg/g
+ = The amount of dye adsorbed at time t, mg/g
k2= The rate constant for pseudo first order adsorption, g/mg.min.
For the boundary conditions t = 0 to t = 1 and + = 0 + = + ,the integrated from of equation obtained is , + + + 2 1 ) ( 1 + =
− ( 5 )
Rearranging the terms in the above equation we get
+ + , + 1 1 2 2 +
= ( 6 )
which is the integrated rate law for a pseudo second order reaction. This has a linear form is given as below : + + , + 1 / 2 2 +
= ( 7 )
In the limit (+ / )→0,the initial sorption rate, h, is given by ,2+ 2, mg /g min. This, a plot /+ versus
t of the above equation should give a linear relationship with a slop of 1/+ and an intercept of 2
2
1
+
, .
Isotherm Models:
Langmuir Isotherm: The Langmuir model was developed based on the assumption of the formation of
!"#$%&"%
11
efficiency of the adsorbent. This study is also useful in optimizing the operating conditions for effective adsorption. In this respect, the Langmuir isotherm is important, though the restrictions and the limitations of this model have been well recognized.
The Langmuir and the rearranged Langmuir equations are given below.
1/qe = 1/Qob . 1//Ce + 1/Qo ( 8 )
Ce/qe = Ce/Qo + 1/Qob ( 9 ) where,
qe = The amount of dye removed at equilibrium, mg/g. Ce = The equilibrium concentration of dye, mg/l.
Qo = The Langmuir constant, related to the adsorption capacity, mg/g and b = The Langmuir constant, related to the energy of adsorption, L/mg.
The essential characteristics of Langmuir isotherm can be expressed in terms of dimension less constant separate ion factor or equlibrium parameter, RL which is defined by RL = 1 / 1+ b C0 , where C0 is the initial dye concentration (mg/L) and b is the Langmuir constant (l/mg). The parameter indicates the shape of isotherm as follows;
RL Value Type of Isotherm RL >1 Unfavourable RL=1 Linear
0<RL<1 Favourable RL=0 Irreversible
Freundlich Isotherm: The linear from of Freundlich equation [25] is represented as
log x/m = log kf + 1/n log Ce ( 10 )
where ‘x’ is the amount of Reactive Blue 171 adsorbed in mg. ‘m’ is the weight of adsorbent (g) Ce is the residual concentration of Reactive Blue 171 at equilibrium in mg.
kf and 1/n are Freundlich constants related to the adsorption capacity and adsorption intensity respectively and are evaluated by least square fitting of the data by plotting log x/m vs log Ce with a slope of 1/n and intercept of log Kf.
Adsorption Thermodynamics: Any chemical system tends to attain a state of equilibrium from one of
non equilibrium. The thermodynamic parameters, which characterize the equilibrium of a system are the Gibbs free energy change ∆G, the enthalpy change ∆H and the entropy change ∆S. These parameters were determined using the following relations [26].
kL = Q0b (11) G = RT ln kL (12) log kL = ∆S / 2.303 R ∆H / 2.303 RT (13)
!"#$%&"%
12 3. RESULTS AND DISCUSSION
Surface characters of activated carbon: The morphology of the surface of the prepared activated
carbon sample by various processes were examined using Scanning Electron Micrographs. These images provide positive reception of the porosity of adsorbents and consequently their ability to adsorb the dye molecules in solution. ALAC has many pores, small cavities and rough areas with micro pores which were clearly found on the surface. This shows that Phosphoric acidtreatment created activated carbon with large surface area and porous structure.
Figure (1): SEM image of ' ( pod shell waste activated carbons prepared from various processes (a) H3PO4 process (b) H2SO4 process (c) K2CO3 process (d) Na2SO4 process (e) ZnCl2
process.
Effect of Agitation time:The uptake of Reactive Blue 171 from water by activated ' ( pod
!"#$%&"%
13
minutes and attains equilibrium in 140 minutes at 30 °C and at pH 7.0, when the initial concentration of the Reactive Blue 171 solution used was 20 ppm and the adsorbent dosage was 100 mg. The increase in adsorption of Reactive Blue 171 with increase in agitation time may be attributed to the increased intra particle diffusion occurring at long shaking time (Figure 4). A similar result observed by Rao and Bhole in the removal of Reactive Blue 171 by fly ash and bagasse [27].
The initial concentration of Reactive Blue 171 solution was varied (20, 40 and 60 ppm) and batch adsorption experiments were carried out with 100 mg. of the adsorbent at 30 °C and at pH ≈ 7.0. An increased percentage removal of Reactive Blue 171 from 75 to 94.75 % observed with 100 mg. of the adsorbent in agitation time of 160 minutes when the initial concentration of the Reactive Blue 171 solution was varied from 20, 40 and 60 ppm. The higher uptake of Reactive Blue 171 at low concentration may be attributed to the availability of more active centres on the surface of the adsorbent for lesser number of adsorbate species. Reactive Blue 171 adsorption curves are single, smooth and continuous (Figure 2) suggesting the possible monolayer coverage of dye molecules on the surface of the adsorbent. Mise and Rajamanya also reported a similar result in the removal of Cr(VI) using activated carbon from dried stem of Jowar [28].
Figure (2) : Effect of pH on dye removal efficiency
Kinetic Modeling:
Pseudo First Order:Figure (3) shows a plot of the Lagergren equation for the results of adsorption of
!"#$%&"%
14
Figure (3): Pseudo first order kinetic equation describing the Reactive Blue 171 dye adsorption onto ALAC
Elovich Model: The results of the sorption of Reactive Blue 171 onto ' ( pod has been
represented in the form of Elovich Equation in Figure (4) at various Initial dye concentrations(Viz. 20 ppm, 40 ppm, 60 ppm). From the plot a linear relationship between the amount of Reactive Blue 171 adsorbed, qt and ln(t) was established. These plots showed different distinct linear regions within individual sets of data. In these cases, it was thus necessary to perform multiple regressions on different ranges of the data. The kinetics could not be approximated using Elovich model.
Figure (4): Elovich Plot for the Reactive Blue 171 dye adsorption onto ALAC
Pseudo Second Order Model: The same data are shown as pseudo second order equations in Figure
!"#$%&"%
15
Reactive Blue 171 sorbed at any contact time increases. This is obvious for higher Initial Concentration values, as a more efficient utilization of the sorptive capacities of the sorbent would be expected due to greater sorption driving force.
Figure (5): Pseudo second order plot for Reactive Blue 171 dye adsorption onto ALAC
Table 1: Kinetic Model Values for the Adsorption of Reactive Blue 171 onto ' ( pod Activated Carbon at 30°C, 45°C, 60°C.
Temper ature
°C
Pseudo Firest
Order Values Elovich Values Pseudo Second Order Values
kLager x
10 >2 R
2
α β R2 qe k2x10>3 h R2
30 0.0402 0.9270 0.6268 0.3092 0.9692 16.0942 0.0153 3.9708 0.9811
45 0.0597 0.9078 0.4893 0.3713 0.9431 13.6887 0.0284 5.3200 0.9061
60 0.0582 0.9010 0.3970 0.3818 0.9303 17.0098 0.0264 7.6284 0.7761
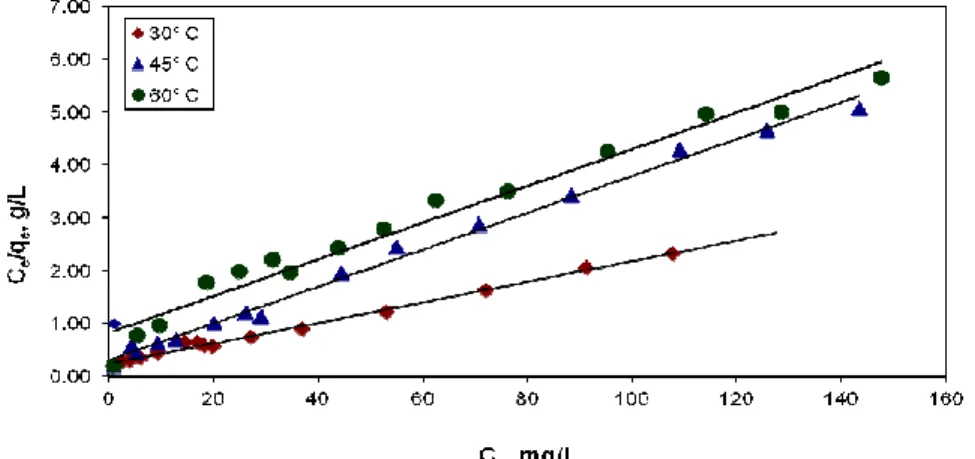
Isotherm Modeling: The Langmuir adsorption isotherm obtained in 160 minutes of agitation time is
!"#$%&"%
16
Figure (6) : Langmuir adsorption isotherm for the Reactive Blue 171 dye adsorption onto ALAC.
Figure (7): Freundlich Plot for the Reactive Blue 171 dye adsorption onto ALAC
From Table 2, the values of adsorption intensity 1/n << 1 reveals the applicability of this adsorption isotherm. The values of kf are given in the table 2. The study of temperature effects on the freundlich parameters reveals that decreasing trend in the adsorption capacity with increase in temperature. However, the variation in the adsorption intensity is negligible. These data are useful for practical design purposes
Table 2: Parameters of Langmuir and Freundlich Adsorption Isotherms for Reactive Blue 171 Adsorption Calculated for 160 Minutes of Agitation Time onto Activated ' ( pod Waste Carbon.
Temp.
° C
Langmuir Isotherm Freundlich Isotherm
b , L / mg
Qo, mg
/ g RL 1/n n kf
30 0.0895 42.3201 0.3584 0.3386 2.9533 13.4311
45 0.0405 46.8527 0.2183 0.3984 2.5100 6.0731
!"#$%&"%
17
Thermodynamic Parameters: ∆H and ∆S were obtained from the slope and intercept of Vant Hoff plot
(1/T vs ln Kc). Batch adsorption studies were carried out with Reactive Blue 171 solution at pH ≈ 6.0 and by varying the temperature (303 K, 318 K and 333 K). The initial concentration of Reactive Blue 171 solution used was maintained to be 20 ppm with 100mg of the adsorbent Table 3 gives the value of ∆G, ∆S and ∆H for the adsorption of Reactive Blue 171. The negative values of free energy change (∆G) indicate the feasibility and spontaneous nature of the adsorption of Reactive Blue 171 species [29]. The negative ∆H values of the process suggest the exothermic nature of adsorption of Reactive Blue 171 on to activated ' ( pod shell waste carbon. The negative value of ∆S is due to the lower degree of disorderness in the displane meet of adsorbed molecules [30].
Table 3 : Thermodynamic Parameters for the Adsorption of Reactive Blue 171 on to Activated ' ( Waste Carbon.
Temperature in Kelvin
∆G , J mole1
∆S , J mole1
∆H , J mole1
303 3355.0
1.2062
2.6231
318 1695.2
333 806.7
4. CONCLUSIONS:
In the present study adsorption of Reactive Blue 171 on activated ' ( pod shell waste carbon has been investigated. The data obtained through this work supports that the ' ( waste carbon is an effective low cost adsorbent for the removal of Reactive Blue 171 from aqueous solution. The adsorption of Reactive Blue 171 is dependent on the initial concentration and agitation time. Equilibrium of Reactive Blue 171 adsorption reaches at 160 min.
The pseudo first order and pseudo second order equations provide a best fit description for the sorption of Reactive Blue 171 on to Albizia amara relative to Elovich model, but the Pseudo second order correlation coefficient has better correlation coefficient value than pseudo first order equation. Pseudo second order was considered the most appropriate due to high correlation coefficient when compared to pseudo second order equation.
Langmuir and Freundlich adsorption isotherm correlate the equilibrium adsorption data. The adsorption of Reactive Blue 171 onto activated Albizia amara waste carbon is an exothermic reaction based on Enthalpy change values.
REFERENCES:
[1] S. Karthikeyan and C. Sumithra, J. Environ. Nanotechnol. 3 (2014) 23 29.
[2] P. Brian, N. O. Kelleheri Marguerite, Callaghan, Martin J Leahy., F. O. Thomas, J. J. Dwyer, and Leahy, J. Chem. Technol. Biotechnol. 77 (2002) 1212 1218.
[3] J. C. Dean, F. L. Bosqui, K. M. Lanovette, Environ. Sci. Technol. 6 (1972) 518.
!"#$%&"%
18
[7] M. Hasan, A. L. Ahmad, and B. H. Hameed, Chem. Eng. J. 136 (2008) 164 172.
[8] B. H. Hameed, D. K. Mahmoud, A. L. Ahmad, Colloids Surf. A: Physicochem. Eng. Aspects 316 (2008) 78 84.
[9] B. H. Hameed, J. Hazard. Mater. 154 (2008) 204 212.
[10] B. H. Hameed and M. I. El Khaiary, J. Hazard. Mater. 154 (2008) 237 244. [11] B. H. Hameed and H. Hakimi, Biochem. Eng. J. 39 (2008) 338 343.
[12] B. H. Hameed and M. I. El Khaiary, J. Hazard. Mater. 153 (2008) 701 708.
[13] P. Pengthamkeerati, T. Satapanajaru and O. Singchan, J. Hazard. Mater. 153 (2008) 1149 1156. [14] J. Y. Farah, N. Sh. El Gendy and L. A. Farahat, J. Hazard. Mater. 148 (2007) 402 408.
[15] M. I. El Khaiary, J. Hazard. Mater. 147 (2007) 28 36.
[16] K. Sakthivel, I. Arockiaraj, C. Kannan, and S. Karthikeyan, J. Environ. Nanotechnol. 2/2 (2013) 66.
[17] Q. Mortley, W. A. Mellowes, and S. Thomas, Termochim. Acta. 129 (1988) 173.
[18] P. B. Nagarnaik, A. G. Bhole and G. S. Natarajan, Ind.Journal Environ. Health 45 (2003) 1 4. [19] C. Namasivayam and R. T. Yamuna, Water, Air and Soil pollution 113 (1999) 371 384.
[20] S. Karthikeyan, P. Shanthi, A. Saravanan and K. Saranya, J. Environ. Nanotechnol. 3 (2014) 88 100.
[21] S. Lagergren, Hand linger 24 ( 898) 1 39.
[22] K. S. Low, C. K. Lee and A. Y. Ng, Bioresou. Technol 65 (1999) 205 208. [23] S. H. Chien and W. R. Clayton, Soil Sci. Soc. Am. J. 44 (1980) 265 268 . [24] Y. S. Ho and G.Mcay, Adsorp. Sci. Technol 18 (2000) 639 –650.
[25] N. Sumanjit and N. Prasad, Indian Journal of Chemistry 40A (2001) 388 391.
[26] N. Stephen Inbaraj and N.Sulochana, Indian Journal of Chemical Technology 9 (2002) 201 208. [27] M. Rao and A. G. Bhole, Journal of Indian Water Works Association 97 (2001) 997 1000.
[28] R. Shashikant, Mise and V. S .Rajamanya, Indian Journal Environmental Health 45 (2003) 49 58. [29] K. Vinod, T. Gupta, T. Dinesh Mohan, T. Saurabh Sharma, T. Kuk, T. Park, The
Environmentalist 19 (1999) 129 136.
[30] A. Krishnamoorthy, Joseph C. Juliet, Ind. J. Chem. 43A (2004) 45 50. *****