Submitted23 June 2016 Accepted 1 September 2016 Published27 September 2016
Corresponding author Ignacio Ribera,
Academic editor Marta Riutort
Additional Information and Declarations can be found on page 19
DOI10.7717/peerj.2514
Copyright
2016 García-Vázquez and Ribera
Distributed under
Creative Commons CC-BY 4.0
OPEN ACCESS
The origin of widespread species in a
poor dispersing lineage (diving beetle
genus
Deronectes
)
David García-Vázquez and Ignacio Ribera
Institute of Evolutionary Biology (CSIC-Universitat Pompeu Fabra), Barcelona, Spain
ABSTRACT
In most lineages, most species have restricted geographic ranges, with only few reaching widespread distributions. How these widespread species reached their current ranges is an intriguing biogeographic and evolutionary question, especially in groups known to be poor dispersers. We reconstructed the biogeographic and temporal origin of the widespread species in a lineage with particularly poor dispersal capabilities, the diving beetle genusDeronectes(Dytiscidae). Most of the ca. 60 described species ofDeronectes
SubjectsBiodiversity, Biogeography, Entomology, Evolutionary Studies, Zoology
Keywords Dispersion, Glacial refugia, Mediterranean peninsulas, Range expansion, Pleistocene
glaciations
INTRODUCTION
The geographic range of the species is a fundamental trait in ecology and biogeography (Brown & Lomolino, 1998). There have been many hypotheses put forward by ecologists, biogeographers or evolutionary biologists to explain geographic ranges (see e.g.,Brown, 1995 or Gaston, 2003 for reviews), such as differences in niche breadth, body size, population abundance, environmental variability, colonization and extinction dynamics, and dispersal ability among others (Stevens, 1989;Brown, 1995;Gaston, 2003), but there is still a lack of understanding of the evolutionary dynamics of geographical ranges. Thus, although the ecological and biogeographic context in which species evolve are known to determine their range sizes (Böhning-Gaese et al., 2006), there are multiple cases of closely related species, sharing a common phylogenetic history and with a similar biology and ecology, that have nonetheless extreme differences in the size of their geographical range (Lester et al., 2007).
In freshwater species, one of the most general and robust associations is that of habitat stability and geographic range (Ribera, 2008;Dijkstra, Monaghan & Pauls, 2014). Species living in standing waters tend to have better dispersal abilities than species living in running waters, due to the shorter geological duration of their habitats. Running water species have on average smaller geographic ranges and a lower gene flow between populations (Ribera, 2008;Abellán, Millán & Ribera, 2009). Range size is also strongly correlated with extinction probability (Jablonski, 1987), and high probabilities of extinction have been linked with narrow geographical ranges in several taxa (see e.g.,Hansen, 1980for marine invertebrates, Purvis et al., 2000for mammals, orRosenfield, 2002for freshwater fishes). This raises the question of how lineages with a predominance of running water species, and thus on average smaller geographic ranges, can persist over long evolutionary periods. It must be noted here that while among standing water species the frequency of species with small ranges is expected to be low, within running water lineages it is not rare to find widespread species (Ribera & Vogler, 2000). This is likely due to the asymmetry in the habitat constraints: standing water species have to migrate when their habitat disappears, but the higher stability of running water habitats means that species in them do not need to disperse. Nevertheless, they tend to lose dispersal capabilities, likely due to their associated cost (see Ribera, 2008for a review), although in some circumstances running water species seem to be able to disperse and reach widespread distributions. These few widespread species may be of disproportionate importance, as potential sources of new species (‘‘diversity pumps,’’ Ribera et al., 2011), but there is very few data on what makes a species in a clade of poor dispersers able to expand its range, or in what circumstances.
northern populations should have a recent origin, as most of central and northern Europe was glaciated or with permafrost during the Last Glacial Maximum, when the European ice sheet extended north of 52◦
N and the permafrost north of 47◦
N (Dawson, 1992). It is thus clear that some species were able to expand their ranges in a short time, as they could not have survived on the ice sheet.
We study the origin and phylogeography of the European widespread species in one of these running water lineages, the diving beetle genusDeronectesSharp (family Dytiscidae). With c. 60 described species (Nilsson & Hájek, 2015),Deronectesis the largest clade of Palaearctic diving beetle entirely confined to running waters. It has a predominantly Mediterranean distribution, ranging from North Africa and the Iberian Peninsula over most parts of Europe and the Middle East, with some species reaching central Asia (Nilsson, 2001). The genus has many narrow range Mediterranean species, including some island endemics, but also a few species widespread in central and northern Europe, showing their potential for range expansion. A recent molecular phylogeny of the genus (García-Vázquez et al., 2016) supported the existence of two main lineages, mostly corresponding to species with a western or eastern distribution. The widespread European species were also shown to be of Pleistocene origin, in agreement with other works with the genus (Ribera, Barraclough & Vogler, 2001;Ribera, 2003;Ribera & Vogler, 2004;Abellán & Ribera, 2011).
Our main objective here is to reconstruct in detail the temporal and geographic origin of the widespread European species ofDeronectes, using molecular data from a comprehensive sampling of them and their closest relatives, covering their entire distributions.
MATERIAL AND METHODS
Taxonomic background
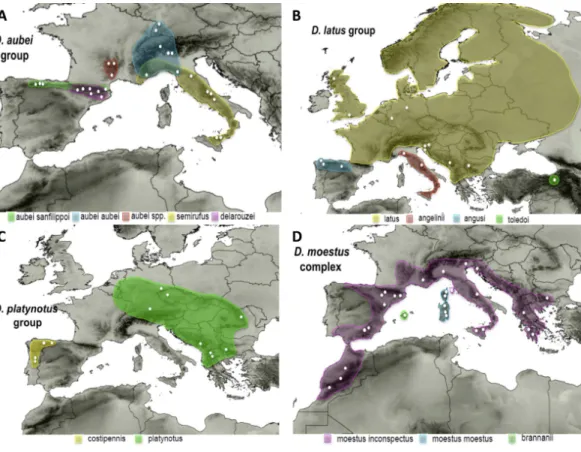
Four species ofDeronectes have widespread European distributions. Three of them are found in central and northern Europe, i.e., areas strongly affected by the last glacial cycle: (1)D. aubei(Mulsant), (2)D. latus(Stephens) and (3)D. platynotus(Germar). The fourth,
D. moestus(Fairmaire), is distributed along the western Mediterranean from the Maghreb to the Balkans, although with high intraspecific variation, according to the preliminary results ofGarcía-Vázquez et al. (2016). All four belong to different species groups within the genus, as defined byGarcía-Vázquez et al. (2016).
(1) TheD. aubeigroup includes three species, one of them divided in two subspecies. The widespreadD. aubeiincludesD. a. aubeifrom the Alps and surrounding areas, reaching southern Germany (Black forest) in the north, and D. a. sanfilippoi Fery & Brancucci distributed from the Cantabrian mountains in NW Spain to southern France (Pyrenees). The other two species areD. semirufus(Germar), from the Alps Maritims to Sicily, and
D. delarouzei(Jacquelin du Val) in the Pyrenees (Fery & Brancucci, 1997) (Fig. 1). García-Vázquez et al. (2016)found incongruence between mitochondrial and nuclear data within theD. aubeigroup. According to the mitochondrial sequence, the two subspecies ofD. aubei
were recovered as paraphyletic and respectively sisters to the geographically closest species of the group: one clade was distributed west of the Rhone river, includingD. a. sanfilippoi
Figure 1 Distribution maps of the studied species.Known distribution of the species of the four studied groups of Deronectes. White circles, sampled localities.
contrary, the nuclear sequence recovered a monophyleticD. aubeias sister to the other two species of the group (D. delarouzei and D. semirufus).
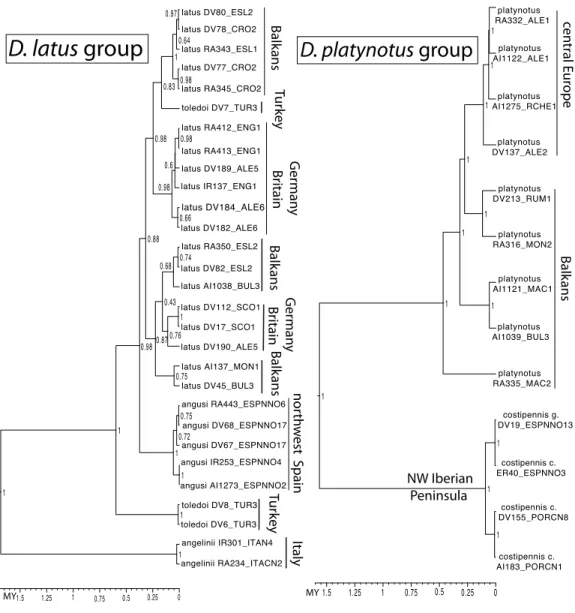
(2) TheD. latusgroup, within the eastern Mediterranean lineage ofDeronectes, includes four species.Deronectes latusis the most widespread species of the genus, occupying large areas of Europe north of the Pyrenees and the Apennines, reaching the British Isles and Scandinavia. On the contrary, the other three species have restricted distributions in the southern peninsulas:D. toledoiFery, Erman & Hosseinie in northeastern Turkey;D. angusi
Fery & Brancucci in northwestern Spain; andD. angeliniiFery & Brancucci, the only Italian endemic of the genus, from the Apennines to Sicily, including the island of Elba (see Fig. 1for the distribution of each species). The entire group was reconstructed as having an origin in the Anatolian peninsula, from were expanded first to Italy and the Balkan Peninsula and subsequently to the Iberian Peninsula and central and northern Europe (García-Vázquez et al., 2016).
(3) TheD. platynotusgroup, in the western clade ofDeronectes, comprises two species, with two subspecies each.Deronectes platynotusincludes the widespreadD. p. platynotus, distributed from the Balkans and northern Greece to central Europe, and the subspecies
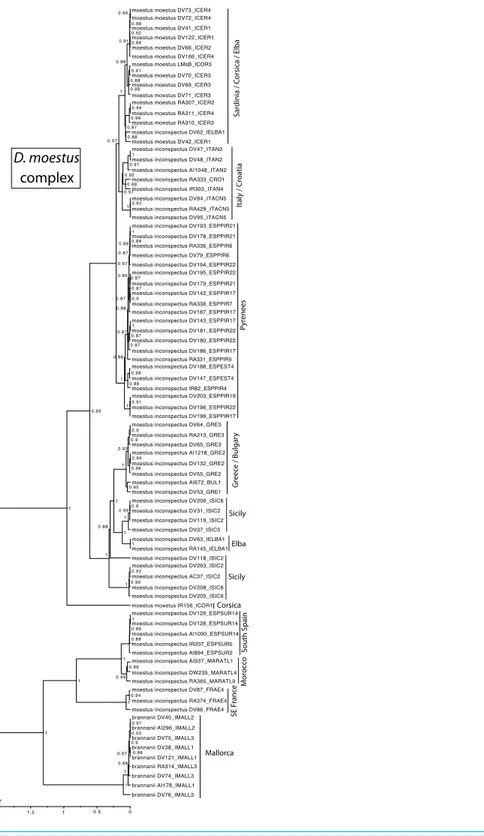
(4) TheD. moestusgroup includes the fourth of the widespread European species of the genus,D. moestus, distributed from the Maghreb and the Iberian Peninsula to the Balkans through southern France, Italy and Sicily, together with other western Mediterranean species. According to the results of García-Vázquez et al. (2016)D. moestusas currently understood is paraphyletic, and includes the Mallorcan endemicD. brannani(Schauffus). The two recognised subspecies of D. moestus,D. m. moestusfrom Corsica and Sardinia andD. m. inconspectus(Leprieur) from the continent, were not recovered as respectively monophyletic. Here we studied the speciesD. moestusplusD. brannani, what we call the
D. moestuscomplex (Fig. 1). The speciesD. perrinaeFery & Brancucci, from Algeria and Tunisia, is morphologically very close toD. moestus, and probably should be included in this complex, although no specimens could be obtained for study.
Taxon sampling
We studied a total of 296 specimens of 109 populations (with a maximum of 5 specimens per population) of all species of the four studied lineages of Deronectes, of which 23 specimens were previously used byGarcía-Vázquez et al. (2016)(Table S1). We aimed to cover the full geographic range of the studied species, in particular potential cryptic refuge areas (in the sense ofHomburg et al., 2013) at the margins of the Alps and neighbouring mountain ranges (such as the Black Forest), or areas not included in previous works (e.g., Sicily or French Massif Central for the species of theD. aubeigroup).
DNA extraction and sequencing
Specimens were collected and preserved in absolute ethanol directly in the field. We extracted the DNA non-destructively with commercial kits (mostly ‘‘DNeasy Tissue Kit’’; Qiagen GmbH, Hilden, Germany, and ‘‘Charge Switch gDNA Tissue Mini Kit’’; Invitrogen, Carlsbad, CA, USA) following the manufacturer’s instructions. Specimens and DNA extractions are kept in the collections of the Institut de Biología Evolutiva, Barcelona (IBE), Museo Nacional de Ciencias Naturales, Madrid (MNCN) and Natural History Museum, London (NHM).
We obtained seven gene fragments from six different genes (four mitochondrial and two nuclear) in five different amplification reactions (seeTable S2for primers and typical sequencing reactions): (1) 5′
end of the Cytochrome Oxidase Subunit 1 gene (the barcode fragment,Hebert, Ratnasingham & De Waard, 2003, COI-5′
); (2) 3′
end of Cytochrome Oxidase Subunit 1 (COI-3′
); (3) 5′
end of 16S rRNA plus tRNA transfer of Leucine plus 5′
end of NADH subunit 1 (nad1) (16S); and internal fragments of the nuclear genes (4) Histone 3 (H3) and (5) Wingless (Wg). The nuclear markers were only used in representative specimens according to geographical (one specimen per population) and topological criteria. For each amplification reaction, we obtained both forward and reverse sequences. In some specimens, and due to difficulties of amplification, we used internal primers for the fragment COI-3′
Auckland, New Zealand). NewDeronectessequences (a total of 791) have been deposited in GenBank with accession numbersLT601818–LT602609, andWolbachiasequences (23) with numbersLT602610–LT602633(Table S1).
Phylogenetic and phylogeographic analyses
Edited sequences were aligned withMAFFTv.6 using the G-INS algorithm and default values for other parameters (Katoh & Toh, 2008). We employed six partitions correspond-ing to the gene fragments COI-5′
, COI-3′
, 16S rRNA+tRNA-Leu, nad1, H3 and Wg, and used Partition Finder1.1.1(Lanfear et al., 2012) to estimate the best partitioning scheme (each gene separately or combining genes in a partition by codons) and the evolutionary model that best fitted the data for each partition separately, using the AIC (Akaike Information Criterion) as selection criteria. We performed two types of analyses using different datasets: (1) a global phylogeny/phylogeography to estimate the relationships of the main lineages within each group and root them; and (2) demographic analyses of the best population coalescent model for each group, including a reconstruction of the geographical history estimated from the distribution of the sampled localities.
For the global phylogeny/phylogeography we first selected one specimen per population to estimate the general topology of the four lineages within the wider genus Deronectes, employing Bayesian methods implemented in BEAST1.8(Drummond & Rambaut, 2007), using as outgroups 18 species ofDeronectesin other species groups. We rooted the trees in the separation between the western and eastern clades of the genus, following García-Vázquez et al., (2016). For the analysis, we implemented the closer available evolutionary model to those selected by Partition Finder and the best partitioning scheme, including both mitochondrial and nuclear markers. As there are no fossils or unambiguous biogeographic events that could be used to calibrate the phylogeny ofDeronectes (García-Vázquez et al., 2016), we applied an a-priori rate of 0.013 substitutions/site/MY (standard deviation 0.002) for protein coding genes and 0.0016 substitutions/site/MY (standard deviation 0.0002) for 16S, obtained in a related group (family Carabidae) for the same mitochondrial genes (Andújar, Serrano & Gómez-Zurita, 2012). As there are no reliable estimations of the evolutionary rate of the nuclear genes, we applied an uniform flat prior (from 0 to infinite). We used an uncorrelated lognormal relaxed clock, a Yule speciation model and executed two independent analyses with the same settings, running 100 million generations (saving trees every 5,000) or until they converged and the number of trees was sufficient according to Effective Sample Size (ESS) values, as measured with TRACER v1.6(Drummond & Rambaut, 2007). The majority rule consensus tree of the two runs was compiled with Tree Annotator v1.8 (Drummond & Rambaut, 2007). To test for potential discordances among the different markers, we also analysed separately the mitochondrial and nuclear data. We applied the same settings as the combined analysis but, to estimate the divergence dates among species, we established as a prior for the root of the tree a normal distribution with average 14 Ma and a standard deviation of 0.1, according to the results obtained in García-Vázquez et al. (2016).
expansion or exponential) that best fitted the data. Previously, we tested the adjustment to a strict molecular clock and used the best clock model in the coalescent analyses. We used the mitochondrial sequence only and no outgroups, with a GTR+I+G evolutionary model and the same settings used in the analysis of the topology. For model selection of the molecular clock and coalescent analyses, we used the modified Akaike information criterion (AICM) with moments estimator (Baele et al., 2012), as implemented in TRACER v1.6, with 1,000 bootstrap replicates. We also computed Bayesian skyline plots for each
group to reconstruct the variation of the effective population sizes with time.
Using the best clock and demographic models as selected above, and after excluding specimens from the same locality with repeated haplotypes, we reconstructed the phylogeographic history of each group in BEAST using the coordinates of each locality as a quantitative trait (Lemey et al., 2009). We excluded outgroups, but included the nuclear markers in the analyses. We overlaid the reconstructed coordinates of the nodes of the phylogeography of each group, as obtained with BEAST and SPREADv1.0.6 (Bielejec et al., 2011), in Google Earth (http://earth.google.com), allowing the reconstruction through time of the history of each lineage, from the origin until the current distribution.
Wolbachiadetection
The incongruence between the mitochondrial and the nuclear data in theD. aubeigroup noted byGarcía-Vázquez et al. (2016)raised the possibility that specimens could be infected withWolbachia, a maternally transmitted parasite that can alter the patterns of mtDNA variability (Jiggins, 2003). We thus tested for the presence of Wolbachiain 56 selected specimens (seeTable S1) of the four studied groups ofDeronectes, focusing on the species of theD. aubeigroup.
We used specific primers for the wsp gene, amplifying a 632 bp fragment. A 3 µl sample of the PCR reaction mixture was electrophoresed with a 100 bp DNA ladder on 1% agarose gel to determine the presence and size of the amplified DNA bands, that were visualized by Sybr-Safe staining. A selection of positive PCR’s were purified by standard ethanol precipitation and sent to external facilities for sequencing after purification. DNA sequences were assembled and edited using GENEIOUS and aligned with MAFFT v.6 using the G-INS algorithm and default values for other parameters (Katoh & Toh, 2008). To identify the corresponding supergroup ofWolbachia, we compared our sequences with previously classified sequenced according toZhou, Rousset & O’Neill (1998), obtained from GenBank.
RESULTS
Combined phylogeny/phylogeography
by genes. The best evolutionary models were GTR+I+G for the COI-5′, COI-3′, 16S rRNA+tRNA-Leu and Wingless; GTR+G for nad1, and Trn+I+G for H3.
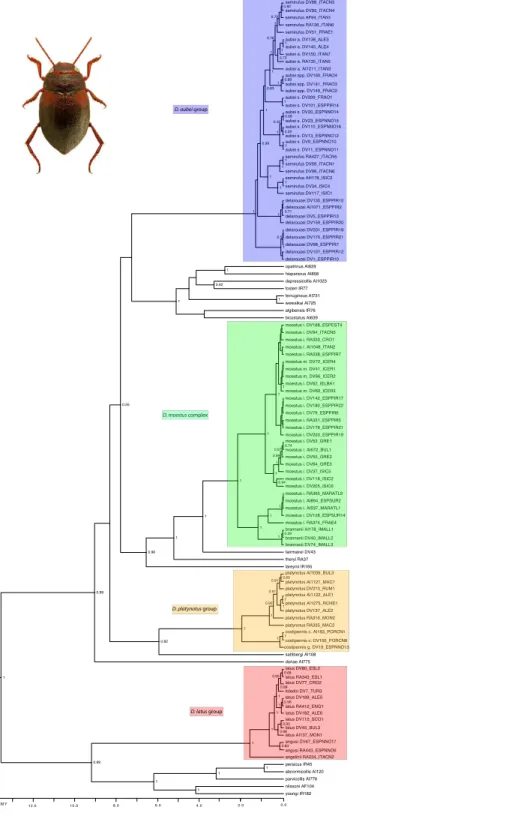
The ultrametric tree obtained with the combined mitocondrial and nuclear data showed a topology compatible with that obtained in García-Vázquez et al. (2016), with strong support for the monophyly of all studied species groups but poorly resolved relationships within the western clade (Fig. 2). In theD. aubeigroup we recovered the Pyrenean endemic
D. delarouzei as paraphyletic, at the base of the remaining species of the group, which monophyly was strongly supported (Fig. 2). Within the later, the Sicilian and southern Italian D. semirufuswere monophyletic and sister toD. aubei plus D. semirufusfrom the northern Apennines (Tuscany and Emilia-Romagna) and southeastern France. The PyreneanD. aubeiwere paraphyletic at the base of a strongly supported clade including first specimens from the Cevennes (geographically closer) and then from the Alps Maritimes, Italian Alps and south Germany (Black Forest), plus the AlpineD. semirufus(Fig. 2). The analysis of the mitochondrial data alone divided theD. aubeigroup into two clades well separated geographically: one formed by specimens ofD. aubei aubeiandD. semirufusfrom the Alps, Black Forest, French Massif Central and northern Appenines, and the other clade subdivided into two sister groups, one formed by specimens ofD. delarouzeiandD. aubei sanfilippoi from northern Spain and Pyrenees and the other byD. semirufusfrom Sicily and central-southern Apennines (seeFig. S1). Contrary to the results with the combined or the mitochondrial data alone, the nuclear data recovered a monophyleticD. aubeiwithin a paraphyletic series including the other two species of the group (Fig. S2).
The species of theD. latusgroup were included in the eastern clade, as sister to the species of theD. parvicollisgroup. Within theD. latusgroup, the ItalianD. angeliniiwas sister to the rest, which included the IberianD. angusiand the widespreadD. latuswith the TurkishD. toledoinested within it (Fig. 2). Within theD. platynotusgroup, the two species of the group (D. platynotusandD. costipennis), and the subespeciesD. c. costipennis, were respectively monophyletic and well supported (Fig. 2). In theD. moestusgroup there was a deep intraspecific divergence inD. moestus. A clade with a predominantly western distribution included the specimens from Morocco, southern Spain and southeastern France as sister to the Mallorcan endemic D. brannani (Fig. 2). Its sister clade, with a predominantly eastern distribution, included specimens of D. moestusfrom northern Spain to Bulgaria and with specimens of the two previously recognised morphological subspecies (D. m. moestusandD. moestus inconspectus).
All species of the four studied groups were estimated to be of Pleistocene origin with the exception of the deepest clades within theD. moestuscomplex, dated to the Pliocene-Pleistocene boundary. Intraspecific variation was very recent (from the Upper Pliocene-Pleistocene), as was the separation between some species, which have still not reached monophyly (e.g., within theD. latusorD. aubeigroups) (Fig. 2).
Demographic models and detailed phylogeography
0.0 2.0 10.0
12.0
aubei a. DV150_ITAN7
fosteri IR77
latus DV182_ALE6 moestus i. DV37_ISIC5 semirufus RA136_ITAN6
latus DV112_SCO1 moestus i. DV188_ESPEST4
moestus i. AI937_MARATL1 moestus m. DV72_ICER4 semirufus AF94_ITAN1
aubei a. DV145_ALE4
semirufus DV34_ISIC4 aubei s. DV23_ESPNNO15 aubei s. DV101_ESPPIR14
theryi RA37
toledoi DV7_TUR3
angelinii RA234_ITACN2
abnormicollis AI120 costipennis g. DV19_ESPNNO13
nilssoni AF104 moestus i. DV53_GRE1 moestus i. DV180_ESPPIR22 aubei a. AI1211_ITAN3
moestus m. DV66_ICER2 depressicollis AI1023 platynotus DV213_RUM1 latus AI137_MON1 ferrugineus AI731 delarouzei DV159_ESPPIR20 semirufus DV93_ITACN4
aubei s. DV20_ESPNNO14
doriae AI775 aubei a. RA135_ITAN5
latus DV189_ALE5 latus RA343_ESL1 algibensis IR76
moestus i. DV64_GRE3
fairmairei DV43 delarouzei DV5_ESPPIR13
moestus i. RA374_FRAE4 moestus i. DV128_ESPSUR14 semirufus AH178_ISIC3 semirufus DV51_FRAE1
moestus i. AI672_BUL1
moestus i. RA365_MARATL9
platynotus AI1039_BUL3 moestus i. DV62_IELBA1 semirufus DV59_ITACN1
moestus i. DV205_ISIC6 aubei spp. DV160_FRAO4
semirufus DV117_ISIC1
platynotus DV137_ALE2 aubei s. DV11_ESPNNO11
opatrinus AI629 brannanii DV74_IMALL3 semirufus RA427_ITACN5 latus RA412_ENG1 latus DV45_BUL3 angusi RA443_ESPNNO6 delarouzei AI1071_ESPPIR2
moestus i. AI894_ESPSUR2 moestus i. RA331_ESPPIR5 moestus m. DV69_ICER3
moestus i. DV55_GRE2 bicostatus AI639 lareynii IR165 delarouzei DV135_ESPPIR15 platynotus RA335_MAC2 sahlbergi AI108 platynotus AI1275_RCHE1 parvicollis AI776 delarouzei DV107_ESPPIR12
moestus i. DV79_ESPPIR6 moestus i. AI1048_ITAN2 delarouzei DV98_ESPPIR7
moestus i. DV94_ITACN5
platynotus RA316_MON2 youngi IR182 brannanii AI178_IMALL1 brannanii DV40_IMALL2 latus DV80_ESL2 delarouzei DV1_ESPPIR10 platynotus AI1122_ALE1
costipennis c. AI183_PORCN1
persicus IR45 moestus i. DV118_ISIC2 wewalkai AI725
moestus i. DV142_ESPPIR17
costipennis c. DV155_PORCN8
angusi DV67_ESPNNO17 aubei s. DV13_ESPNNO12
moestus m. DV41_ICER1 delarouzei DV175_ESPPIR21 aubei s. DV110_ESPNNO16
moestus i. DV203_ESPPIR19 aubei spp. DV149_FRAO2 aubei a. DV138_ALE3
moestus i. DV178_ESPPIR21
latus DV77_CRO2 aubei s. DV209_FRAO1
aubei s. DV9_ESPNNO10 aubei spp. DV141_FRAO3 semirufus DV88_ITACN3
moestus i. RA333_CRO1 semirufus DV99_ITACN6
platynotus AI1121_MAC1 moestus i. RA338_ESPPIR7 delarouzei DV201_ESPPIR18 hispanicus AI858 0.65 1 1 1 0.82 1 1 1 0.72 1 0.55 0.73 0.68 1 1 1 1 1 1 1 1 1 1 0.5 1 1 1 0.99 0.39 1 1 1 0.97 0.68 0.99 0.62 1 1 1 1 1 1 0.94 1 1 0.76 0.91 1 1 0.98 0.92 1 1 1 0.95 1 1 0.71 0.91 0.63 0.74 0.82 0.96 0.52 1 1 1 1 0.95 0.89 1 0.29 1 0.89 0.89 0.83 0.99 1 1 1 1 1 0.98
D. latus group
D. platynotus group
D. moestus complex
D. aubei group
4.0 6.0 8.0
M Y
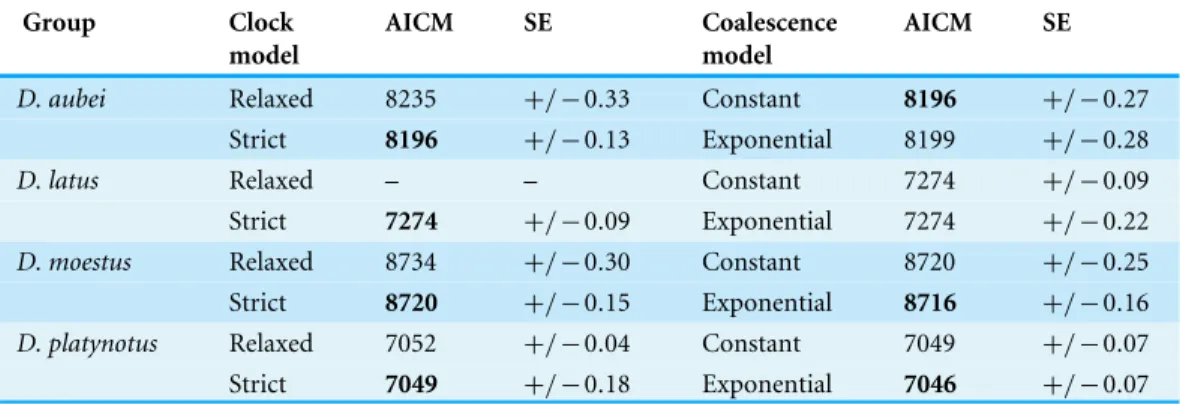
Table 1 Analyses of the best molecular clock model and population coalescent model for each group,
including AICM values and standard error (SE).In bold, best AICM value for each pair. Differences
be-low 2 were not considered as significant. The relaxed model forD. latusfailed to converge and was not considered (see ‘Results’).
Group Clock
model
AICM SE Coalescence
model
AICM SE
D. aubei Relaxed 8235 +/−0.33 Constant 8196 +/−0.27
Strict 8196 +/−0.13 Exponential 8199 +/−0.28
D. latus Relaxed – – Constant 7274 +/−0.09
Strict 7274 +/−0.09 Exponential 7274 +/−0.22
D. moestus Relaxed 8734 +/−0.30 Constant 8720 +/−0.25
Strict 8720 +/−0.15 Exponential 8716 +/−0.16
D. platynotus Relaxed 7052 +/−0.04 Constant 7049 +/−0.07
Strict 7049 +/−0.18 Exponential 7046 +/−0.07
running for 100 million generations, especially for parameters of the 16S gene likely due to insufficient variation. Exploratory analyses of the topology and divergent dates showed no substantial variation with respect to the strict clock model, which was also adopted.
The coalescent analyses with logistic and expansion grow models did not converge adequately in any group. The exponential grow model performed significantly better in the
D. platynotusgroup and theD. moestuscomplex, and the constant size model in theD. aubei
group, while there was no significant difference between both models in theD. latusgroup (Table 1). The Bayesian skyline plot was very similar for theD. latusandD. aubeigroups, with a nearly constant effective population size with a recent, postglacial increase after a slight decline (Fig. 3). In theD. moestuscomplex it also remained constant until recent times, but with a recent sharp decline followed by a fast increase recovering the previous effective population size. On the contrary, in theD. platynotusgroup there was a gradual decrease ending in a sharp decline (Fig. 3).
Due to the absence of outgroups in the phylogeographic analyses in BEAST the origin of each of the individual clades was reconstructed in a position geographically intermediate between the two basal nodes, and was not interpreted.
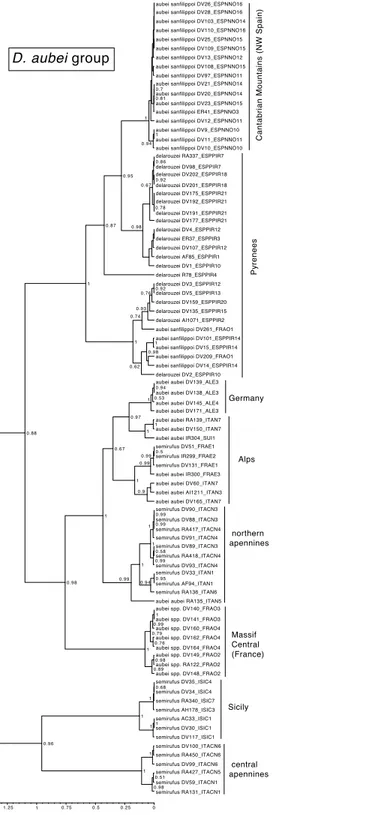
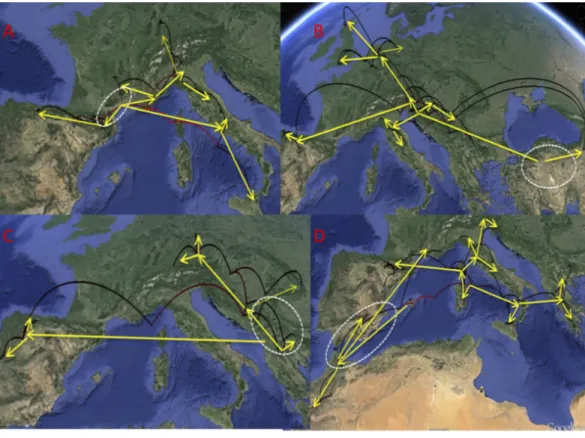
In theD. aubeigroup there were three main lineages geographically well differentiated. The north of the Iberian peninsula (Pyrenees and Cantabrian mountains) was reconstructed as having been populated from east to the west byD. delarouzeiandD. a. sanfilippoi; Sicily and the central and southern part of the Italian peninsula by the southernD. semirufus; and the Alps and nearby areas byD. a. aubeiand the northernD. semirufus. Within the later, the expansion seems to have been from the Alpes Maritimes and the Italian Piamonte to respectively the Massif Central, the north side of the Alps, including the Black Forest, and the northern Apenines (seeFig. 4for the phylogenetic tree andFig. 5for the map with the phylogeographic reconstruction).
!" !#$" !#%" !#&" !#'" !#(" !#)" !"
$#!" $!" $!!"
!"#$%&'("*+,-."
!" !#$" !#%" !#&" !#'" !#(" !#)" !#/" !#0" !#1" !"
$#!" $!"
!"#)$*%+"*+,-."
!"
!" !#%(" !#(" !#/(" $#!" $#%(" $#(" $#!"
$!" $!!"
!"#,-'+*%+"2,3.456"
!" !#%(" !#(" !#/(" $#!" $#%(" !"
$#!" $!"
7$!!"
!"#.)$*/0-*%+"*+,-."
!"
!" !#%(" !#(" !#/(" $#!" $#%(" $#(" $#!"
$!" $!!"
!"#,-'+*%+"2,3.456"
7$!!" !" !#%(" !#(" !#/(" $#!" $#%("
!" $#!" $!"
7$!!"
!"#.)$*/0-*%+"*+,-."
Figure 3 Demographic history of the studied groups ofDeronectes.Bayesian Skyline plots for each species group of the analyses of the mitochondrial sequence, assuming a strict clock (see ‘Material and Methods’ for details). Thin lines, 95% confidence intervals; horizontal axis, time (MY); vertical axis, effec-tive population size (NeT).
and northern Europe (including the British Islands) byD. latus(Figs. 5and6). One of the sequenced specimens ofD. toledoiwas, however, nested withinD. latus(Fig. 6).
In the D. platynotusgroup the widespreadD. platynotusoriginated in the Balkans, from where expanded eastwards towards the Carpathians and northwards to reach central Europe (Figs. 5and6).
The western clade of theD. moestuscomplex was reconstructed as having an origin between the Balearic islands (withD. brannani) and north Morocco, from were it expanded north to the rest of the Iberian peninsula and southern France. The eastern clade was reconstructed as having an origin between the Tyrrhenian islands and southern Italy, from were one lineage expanded to the north of the Iberian peninsula and north Italy up to Slovenia, and another to Sicily, southern Italy and the Balkan peninsula (Greece and Bulgaria). The islands of Corsica, Elba and Sicily had specimens of different origins within the eastern clade, but the sampled Sardinian haplotypes had a single origin, with a back colonisation to Corsica (Figs. 5and7).
Presence ofWolbachia
We did not detectWolbachiain any of the eight tested specimens of theD. platynotusand
0 0.25 0.5 0.75 1 1.25
aubei aubei AI1211_ITAN3 delarouzei DV201_ESPPIR18
semirufus DV91_ITACN4
aubei spp. DV162_FRAO4 aubei sanfilippoi DV28_ESPNNO16
semirufus AF94_ITAN1 delarouzei RA337_ESPPIR7
aubei aubei RA139_ITAN7
semirufus DV30_ISIC1 aubei aubei RA135_ITAN5 aubei sanfilippoi DV108_ESPNNO15
semirufus DV93_ITACN4 delarouzei DV175_ESPPIR21
aubei aubei IR304_SUI1 aubei aubei DV150_ITAN7
semirufus IR299_FRAE2 aubei sanfilippoi DV9_ESPNNO10
aubei spp. DV160_FRAO4 delarouzei DV2_ESPPIR10
semirufus RA427_ITACN5 delarouzei DV135_ESPPIR15
aubei aubei DV171_ALE3
semirufus DV99_ITACN6 delarouzei DV98_ESPPIR7
semirufus DV90_ITACN3
semirufus RA136_ITAN6 aubei sanfilippoi DV15_ESPPIR14
semirufus DV131_FRAE1
aubei spp. DV164_FRAO4
semirufus DV59_ITACN1 aubei sanfilippoi ER41_ESPNNO3
semirufus AH178_ISIC3 aubei sanfilippoi DV209_FRAO1
aubei spp. DV140_FRAO3 aubei sanfilippoi DV103_ESPNNO14
semirufus DV33_ITAN1 aubei sanfilippoi DV20_ESPNNO14
aubei sanfilippoi DV11_ESPNNO11
delarouzei DV202_ESPPIR18
aubei aubei DV60_ITAN7
aubei spp. RA122_FRAO2
semirufus DV100_ITACN6 delarouzei DV107_ESPPIR12
aubei aubei DV165_ITAN7 delarouzei DV4_ESPPIR12 delarouzei ER37_ESPPIR3
aubei aubei DV139_ALE3
aubei aubei IR300_FRAE3
semirufus RA450_ITACN6 delarouzei R78_ESPPIR4 delarouzei DV159_ESPPIR20 delarouzei DV3_ESPPIR12 semirufus DV51_FRAE1 delarouzei AF85_ESPPIR1 delarouzei DV192_ESPPIR21 semirufus AC33_ISIC1 delarouzei DV177_ESPPIR21 delarouzei AI1071_ESPPIR2
aubei spp. DV141_FRAO3 semirufus DV88_ITACN3 aubei sanfilippoi DV25_ESPNNO15
semirufus RA418_ITACN4 aubei sanfilippoi DV21_ESPNNO14 aubei sanfilippoi DV97_ESPNNO11
semirufus RA131_ITACN1 semirufus DV35_ISIC4 aubei sanfilippoi DV12_ESPNNO11
aubei spp. DV149_FRAO2 delarouzei DV191_ESPPIR21
delarouzei DV1_ESPPIR10
delarouzei DV5_ESPPIR13 aubei sanfilippoi DV110_ESPNNO16
aubei sanfilippoi DV101_ESPPIR14
aubei spp. DV148_FRAO2 aubei sanfilippoi DV10_ESPNNO10
semirufus RA417_ITACN4 aubei aubei DV145_ALE4
semirufus DV34_ISIC4 aubei sanfilippoi DV109_ESPNNO15
aubei sanfilippoi DV14_ESPPIR14 aubei sanfilippoi DV23_ESPNNO15 aubei sanfilippoi DV13_ESPNNO12
aubei sanfilippoi DV261_FRAO1
aubei aubei DV138_ALE3
semirufus DV117_ISIC1 semirufus RA340_ISIC7 aubei sanfilippoi DV26_ESPNNO16
semirufus DV89_ITACN3 0.99 1 0.79 1 1 0.89 0.93 0.98 1 0.95 1 0.95 0.92 0.67 1 1 0.78 0.51 0.68 1 0.76 0.94 0.5 0.99 1 0.98 0.9 0.67 0.94 1 0.99 0.98 1 1 0.97 1 0.99 0.87 1 0.58 0.88 1 1 0.7 0.94 1 1 0.62 0.76 1 0.96 0.74 0.53 1 1 0.99 0.99 0.98 0.98 1 0.99 0.92 0.81 0.86 MY
D. aubei group
Sicily central apennines Massif Central (France) Alps northern apennines Germany Pyrenees
Cantabrian Mountains (NW Spain)
Figure 4 Ultrametric time calibrated tree of theD. aubeigroup.Ultrametric time calibrated tree ob-tained with BEAST with the combined nuclear and mitochondrial sequence of all sampled specimens of
theD. aubeigroup, using the coordinates of each locality as a quantitative trait and the best population
Figure 5 Phylogeographic reconstruction of the history of each lineage.Phylogeographic reconstruc-tion through time in Google Earth (http://earth.google.com) of the history of each lineage, from the origin until the current distribution, based on the results represented inFigs. 4,6and7. Parabolas represent the reconstructed displacements between nodes in the phylogeny (in red, basal nodes). Yellow arrows mark the general direction of the range expansions, and the white dashed line the hypothesized area of origin of each group. (A)D. aubeigroup; (B)D. latusgroup; (C)D. platynotusgroup; (D)D.
moestuscomplex. Photo credit: Image Landsat, IBCAO and U.S. Geological Survey. Data SIO, NOAA, US
Navy, NGA, GEBCO.
we did not identifyWolbachiain any of the six specimens tested from Mallorca, Morocco and southern Spain, but the two tested specimens ofD. moestusfrom Southern France were positive for supergroup B. Of the 15 tested specimens of the eastern clade, three were positive for supergroup A in the Pyrenees and northern Italy and four for supergroup B in Sicily and Greece. The three tested specimens from the central Apenines and Elba were negative (Table S1).
0 0.25 0.5 0.75 1 1.25 1.5 1 1 1 1 0.83 0.98 0.76 0.98 1 0.87 1 0.74 0.98 0.98 0.75 0.98 0.97 0.43 0.6 0.88 1 0.66 0.75 0.72 1 0.68 0.64
MY 1.5 1.25 1 0.75 0.5 0.25 0
1 1 1 1 1 1 1 1 1 1 1 1 angelinii RA234_ITACN2 angelinii IR301_ITAN4 toledoi DV8_TUR3 toledoi DV6_TUR3 angusi AI1273_ESPNNO2 angusi IR253_ESPNNO4 angusi DV67_ESPNNO17 angusi DV68_ESPNNO17 angusi RA443_ESPNNO6 latus DV45_BUL3 latus AI137_MON1 latus DV190_ALE5 latus DV17_SCO1 latus DV112_SCO1 latus AI1038_BUL3 latus DV82_ESL2 latus RA350_ESL2 latus DV182_ALE6 latus DV184_ALE6 latus IR137_ENG1 latus DV189_ALE5 latus RA413_ENG1 latus RA412_ENG1 toledoi DV7_TUR3 latus RA345_CRO2 latus DV77_CRO2 latus RA343_ESL1 latus DV78_CRO2 latus DV80_ESL2 costipennis c. AI183_PORCN1 costipennis c. DV155_PORCN8 costipennis c. ER40_ESPNNO3 costipennis g. DV19_ESPNNO13 platynotus RA335_MAC2 platynotus AI1039_BUL3 platynotus AI1121_MAC1 platynotus RA316_MON2 platynotus DV213_RUM1 platynotus DV137_ALE2 platynotus AI1275_RCHE1 platynotus AI1122_ALE1 platynotus RA332_ALE1 Italy Tur key nor th w
est Spain
Balk ans G er man y Br itain Balk ans Balk ans Tur key G er man y Br itain
D. latus
group
MY NW Iberian Peninsula Balk ans cen tr al E ur ope
D. platynotus
group
Figure 6 Ultrametric time calibrated trees of theD. latusandD. platynotusgroups.Ultrametric time calibrated trees obtained with BEAST with the combined nuclear and mitochondrial sequence of all sam-pled specimens of (1) theD. latusgroup and (2) theD. platynotusgroup, using the coordinates of each lo-cality as a quantitative trait and the best population coalescent model for each group. Numbers on nodes, Bayesian posterior probabilities. SeeFig. 5for a graphic representation of the reconstructed geographical coordinates, andTable S1for details on the specimens and localities.
DISCUSSION
Recolonization process
0 0 . 5 1 1 . 5 2
moestus inconspectus DV132_GRE2 moestus inconspectus RA213_GRE3 moestus inconspectus RA333_CRO1
moestus inconspectus AI672_BUL1
moestus inconspectus AI894_ESPSUR2 moestus inconspectus RA429_ITACN5 moestus moestus DV72_ICER4
moestus inconspectus DV37_ISIC5
brannanii DV38_IMALL1 moestus inconspectus IR82_ESPPIR4
brannanii DV74_IMALL3 moestus inconspectus DV94_ITACN5
moestus inconspectus DV95_ITACN5
moestus inconspectus RA331_ESPPIR5 moestus inconspectus DV195_ESPPIR22
moestus inconspectus DV119_ISIC2 moestus inconspectus DV65_GRE3 moestus inconspectus AI1218_GRE2
moestus inconspectus DV118_ISIC2 moestus moestus DV69_ICER3
moestus inconspectus DV179_ESPPIR21
moestus inconspectus RA365_MARATL9 moestus moestus DV122_ICER1
moestus moestus DV71_ICER3
moestus inconspectus DV187_ESPPIR17
moestus inconspectus DV53_GRE1
moestus moestus IR156_ICOR1 moestus inconspectus RA338_ESPPIR7
moestus inconspectus DV199_ESPPIR17 moestus inconspectus DV143_ESPPIR17
brannanii DV40_IMALL2 moestus moestus DV70_ICER3
moestus inconspectus DV203_ESPPIR19 moestus inconspectus DV194_ESPPIR22 moestus inconspectus DV79_ESPPIR6 moestus moestus RA307_ICER2
moestus inconspectus DV64_GRE3 moestus moestus DV42_ICER1
moestus inconspectus AI1048_ITAN2
brannanii AI296_IMALL2 moestus inconspectus DV206_ISIC6
moestus inconspectus AI1090_ESPSUR14
brannanii DV76_IMALL3 moestus inconspectus DV63_IELBA1
moestus inconspectus DV86_FRAE4 moestus moestus RA311_ICER4
moestus inconspectus RA374_FRAE4 moestus moestus RA310_ICER3
moestus inconspectus DV142_ESPPIR17
moestus inconspectus DV55_GRE2 moestus inconspectus DV186_ESPPIR17
moestus inconspectus DV263_ISIC2
brannanii DV121_IMALL1 moestus moestus DV66_ICER2
moestus inconspectus DV180_ESPPIR22 moestus inconspectus DV178_ESPPIR21
brannanii RA314_IMALL3 moestus moestus DV73_ICER4
moestus moestus LMsB_ICOR3
moestus inconspectus IR303_ITAN4 moestus inconspectus DV47_ITAN2
moestus inconspectus AI937_MARATL1
moestus inconspectus DV87_FRAE4 moestus moestus DV166_ICER4
moestus inconspectus DV208_ISIC6
moestus inconspectus DV128_ESPSUR14 moestus inconspectus DV129_ESPSUR14 moestus inconspectus DV193_ESPPIR21
moestus inconspectus AC37_ISIC2 moestus inconspectus RA336_ESPPIR6
brannanii AI178_IMALL1 moestus inconspectus DV196_ESPPIR22
moestus inconspectus DV205_ISIC6 moestus inconspectus RA145_IELBA1 moestus inconspectus DV62_IELBA1
moestus inconspectus DV147_ESPEST4
moestus inconspectus IR207_ESPSUR5 moestus moestus DV41_ICER1
moestus inconspectus DW235_MARATL4 moestus inconspectus DV48_ITAN2
moestus inconspectus DV31_ISIC2 moestus inconspectus DV181_ESPPIR22
moestus inconspectus DV188_ESPEST4
brannanii DV75_IMALL3 0.88 0.87 0.88 0.93 1 1 1 0.87 0.88 0.96 0.99 0.87 1 0.87 0.88 0.87 1 0.92
0 . 9
0.88 0 . 9 0.88
0.92
1 0.91
0 . 9
0.96
0 . 9 0.88 1 0.97 0.88 0.97 0.99 0.96 0.89 0.99 0.92 1 0.88 0.89 0.99 1 1 1 1 1 1 1 0.89 1 0.97 0.87 0.92 1 0.94 0.91 0.87 1 0.88 1 0.88 0.88 1 1 0.93 0.97 0.97 1 0.87 0.95 0.96 1 0.88 0 . 9
0.97 0.88 0.91 1 0.88 0.98 0.96 0.95 D. moestus complex S outh Spain SE F ranc
e Mo
ro cco Mallorca Corsica Sicily Elba Sicily Gr eec
e / Bulgar
y
P
yr
enees
Italy / C
roa
tia
S
ar
dinia / C
orsica / Elba
MY
Figure 7 Ultrametric time calibrated tree of theD. moestuscomplex. Ultrametric time calibrated tree obtained with BEAST with the combined nuclear and mitochondrial sequence of all sampled specimens of
theD. moestuscomplex, using the coordinates of each locality as a quantitative trait and the best
byD. angelini, and in the Iberian Peninsula by D. angusi(Fig. 1). WithinD. aubeithe northern taxa (D. aubei aubeiand the northern clade ofD. semirrufus) are restricted to south Germany, the Alps and the Massif Central, being replaced in the north of the Iberian peninsula byD. aubei sanfilippoiand in central and south Italy and Sicily by the southern clade ofD. semirrufus. The situation withD. platynotusandD. moestusis more complex, in the former due to the disjoint distribution, and in the later due to unrecognised ancient diversity. However, in the Balkans D. platynotusonly reaches the northern mountain chains, in which populations present some morphological differences that may warrant a taxonomic recognition (H Fery, pers. comm., 2016). The southernmost populations of the species, in north Greece, are considered a distinct subspecies with a very restricted distribution, of which no specimens could be obtained for study (D. platynotus mazzoldii, Fery & Brancucci, 1997). There is additional evidence that the species currently restricted to Mediterranean peninsulas were never present in central and northern Europe, as there are no known records of Quaternary fossil remains of any of them (Abellán et al., 2011).
The existence of these two partly non overlapping species pools (Mediterranean species with ranges never extending to northern Europe, and northern species with limited southern distributions) is consistent with increasing evidence from molecular studies of the role of the Mediterranean peninsulas as a source of endemism (see e.g.,Bilton et al., 1998;Petit et al., 2003;Ribera & Vogler, 2004). This suggests that after recolonisation during an ecologically optimal period, northern populations become isolated from their source areas. At the end of each Pleistocene Glacial cycle environmental conditions in the newly deglaciated areas in central and north Europe could have been optimal for running water organisms typical of mountain streams, such asDeronectes. The likely vast number of small streams from the thaw of the ice sheet, even in lowland areas, could have represented an ecological opportunity for these species, favouring range expansions to new empty areas without developed communities but with homogeneous favourable conditions (Ribera et al., 2011). When ecological conditions changed populations become increasingly isolated, resulting in the currently recognised taxa.
However, only some species in these lineages of poor dispersers expanded their ranges, while the rest remained confined to restricted areas in the southern Peninsulas. The species with widespread distributions do not seem to share any particular phylogenetic pattern. They are not the oldest species in their clades, which could have lead to the hypothesis that their wider ranges were due to a longer time to disperse (Willis, 1926;Gaston, 2003). On the contrary, they are in most cases nested within southern species or populations. Another possibility is that their physiological or ecological tolerances favoured their range expansion. There is some evidence that differences in the ecological tolerance of the species are related to their geographic range extent (Addo-Bediako, Chown & Gaston, 2000;Gaston & Spicer, 2001;Gaston, 2009). Thus, widespread species would have a higher ecological plasticity while species with restricted distributions may have a limited physiological tolerance (West-Eberhard, 2003). Among the many possible ecological or physiological factors, thermal tolerance have been frequently linked with distributional ranges (e.g.,Stillman, 2002;Somero, 2005;Verdú & Lobo, 2008). Previous physiological studies withDeronectes
than their restricted southern relatives (Calosi, Bilton & Spicer, 2008;Calosi et al., 2010). Thus, the most widespread species of the genus,D. latus, had also the greatest thermal window (Calosi et al., 2010). However, there is a poor adjustment of experimental data with ecological data derived from the localities they currently occupy (Sánchez-Fernández et al., 2012). With the available information (with no data on intraspecific variability) it is also not possible to assess if this wider thermal tolerance was previous to the range expansion, making it possible, or if it was developed after the range expansion, as a consequence of being exposed to a wider range of climatic conditions.
An alternative hypothesis is that the widespread species did not have any particular physiological or ecological character favouring their range expansion, but just took advantage of a privileged geographical position. They may have been the ones that happened to be at the edge of the newly deglaciated areas. According to our results, populations in mountain ranges at the northern edge of the southern peninsulas played a key role in the recolonization of glaciated areas. Thus, theD. latusgroup is the westernmost lineage within the easternDeronectesclade, and the central European populations ofD. platynotus
appear nested within those of the northern Balkans. Within the Iberian Peninsula, with numerous species of Deronecteswith a restricted distribution in most of its mountain systems (Millán et al., 2014;García-Vázquez et al., 2016), theD. aubeigroup is restricted to the northernmost ranges (Cantabrian mountains and the Pyrenean area, Fig. 1). As already noted, the situation within theD. moestusgroup is more complex, due to the deep divergences between some lineages. Under this hypothesis, historical more than intrinsic factors would determine which species become widespread and may be the origin of further diversification (Ribera et al., 2011). The evidence supporting the role of geographic position in facilitating range expansions relies on the assumption that southern species have maintained their geographic ranges through the last glacial cycles, so that it is possible to infer their past distribution from their current location. Although this assumption has been challenged (e.g.,Gaston, 2003;Losos & Glor, 2003), it has been repeatedly shown that in poorly dispersing lineages range movements do not erase completely the geographic signal from the past (Barraclough & Vogler, 2000;Abellán & Ribera, 2011;Ribera et al., 2011).
Demographic history of the recolonization
The dynamics of the range expansions was not the same in all the studied groups, as shown with the reconstructions of the Bayesian skyline plots (Fig. 3). Thus, while in theD. aubei
andD. latusgroup we estimated a fast expansion through western Europe (D. aubei) or the whole continent (D. latus), leading to the current continuous distributions, in the
Wolbachiainfections
We found a high prevalence ofWolbachiainfection amongDeronectes, with specimens infected in five of the eleven studied species (45%). This percentage is concordant with recent estimations of a 40% of Wolbachiaprevalence among arthropods (Zug & Hammerstein, 2012) and 31% in a group of families of aquatic beetles, among them Dytiscidae (Sontowski et al., 2015), thus making it the most successful endosymbiont on earth. As expected, all infected specimens were for supergroups A and B, the most common in arthropods (Werren, Baldo & Clark, 2008).
The prevalence ofWolbachiawas particularly high in theD. aubeigroup, in which all sequenced populations were infected with the only exception of the Cantabrian Mountains, the westernmost area of distribution of the group. It is interesting that this group had also a marked contrast between the results of the mitochondrial and nuclear phylogenetic reconstructions, although with the current data it is not possible to establish a clear link between theWolbachiainfection and this discordance. Previous results, with a limited sampling, reported two mitochondrial groups east and west of the Rhone river ( García-Vázquez et al., 2016). This scenario was modified with the inclusion of additional samples from the margins of the distribution of the group, with the populations ofD. semirrufus
from Sicily and the central and southern Apennines joining the Iberian and Pyrenean clade (includingD. aubei sanfilippoiandD. delarouzei), and the populations ofD. aubeifrom the French Massif Central joining the Alpine and German Black Forest clade (includingD. semirrufusandD. aubei aubei). Thus, the mitochondrial data separated theD. aubeigroup in two main lineages north and south of latitude 44◦
N. On the contrary, nuclear data largely recovered monophyletic species, defined according to their external morphology and the male aedeagus (Fery & Brancucci, 1997). In the mitochondrial tree, the two subspecies of
D. aubei as defined with morphology were recovered in different clades, with the only exception of the populations of the French Massif Central and the Cevennes (west of the River Rhone), morphologically closer to the Pyrenean D. aubei sanfilippoi(Fery & Brancucci, 1997; H Fery, pers. comm., 2016) but grouped withD. aubei aubeifrom the Alps and south Germany. In the evolutionary history of the D. aubeigroup, there seem thus to be a first event leading to mitochondrial introgression and geographic isolation within
ACKNOWLEDGEMENTS
We especially thank all collectors mentioned in Table S1for their invaluable help in providing material for the study, and R Alonso and A Izquierdo for laboratory work. We also thank DT Bilton and LF Valladares for their help with the study ofDeronectes.
ADDITIONAL INFORMATION AND DECLARATIONS
Funding
DG-V had a FPI PhD grant from the Government of Spain. This work was partially funded by projects CGL2010-15755 and CGL2013-48950-C2-1-P to IR, and the ‘‘Secretaria d’Universitats i Recerca del Departament d’Economia i Coneixement de la Generalitat de Catalunya’’ (project SGR1532). The funders had no role in study design, data collection and analysis, decision to publish, or preparation of the manuscript.
Grant Disclosures
The following grant information was disclosed by the authors: Government of Spain.
Secretaria d’Universitats i Recerca del Departament d’Economia i Coneixement de la Generalitat de Catalunya: SGR1532.
Competing Interests
The authors declare there are no competing interests.
Author Contributions
• David García-Vázquez conceived and designed the experiments, performed the
experiments, analyzed the data, contributed reagents/materials/analysis tools, wrote the paper, prepared figures and/or tables, reviewed drafts of the paper.
• Ignacio Ribera conceived and designed the experiments, analyzed the data, contributed
reagents/materials/analysis tools, wrote the paper, prepared figures and/or tables, reviewed drafts of the paper.
DNA Deposition
The following information was supplied regarding the deposition of DNA sequences: Sequences were submitted to the EMBL database and are accessible in GenBank with accession numbersLT601818–LT602609(sequences of specimens of Deronectes) and LT602610–LT602633(sequences of the Wolbachia endoparasites).
Data Availability
The following information was supplied regarding data availability:
Supplemental Information
Supplemental information for this article can be found online athttp://dx.doi.org/10.7717/ peerj.2514#supplemental-information.
REFERENCES
Abellán P, Benetti CJ, Angus RB, Ribera I. 2011.A review of Quaternary range shifts
in European aquatic Coleoptera.Global Ecology and Biogeography20:87–100 DOI 10.1111/j.1466-8238.2010.00572.x.
Abellán P, Millán A, Ribera I. 2009.Parallel habitat-driven differences in the
phylo-geographical structure of two independent lineages of Mediterranean saline water beetles.Molecular Ecology18:3885–3902DOI 10.1111/j.1365-294X.2009.04319.x.
Abellán P, Ribera I. 2011.Geographic location and phylogeny are the main determinants
of the size of the geographical range in aquatic beetles.BMC Evolutionary Biology
11:344 DOI 10.1186/1471-2148-11-344.
Addo-Bediako A, Chown SL, Gaston KJ. 2000.Thermal tolerance, climatic variability
and latitude.Proceedings of the Royal Society B: Biological Sciences267:739–745 DOI 10.1098/rspb.2000.1065.
Andújar C, Serrano J, Gómez-Zurita J. 2012.Winding up the molecular clock in the
genusCarabus(Coleoptera: Carabidae): assessment of methodological decisions on rate and node age estimation.BMC Evolutionary Biology12:40
DOI 10.1186/1471-2148-12-40.
Baele G, Lemey P, Bedford T, Rambaut A, Suchard MA, Alekseyenko AV. 2012.
Improving the accuracy of demographic and molecular clock model comparison while accommodating phylogenetic uncertainty.Molecular Biology and Evolution
29:2157–2167DOI 10.1093/molbev/mss084.
Barraclough TG, Vogler AP. 2000.Detecting the geographical pattern of speciation from
species-level phylogenies.The American Naturalist155:419–434 DOI 10.1086/303332.
Bielejec F, Rambaut A, Suchard MA, Lemey P. 2011.SPREAD: spatial phylogenetic
reconstruction of evolutionary dynamics.Bioinformatics27:2910–2912 DOI 10.1093/bioinformatics/btr481.
Bilton DT, Mirol PM, Mascheretti S, Fredga K, Zima J, Searle JB. 1998.Mediterranean
Europe as an area of endemism for small mammals rather than a source for north-wards postglacial colonization.Proceedings of the Royal Society B: Biological Sciences
265:1219–1226DOI 10.1098/rspb.1998.0423.
Böhning-Gaese K, Caprano T, Van Ewijk K, Veith M. 2006.Range size: disentangling
current traits and phylogenetic and biogeographic factors.The American Naturalist
167:555–567DOI 10.1086/501078.
Brown JH. 1995.Macroecology. Chicago: University of Chicago Press.
Brown JH, Lomolino MV. 1998.Biogeography. Sunderland: Sinauer.
Calosi P, Bilton DT, Spicer JI. 2008.Thermal tolerance, acclimatory capacity and
Calosi P, Bilton DT, Spicer JI, Votier SC, Atfield A. 2010.What determines a species’ geographical range? Thermal biology and latitudinal range size relationships in European diving beetles (Coleoptera: Dytiscidae).Journal of Animal Ecology
79:194–204DOI 10.1111/j.1365-2656.2009.01611.x.
Dawson AG. 1992.Ice age earth: late Quaternary geology and climate. New York:
Routledge.
Dijkstra KDB, Monaghan MT, Pauls SU. 2014.Freshwater biodiversity and aquatic
insect diversification.Annual Review of Entomology59:143–163 DOI 10.1146/annurev-ento-011613-161958.
Drummond AJ, Rambaut A. 2007.BEAST: Bayesian evolutionary analysis by sampling
trees.BMC Evolutionary Biology 7:214DOI 10.1186/1471-2148-7-214.
Fery H, Brancucci M. 1997.A taxonomic revision ofDeronectesSHARP, 1882 (Insecta:
Coleoptera: Dytiscidae) (part I).Annalen des Naturhistorischen Museums in Wien. Serie B für Botanik und Zoologie99:217–302.
García-Vázquez D, Bilton DT, Alonso R, Benetti CJ, Garrido J, Valladares LF, Ribera I.
2016.Reconstructing ancient Mediterranean crossroads inDeronectesdiving beetles.
Journal of Biogeography43:1533–1545DOI 10.1111/jbi.12740.
Gaston KJ. 2003.The structure and dynamics of geographic ranges. Oxford: Oxford
University Press.
Gaston KJ. 2009.Geographic range limits of species.Proceedings of the Royal Society B:
Biological Sciences276:1391–1534DOI 10.1098/rspb.2009.0100.
Gaston KJ, Spicer JI. 2001.The relationship between range size and niche breadth: a
test using five species ofGammarus(Amphipoda).Global Ecology and Biogeography
10:179–188DOI 10.1046/j.1466-822x.2001.00225.x.
Hansen TA. 1980.Influence of larval dispersal and geographic distribution on species
longevity in neogastropods.Paleobiology 6:193–207 DOI 10.1017/S0094837300025756.
Hebert PD, Ratnasingham S, De Waard JR. 2003.Barcoding animal life: cytochrome c
oxidase subunit 1 divergences among closely related species.Proceedings of the Royal Society B: Biological Sciences270:S96–S99DOI 10.1098/rsbl.2003.0025.
Hewitt G. 2000.The genetic legacy of the Quaternary ice ages.Nature405:907–913
DOI 10.1038/35016000.
Homburg K, Drees C, Gossner MM, Rakosy L, Vrezec A, Assmann T. 2013.Multiple
glacial refugia of the low-dispersal ground beetleCarabus irregularis: molecular data support predictions of species distribution models.PLoS ONE8:e61185 DOI 10.1371/journal.pone.0061185.
Jablonski D. 1987.Heritability at the species level—analysis of geographic ranges of
Cretaceous molluscs.Science238:360–363DOI 10.1126/science.238.4825.360.
Jiggins FM. 2003.Male-killingWolbachiaand mitochondrial DNA: selective sweeps,
hybrid introgression and parasite population dynamics.Genetics164:5–12.
Katoh K, Toh H. 2008.Recent developments in the MAFFT multiple sequence alignment
Lanfear R, Calcott B, Ho SY, Guindon S. 2012.PartitionFinder: combined selection of partitioning schemes and substitution models for phylogenetic analyses.Molecular Biology and Evolution29:1695–1701DOI 10.1093/molbev/mss020.
Lemey P, Rambaut A, Drummond AJ, Suchard MA. 2009.Bayesian phylogeography
finds its roots.PLoS Computational Biology5:e1000520 DOI 10.1371/journal.pcbi.1000520.
Lester SE, Ruttenberg BI, Gaines SD, Kinlan BP. 2007.The relationship between
dispersal ability and geographic range size.Ecology Letters10:745–758 DOI 10.1111/j.1461-0248.2007.01070.x.
Losos JB, Glor RE. 2003.Phylogenetic comparative methods and the geography of
speciation.Trends in Ecology and Evolution18:220–227 DOI 10.1016/S0169-5347(03)00037-5.
Millán A, Sánchez-Fernández D, Abellán P, Picazo F, Carbonell JA, Lobo JM, Ribera I.
2014.Atlas de los coleópteros acuáticos en la España peninsular. Madrid: Ministerio de
Agricultura, Alimentación y Medio Ambiente, Centro de Publicaciones.
Nilsson AN. 2001.World catalogue of insects. Volume 3: Dytiscidae (Coleoptera).
Sten-strup: Apollo Books.
Nilsson AN, Hájek J. 2015.Catalogue of Palearctic Dytiscidae (Coleoptera).Update
distributed as a PDF file via Internet. version 1. I. 2015.Available athttp:// www2.emg. umu.se/ projects/ biginst/ andersn/ PAL_CAT_2015.pdf.
Petit RJ, Aguinagalde I, De Beaulieu JL, Bittkau C, Brewer S, Cheddadi R, Ennos R,
Fineschi S, Grivet D, Lascoux M. 2003.Glacial refugia: hotspots but not melting
pots of genetic diversity.Science300:1563–1565DOI 10.1126/science.1083264.
Purvis A, Gittleman JL, Cowlishaw G, Mace GM. 2000.Predicting extinction risk in
declining species.Proceedings of the Royal Society of London B: Biological Sciences
267:1947–1952DOI 10.1098/rspb.2000.1234.
Ribera I. 2003.Are Iberian endemics Iberian? A case-study using water beetles of family
Dytiscidae (Coleoptera).Graellsia59:475–502 DOI 10.3989/graellsia.2003.v59.i2-3.261.
Ribera I. 2008. Habitat constraints and the generation of diversity in freshwater
macroinvertebrates. In: Lancaster J, Briers RA, eds.Aquatic insects: challenges to populations. Wallingfort: CAB International, 289–311.
Ribera I, Barraclough TG, Vogler AP. 2001.The effect of habitat type on speciation rates
and range movements in aquatic beetles: inferences from species-level phylogenies.
Molecular Ecology 10:721–735.
Ribera I, Castro A, Díaz JA, Garrido J, Izquierdo A, Jäch MA, Valladares LF. 2011.
The geography of speciation in narrow-range endemics of the ‘‘Haenydra’’ lineage (Coleoptera, Hydraenidae,Hydraena).Journal of Biogeography38:502–516 DOI 10.1111/j.1365-2699.2010.02417.x.
Ribera I, Vogler AP. 2000.Habitat type as a determinant of species range sizes: the
Ribera I, Vogler AP. 2004.Speciation of Iberian diving beetles in Pleistocene refugia (Coleoptera, Dytiscidae).Molecular Ecology 13:179–193
DOI 10.1046/j.1365-294X.2003.02035.x.
Rosenfield JA. 2002.Pattern and process in the geographical ranges of freshwater fishes.
Global Ecology and Biogeography 11:323–332DOI 10.1046/j.1466-822X.2002.00287.x.
Sánchez-Fernández D, Aragón P, Bilton DT, Lobo JM. 2012.Assessing the congruence
of thermal niche estimations derived from distribution and physiological data. A test using diving beetles.PLoS ONE7:e48163DOI 10.1371/journal.pone.0048163.
Somero GN. 2005.Linking biogeography to physiology: evolutionary and acclimatory
adjustments of thermal limits.Frontiers in Zoology2(1)DOI 10.1186/1742-9994-2-1.
Sontowski R, Bernhard D, Bleidorn C, Schlegel M, Gerth M. 2015.Wolbachia
distribu-tion in selected beetle taxa characterized by PCR screens and MLSTdata.Ecology and Evolution5:4345–4353DOI 10.1002/ece3.1641.
Stevens GC. 1989.The latitudinal gradient in geographical range: how so many species
coexist in the tropics.The American Naturalist 133:240–256DOI 10.1086/284913.
Stillman JH. 2002.Causes and consequences of thermal tolerance limits in rocky
intertidal porcelain crabs, genusPetrolisthes.Integrative and Comparative Biology
42:790–796DOI 10.1093/icb/42.4.790.
Verdú JR, Lobo JM. 2008. Ecophysiology of thermoregulation in endothermic dung
beetles: ecological and geographical implications. In: Fattorini S, ed.Insect ecology and conservation. Kerala: Research Signpost, 1–28.
Werren JH, Baldo L, Clark ME. 2008.Wolbachia: master manipulators of invertebrate
biology.Nature Reviews Microbiology 6:741–751DOI 10.1038/nrmicro1969.
West-Eberhard MJ. 2003.Developmental plasticity and evolution. Oxford: Oxford
University Press.
Willis JC. 1926.Age and area.The Quarterly Review of Biology1:553–571
DOI 10.1086/394259.
Zhou W, Rousset F, O’Neill S. 1998.Phylogeny and PCR–based classification of
Wol-bachia strains using wsp gene sequences.Proceedings of the Royal Society of London B: Biological Sciences265:509–515DOI 10.1098/rspb.1998.0324.
Zug R, Hammerstein P. 2012.Still a host of hosts forWolbachia: analysis of recent data