A Work Project, presented as part of the requirements for the Award of a Master’s Degree in Economics from the NOVA – School of Business and Economics.
Reciprocity or Equity?
Analyzing the Drivers of Punishment and Reward
in a Public Good Game.
Evidence from Rural Rwanda.
Xaver Schenker
3128
A Project carried out under the supervision of: Assistant Professor Alexander Coutts.
Reciprocity or Equity?
Analyzing the Drivers of Punishment and Reward
in a Public Good Game
Evidence from Rural Rwanda.
∗
Xaver Schenker
†Abstract
This paper uses Public Good Games conducted in rural Rwanda to analyze the impact of rewards and penalties on the level of cooperation. Furthermore, this work elaborates whether the decisions to punish and reward are triggered equally. The results provide evidence, that the possibilities of rewarding and punishing a partner successfully increase cooperation levels. Moreover, evidence suggests, that reward and punishment decisions are based on di↵erent motivations. Sanctioning shows signs of being motivated by outcome preferences and perceived intentionality of a participant’s action. Results for reward suggest, that reciprocity based on intentionality and kindness of an action is the significant driver.
Keywords: Reciprocity, Inequity Aversion, Motivation, Punishment, Reward, Public Good Games, Field Experiment, Rwanda.
JEL Classification Numbers: C93, H41, D90.
∗I am very grateful to my advisor, Asst. Prof. Alexander Coutts, for the continuous support and guidance
provided during the thesis work and for o↵ering me the data he collected to work with for this thesis. This paper features a supplementary annex, which contains additional results and information regarding the data.
Introduction
The organization of society depends on a crucial part on the presence of public goods. Large quantities of individuals use public transport on a daily basis, drive their car on paved streets on the way to work, and benefit from public health systems. All the examples stated rely on the success of cooperation of the subjects involved. Once successfully implemented and running, these goods create positive externalities for others. The institutional provision of public goods in rural areas of the developing world cannot always be guaranteed. Therefore, the societies living in such areas often need to provide them themselves. For example, digging a well to access clean water in a remote village instead of walking for hours with heavy loaded buckets requires the action of a number of individuals. In the end, it betters the situation for the entire population. The success of such an endeavour requires individuals using their resources for the common good. Others may not contribute but still reap the fruits. Consequently, there exists an incentive to free-ride.
Public Good Games (PGG) mimic these situations in the lab and have extensively been used to study collective action problems where personal and public interests collide. The results from these experiments contribute to the understanding on the preferences individuals have regarding public goods and thus, derive advice on how to provide them. In standard PGG (see Ledyard, 1995) a group of subjects play a number of predefined games where in each round they receive an endowment and are faced with the simultaneous and anonymous decision to either keep the money in their own pocket or contribute to a public account. The contributions to the public account are multiplied by a factor smaller than the number of players1 and distributed equally to all the participants in order to simulate the positive
externalities arising from a public good. Experiments using repeated interaction between players have shown that initial contributions steadily decline and the amount of free-riders increases throughout the rounds (Chaudhuri, 2011). Therefore, to sustain cooperation various factors such as monetary and non-monetary punishment and reward, communication between participants, and monitoring, have been tested and shown to be e↵ective in the lab (see e.g. Fehr and G¨achter (2000), Ledyard (1995), and Masclet et al. (2003)). The standard economic assumption of rationality with individuals maximizing utility if they maximize their, contradicts costly punishing and rewarding as they both decrease a subject’s profit.
1The factor used needs to be smaller than the number of participants to reflect the collective action
problem as otherwise there would be a strict preference for investint to the public account and no incentive to retain the own endowment.
To rationalize and incorporate the decisions to punish or reward two streams of models have emerged and acquired vogue in explaining behavior. The type of models di↵er in the attributed drivers for the decisions to sanction or reward. One assumes preferences for distributional outcomes (Fehr and Schmidt, 1999) and the other intuition-based reciprocity (Falk and Fischbacher, 2006).
Results from the lab regarding punishment show high congruency with evidence from field experiments (Bandiera et al. (2005), Miguel and Gugerty (2004)). Reward as means to achieve cooperation has been studied much less in the lab environment and to the author’s knowledge has produced no substantial literature from the field. Also, the body of literature comparing both reward and punishment is not yet very dense. Understanding the mechanisms through which individuals decide to punish or reward to achieve cooperation, is essential for creating institutions. In addition, the insights gained from research should lead to institutions being better integrated in their contextual framework and beyond that, attribute them with more legitimacy in the eyes of the a↵ected population.
This paper analyzes one-shot PGG with field experiment data collected in the rural area of Rwanda’s Rusizi district. Using data from the field allows for real-world factors to influence the decisions and thus o↵ers valuable insight on how the players’ familiar environment influences their choices (Cardenas, 2003). This work contributes to the understanding of how punishment and reward work. Moreover, the prime focus is disentangling the drivers underlying the decisions to punish or to reward. Hence, this paper additionaly o↵ers valuable insights for creating institutions in the rural areas of Rwanda on how to incite cooperation that are widely accepted.
The results found in this paper confirm the findings from previous literature where individuals contribute significantly more than zero to the group account. This work also confirms that the opportunity to penalize defectors succeeds in achieving a higher level of cooperation. For the reward treatment, the results here are the same as for the penalty treatment. This contradicts the part of literature stating that reward as a tool to incite cooperation is ine↵ective, but confirms the other part of literature finding the same results as this work with respect to group account allocation. As for the mechanisms of punishment and reward, this paper finds that the two actions follow di↵erent demand functions. Penalizing appears to be motivated by a mixture of outcome- and intentions-based factors. The demand for reward is driven by reciprocal actions based on the intention of a partner’s action. This result is new and suggests that institutions providing public services are advised to implement di↵erent
strategies for sanctioning non-cooperators and rewarding good-intentioned cooperators. The remainder of this thesis is organized as follows: In the next section an overview of previous literature is presented before the following section describes the data and explains the experimental design. Following, the predictions evolving from theory are outlined before the subsequent section discusses the results found. The last section contains concluding remarks.
Literature Review
Public Good Games
Why individuals in a PGG cooperate and to which extent has been subject to a variety of research. Explanations include evidence from the lab, such as pure altruism (Palfrey & Rosenthal, 1998), and from the field, such as di↵erences in culture (Heinrich et al, 2005) and group composition (Greig & Bohnet, 2007).2 Standard game theory assuming profit
maxi-mizing individuals predicts zero contribution to the group account due to the marginal per capita return of every unit of money invested being <1. Nevertheless, subjects initially tend to cooperate. Repeated interaction causes contributions to decay towards a level of almost complete free-riding as predicted by the standard game theoretical model (Fehr & G¨achter, 2000).
A powerful tool to increase contribution levels and, in repeated games, deter free-riding and thus sustain cooperation, has shown to be the possibility of punishing defectors (see e.g. Fehr & G¨achter, 2002). G¨achter et al. (2008) vary the duration of interaction between participants in a lab experiment and find that in a game consisting of 50 rounds compared to the 10 round game, cooperation towards the later stages is sustained even without penalizing.3 Nikiforakis
and Normann (2008), varying the efficacy of penalties in a lab experiment, find that e↵ective punishment opportunities lead to higher levels of cooperation. Analyzing data from parents’ voluntary monetary contributions to schools in Kenya, Miguel and Gugerty (2004) find that if sanction opportunities are weak or inexistent, contributions to schools are significantly lower than in schools where sanctions are a credible threat.
Far less attention has been directed at costly rewards as means to incite and sustain
coopera-2For more inclusive explanations see e.g. Ledyard (1995), Andreoni (1990, 1995), and Fischbacher, G¨achter
and Fehr (2001).
tion. Moreover, the existing literature provides divergent results. Rand et al. (2009) compare reward and punishment treatment seperately and combined in finitely repeated games in the lab and find that all three treatments succeed in increasing and maintaining cooperation com-pared to the control group. Contributions to the public pot do not di↵er significantly across treatments. Opposed to sanctioning, the frequency of rewarding increases throughout the duration of the game. Sefton et al. (2007) compare the e↵ects of the same three treatments if groups switch from an initial sequence of standard public good games without the possi-bility to punish or to reward to one of the treatments. Contrary to Rand et al. (2009), they find that contributions with reward initially increase but then decrease incrementally until reaching a level even lower than the one achieved in the control group. Also, the frequency of punishing and rewarding declines steadily with duration of the game. The di↵erence in these results can be explained by the experimental setting of the two experiments. Whereas the subjects in Sefton et al. (2007) knew they were playing two sequences of 10 rounds, participants in Rand et al. (2009) were not informed on the duration of the game. Rand et al. (2009) justify their choice of not informing participants about the duration of the game through the more realistic framework emerging through such a setting. They argue that even though individuals may face one-shot settings in the real world, the majority of interactions occur with peers and families and thus without foreseeable end. Walker and Halloran (2004) use a one-shot public good game in the lab to compare reward and punishment and find that neither reward nor punishment result in a significant di↵erence of allocations compared to the control group.4 Sutter et al. (2010) vary the intensity of the reward and punishment
treat-ment (1:3 or 1:1 cost-impact ratio) additionally to testing the di↵erence between exogenously and endogenously determined institution type. They find that the low cost-high impact both trigger positive significant e↵ects on contributions, whereas for the low-leverage treatment only punishment efficiently increases cooperation.5
Summarizing, previous experiments have shown that credible punishment generally succeeds in increasing cooperation levels in both lab and field settings. The e↵ects of rewards in the
4Walker and Halloran (2004) additionally add a dimension of uncertainty where reward and punishment
are either certain or are carried out with a 50% chance. They therefore test 5 di↵erent treatments. The here mentioned results do not di↵er across the uncertain and certain treatment.
5Group members from the endogenous treatment were introduced to the options of either having none,
a punishing, or a rewarding institution. In a first stage subjects had to decide whether they participate in a costly vote (5% of the endowment) with non-voters not paying but having to accept any outcome. The leverage of the options o↵ered for voting was pre-determined by the experimenter. The result mentioned does not apply to high-leverage punishment in the endogenous chosen institution as this category was never voted for.
context of PGG are far less explored and provide both evidence for being e↵ective as well as having no significant impact, both in the short and in the long run.
Mechanisms
Another component of the literature attempts to investigate the drivers behind reward and punishment. There are two predominant types of models o↵ering an explanation for punishment and reward behavior. The first stream assumes punishment and reward decisions based on distributional concerns. Subject’s compare their earnings to the other group mem-bers’ incomes and experience inequality by either being better or worse o↵ than the others. Assuming that individuals derive disutility from inequality, Fehr and Schmidt (1999) develop a model of inequity aversion. This model holds, if and only if, the requirement of subjects’ strong enough aversion for inequality is met. On the basis of the experienced disutility from inequality, subjects are willing to forgo on parts of their material payo↵ and use costly pun-ishment or reward to o↵set unfair outcome distributions.
This theory finds support in the results of - amongst others - Sefton et al. (2007), Niki-forakis (2010), and Fehr and G¨achter (2000), where, the larger the negative deviation of a participant’s contribution from the group average, the heavier the sanctioning. These studies have in common that participants receive information on every group member’s contribution and then, based on the outcome distribution, decide on who to punish how much in order to decrease inequality. Furthermore, all the experiments use a stranger-matching protocoll in which group constellations are reshu✏ed after every round played in order to avoid reputation building.6 As punishment only influences the contribution in the following round, punishers
gain no pecuniary benefit from punishing other players. Therefore, this type of punishment is referred to as altruistic punishment (Fehr & G¨achter, 2002). Altruistic punishment stands in contrast to the antisocial punishment found in e.g. Sefton et al. (2007) and G¨achter et al. (2010). They found non-deniable significant quantities of punishment when the punished group member contributed more than average.
The second type of theories explain reciprocal punishment and reward based on motivations derived from beliefs about other player’s actions. Opposed to the model of Fehr and Schmidt (1999), these models attribute the choice to punish or reward to the intention motivating another’s action towards oneself. Representative for this stream of literature is the model
6Fehr and G¨achter (2000) use both a stranger- and partner-treatment, where the group constellation
developed by Falk and Fischbacher (2006). Their model extends Rabin’s (1993) model of fairness in order to be applicable to sequential move games. According to this model, a punishment or reward is triggered by the level of kindness or unkindness perceived by the subject. The kindness of an action is evaluated based on the outcome produced and the intention underlying it. An outcome - be it advantageous or disadvantageous to a subject - is evaluated on the possibilities the other player had. If the other player had no other option than playing an unfair outcome, the signalled intention is not bad and doesn’t result in punishment. Likewise, an outcome where the other player forgoes on own monetary payo↵ to leave the subject better o↵ than expected, is perceived as an intentional act of kindness and more likely to be rewarded. For this to hold, the model therefore assumes that subjects derive positive utility from a chosen reciprocal action.7
The aforementioned work by Nikiforakis (2010) also provides evidence for the validity of this theory. This model succeeds in explaining why low cost-low impact punishment occurs, even though subjects cannot reduce inequality by meting such penalties. Similarly, Falk et al. (2005) find low-impact punishment in a three personal prisoner’s dilemma game with options to punish from cooperators on defectors. This result is comparable, as a prisoners dilemma with punishment resembles a two-stage PGG using uniformal possibilities to cooperate or to defect (i.e. free-ride).
In an attempt to separate the motives behind punishment and reward in the lab, Masclet and Villeval (2008) compare efficient and unefficient reward and punishment separately in a partner- and stranger-matching protocol. By benchmarking the members contribution on both the average contribution and the subject’s allocation, they find evidence for both out-come and intention driven decisions to punish and reward. They furthermore find an emphasis intentions-based punishing and rewarding. Falk et al. (2008) use one-shot prisoner’s dilemma experiments with punishment opportunities to assess the intensity of the di↵erent drivers and find evidence for both theories, with retaliation motives (i.e. intentions-based punishment) appearing to be strong. In an experiment using 29 di↵erent games, Charness and Rabin (2002) find that the importance of inequality reduction as motivation for subjects is exaggerated and penalizing to reduce inequality occurs rarely even when punishing is free. Furthermore, they find that positive reciprocity appears to be a rather weak driver in people’s decisions. Much
7Dufwenberg and Kirchsteiger (2004) present a similar, more sophisticated Bayesian model, that
further-more allows for updating beliefs at every node of the game. As this paper analyzes the implications for a one-shot PGG, the implications thus are the same as with the model by Falk and Fischbacher (2006). This is why this model is not further elaborated in this paper.
more, subjects show a form of reciprocity by becoming less cooperative themselves if their peers appear less willing to sacrifice their own material benefits for the common good. The two lines of theories rationalizing punishing and rewarding behavior di↵er mainly in the interpretation where the motivation to reduce one’s own monetary payo↵ in order to pun-ish or reward another subject stems from. The outcome based model represented by Fehr and Schmidt (1999) assumes that individuals have distributional outcome preferences. If the outcome of a game deviates from an egalitarian result, subjects derive disutility and are -assuming strong enough inequity aversion - willing to punish or reward another player to counteract the inequality. The model by Falk and Fischbacher (2006) on the other hand, assumes that subjects increase utility through a reciprocal action. This model incorporates for one outcome preferences, but adds the factors of perceived intentionality and kindness to model the decision to punish or to reward. Therefore, punishment or reward occur if and only if an action of a player signals good or bad intention in combination with the outcome. The existing literature has found both motives to be useful to explain punishing and rewarding behavior. The emphasis of the motivation di↵ers across experiments.
Experimental Design
Data Collection & Experimental Design
The data used in this paper was collected by Coutts (2015) as part of an evaluation of community based health programs during three months in 2013. The games were con-ducted in 150 villages in the Rusizi district in Rwanda’s south-west bordering Burundi and the Democratic Republic of the Congo. The villages were randomly selected from a total of 598 villages in the district. The experiments were conducted on the first working day after the health survey. From the survey list, 12 individuals were randomly selected and given a ticket to participate in the games the next working day.8 The games were accompanied by
a brief questionnaire (see Appendix B) and instructions to the game explained in the local language of Kinyarwanda by local survey sta↵. To make sure participants understood the game, demonstrations and a full practice session were conducted.
The experimental design followed a standard format of a public good game as explained in
8An additional 8 individuals were randomly selected as back-ups for participants not showing up to the
game. In case of an individual not showing up the next working day substitute participants were tracked down in order to reach the necessary number of 12 participating subjects. The games took place in conditions that allowed for privacy of the participants such as school classrooms or individual’s houses. Anonymity and privacy of the decisions was emphasized.
the introduction over two rounds. In each round every individual received a real money endowment of 400 Rwandan Francs9 (RWF). Participants were then instructed to go to a
private area outside the room and decide on how much of the endowment to contribute to a public pot, that then would be multiplied by 3 and split among all participants, by deposit-ing the respective amount in a change purse. The rest of the endowment was kept on the person.10 After all participants had made their allocations and contributions were recorded
anonymously, the total amount of coins would be counted in front of all participants. The amount then was tripled and divided evenly among the 12 participants so that every partic-ipant could see.11 This is one round of the PGG.
The first round of the game serves as a baseline to assess the di↵erences in behavior to the second round. In the second round villages were randomly assigned to either the control or to one of three treatment groups. The three treatments were (1) a version that allowed for penalties, (2) a version that allowed for rewards, and (3) a version designed to measure uncertainty in public goods investments.12 The control group repeated the same game as in
the first round in the second round. In both the penalty and the reward design, participants played a two-stage public good game with the first stage consisting of the same as the first round as described in the preceding section. After the first stage, the total amount of contri-butions was announced. In the second stage, participants were randomly assigned a partner from their group. Subjects were not aware of the identity of their partner, but were informed about their own partner’s amount contributed to the public pot. Subjects then were allowed to anonymously choose to give a penalty (version 1) or a reward (version 2) to their respective partner. Their decision was noted and penalties (rewards) deducted (added) to the earnings, before being distributed to the participants.13
For the remainder of the paper only the control group and both the penalty and reward treatment with partner-matching will be used. The uncertainty treatment will not further be
94 x 100 RWF coins. In 2013 the approximate value of 400 RWF was 0.60 USD which according to the
2010/11 Integrated Household Living Conditions Survey (EICV3) comprises of more than an average day’s income for 45% of the Rusizi district population.
10Coutts (2015) notes that all individuals carry money on their person and hence, there was no risk of
having allocation decisions accidentally revealed.
11If necessary, amounts were rounded to the nearest 50 RWF.
12In the uncertainty version participants were faced with the decision to allocate their endowment between
their private purse and two di↵erent public purses. After decisions were made a coin was flipped to determine which purse would be multiplied by the factor of 5 and which by 1. Contributions then would be added up again and the sum split equally among the 12 participants. The result was announced with the return of the participants’ shares.
13Participants having received a penalty or reward would find a ticket in their envelope marked with an X
analyzed in this work.14
Theoretical Predictions & Strategy
Group Account Allocations The profit function ⇡C
i for an individual of the control group is displayed by Equation (1).
For every i2 [1, ..., n] and j 6= i 2 [1, ..., n 1],
⇡Ci = (e ci) + a n
X
j=1
(cj), (1)
with e being the endowment received in the beginning of every round and ci and cj the
individuals and other participants’ contribution to the public pot respectively. The marginal per capita return a (= 0.25) per investment is lower than 1 and thus, contributing to the public pot o↵ers a lower return than keeping the money in the own purse. Yet, the socially optimal outcome is reached if every group member contributes the maximum amount as 0<a<1<an .15 When reward and penalty options are available the payo↵ functions for individuals receive
two additional terms. Equation (2) and (3) show the profit functions for individuals in the penalty (2) and reward (3) treatment.
⇡Pi = (e ci) + a n
X
j=1
(cj) CP ⇤ Pi Pr, (2)
where CP (CP=50 RWF) denotes the cost of the penalty allotted to the partner (P i) and
Pr takes either the value 0 or 100 RWF if the subject received a penalty from the assigned
partner. And, ⇡iR = (e ci) + a n X j=1 (cj) CR⇤ Ri+ Rr, (3)
equally, with CR (=50 RWF) representing the cost of giving a reward R
i to the partner and
Rr receiving a reward (either 0 or 100 RWF). The standard game theoretical predictions
assume that individuals are rational and try to maximize their own payo↵. Thus, there exists a unique Nash equilibrium of zero contribution to the group account. As awarding a
14In the appendix B.XXXX the results of all regressions conducted in the following parts of this thesis are
added with the uncertainty treatment included.
penalty or a reward also strictly reduced a subject’s earnings, no sanctions and rewards can be expected. Hence, there exist unique subgame perfect equilibra of zero contribution and no rewards and penalties given.
Punishment and Reward Behavior
As shown by G¨achter et al. (2008), subjects learn throughout the duration of a finitely repeated game. These learning e↵ects a↵ect on the one hand the level of contribution, and on the other hand the use of sanctions (or rewards). A one-shot public good game as used in this paper, therefore o↵ers the advantage of assessing the intuitive driver of the decision to punish and reward. The restriction of only having the possibility of punishing or rewarding one randomly assigned anonymous partner furthermore allows to isolate the motives underlying punishment and reward.
Outcome-Based Motivation
Based on the theory of inequity aversion by Fehr and Schmidt (1999), a subjects utility function for one depends positively on the pecuniary payo↵ x received from the game, and negatively on the level of inequality emerging. Hence, for every i 2 [1, ..., n] and j 6= i 2 [1, ..., n 1], Ui(x) = xi ↵i 1 n 1 X j6=i max{xj xi, 0} i 1 n 1 X j6=i max{xi xj, 0}. (4)
Inequality may either be advantageous or disadvantageous - i.e. advantageous if the partner contributed more than the average of the group members or disadvantageous if the partner contributed less than the group members. The parameters ↵i and i measure the level of
disadvantageous (↵i) or advantageous ( i) disutility i receives based on the outcome. The
model assumes that i ↵i and 0 i < 1, meaning that the disutility from
disadvanta-geous inequality has a higher impact than advantadisadvanta-geous inequality and that subjects are not indi↵erent between having or giving away a unit of payo↵.16 The model assumes that player i
can observe every player j’s earnings x and compare them to the average. The experimental setting used in this thesis doesn’t allow for this. However, it is assumed, that by having the information on group average and the contribution of the randomly assigned partner, o↵ers
16On the distribution of ↵
the same amount of relevant information to assess the level of inequality as proposed by Fehr and Schmidt (1999).
As becomes clear from the model, subjects strictly prefer egalitarian outcomes. Therefore, in cases where subject, partner, and average contribution are equal, no punishment and reward is expected. The propensity to punish depends on the disadvantageous inequality aversion coefficient ↵i and the outcome distribution. Assuming a value of ↵i high enough for a
sub-ject to be bothered by inequality, punishment occurs when the partner contributed less than the group average and consequently benefits from a higher income. As for reward, the deci-sion depends on the advantageous inequality averdeci-sion coefficient i and the outcome of the
game. Thus, rewards are expected if the partner’s contribution exceeds the group’s average allocation to the public pot and the subject receives a higher income than the partner.17
The punishment and reward used in this experiment are most likely not capable of resolv-ing inequitable distributions due to the uniformity of the treatment. Nonetheless, due to the treatment being cost-e↵ective (50:100 RWF) inequality can be reduced and thus utility increased.
Intentions-Based Motivation
Using Falk and Fischbacher’s theory of reciprocity (2006), subjects likewise derive utility from the material payo↵ ⇡i, plus from reciprocal action (hereafter defined through the positive
constant ⇢i). The model takes the form of a finite extensive form game with two players
containing a set of nodes N . Every player i 6= j 2 [1, 2] chooses n 2 Ni with the game
ending in an end node f 2 F , resulting in the payo↵ ⇡i function for player i (equally, n2 Nj
resulting in ⇡j). An existential part of this model are the beliefs players have about other
player’s actions. Player i chooses her corresponding strategy from the strategy set si 2 Si
based on s0
i, denoting what i thinks j will choose, and s00i, what she believes j thinks she will
play. Hence, i’s utility can be written as
Ui(f, s00i, s0i) = ⇡i(f ) + ⇢i
X
n!f n2Ni
'j(n, s00i, s0i) i(n, f, s00i, s0i), (5)
17This holds for the case where the subject contributed less than the average as well as for the case when
the subject contributed more than the average. Due to the reward having a cost-impact ratio of 1:2, subjects succeed in decreasing inequality by rewarding the partner even though they might su↵er from the same disutility derived through the outcome of the group.
where the first part on the right side represents pecuniary utility derived from the payo↵ ⇡i
in end node f . The second term defined as the reciprocity utility by Falk and Fischbacher (2006), comprises of a kindness term 'j and a reciprocation term i. The kindness term 'j
captures the perception of j’s action’s kindness as a product of the intentionality of j’s action and the either advantageous or disadvantageous outcome for i. The kindness term is denoted as the product of #j(n, s00i, s0i) j(n, s00i, s0i) with j<0 as disadvantageous and j>0 as
advan-tageous outcome. The intention factor #j is evaluated based on j’s alternative strategies saj
that could have led to a di↵erent payo↵ for i and takes the value 1 if - in i’s eyes - player j had a true alternative, and otherwise 0 ✏i 1 capturing i’s concern for an equitable outcome.18
The reciprocation term i, captures i’s reciprocal response to the experienced kindness of j’s
action and takes the form of a reward if positive or a punishment if negative.
The two-stage public good game played in the second round in the experiment used for this paper, presents the simplest form of a sequential game. Every player has full information on the strategy set common to her and her partner and beliefs are formed after the baseline round. Therefore, participants in the game can assess the intentionality of their partner’s action in comparison to their own action. If a partner’s action is perceived as unkind, it has to be countered by a negative reciprocal response (i.e. punishment) in order to o↵set the experienced decrease in utility based on the expected payo↵. In the same way, an action perceived as kind leading to a higher payo↵ than expected with a positive reciprocal response increases utility. Therefore, if the theory of reciprocity holds, participants are expected to reward (punish) if the partner contributed more (less) than they did. Holding the intention factor constant, the larger the di↵erence between subject’s and partner’s contribution, the higher the expected probability for retaliative or rewarding behavior. No reciprocal action is expected if the contribution of the two partner is equal.
The existing literature has found a mixture of both motivations for punishment whereas rewarding mechanisms are little studied. Assuming that reward functions similarly to pun-ishment, evidence for both theories is predicted to be found.
18If ✏
i = 0 a subject only cares about the intentionality of an action whereas ✏i = 1 defines a player
only concerned about the consequences of an action. The latter would result in a model closer to Fehr and Schmidt (1999). The complete derivation of the intention factor # exceeds the limits for this thesis. The definition presented here captures the essence of the intentionality, for a more detailed explanation see Falk and Fischbacher (2006).
Results
Descriptive Results
Given the findings of Coutts (2015)19 regarding social learning during the data collection
process the villages with very unusual contribution patterns were also excluded from the analysis.20 Additionally, two villages for which the minimum number of 12 participants was
not reached plus villages with missing information regarding age and other control variables were also excluded from the analyitical part.21A total of 1284 participants from 107 villages
with the largest part (65 villages, 780 subjects) from the control group and penalty and reward treatment being equally represented (21 villages, 252 participants, respectively) form the basis of the analysis.
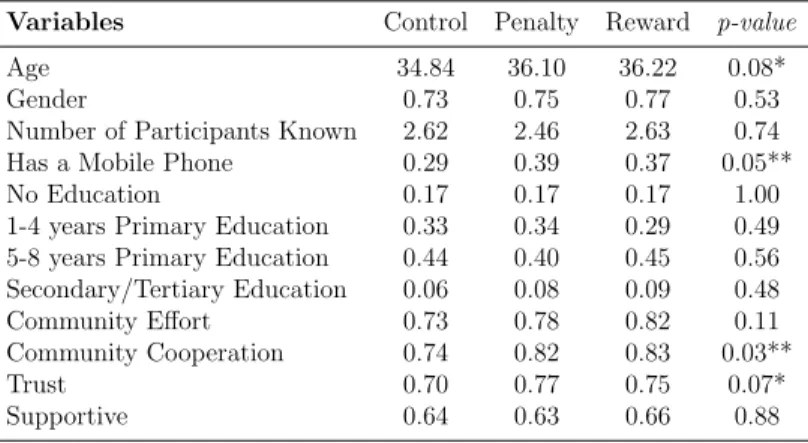
Table 1: Balance-Test of Sample Used for Analysis
Variables Control Penalty Reward p-value Age 34.84 36.10 36.22 0.08* Gender 0.73 0.75 0.77 0.53 Number of Participants Known 2.62 2.46 2.63 0.74 Has a Mobile Phone 0.29 0.39 0.37 0.05** No Education 0.17 0.17 0.17 1.00 1-4 years Primary Education 0.33 0.34 0.29 0.49 5-8 years Primary Education 0.44 0.40 0.45 0.56 Secondary/Tertiary Education 0.06 0.08 0.09 0.48 Community E↵ort 0.73 0.78 0.82 0.11 Community Cooperation 0.74 0.82 0.83 0.03** Trust 0.70 0.77 0.75 0.07* Supportive 0.64 0.63 0.66 0.88
Parametric test to compare means of control and treatment groups. Gender is a dummy that takes the value 1 if the participant is female. Community E↵ort is a dummy that takes value 1 if respon-dents agree that the community are willing to put their own e↵ort in to improving things for the com-munity, and zero if they either disagree or neither agree nor disagree. Community E↵ort is a dummy that takes value 1 if respondents agree that the community are willing to put their own e↵ort in to improving things for the community, and zero if they either disagree or neither agree nor disagree. Community Cooperation is also a dummy that takes value 1 if respondents agree that the community generally cooperates with one another on issues that a↵ect the community. Trust and Supportive are dummies that take on value 1 if subjects think people generally can be trusted / generally are sup-portive of each other.
Comparing the means of the control variables across control and treatment groups through
19Coutts (2015) found that contributions with the duration of the data collection increased within sectors
due to information travelling from village to village. Participants in villages visited later seemed to have learned from previous villages that the higher the contributions the higher the payo↵ for participants.
20As unusual contributions I regard villages where in both rounds every villager (or 11 out of 12) contributed
the maximum amount possible. The total of 10 villages were all part of the control group and within the top 3% of average village contribution in the sample. Results including these villages can also be found in the appendix (B.XXXX).
21The 7 villages excluded due to missing data all had at least 2 or more values missing. The analysis in
the appendix does not include these villages as they in anyway would have been excluded from the analysis due to the missing data.
a parametric test (see Table 1) shows that the sample is largely balanced. Subjects in the sample are on average 35.35 years old. As seen in Table 1, age is slightly unbalanced with an average di↵erence of 1.26 and 1.38 years respectively. This di↵erence in age is marginal, but can be controlled for in analysis of the results. The possession of mobile phones is also unbalanced at a 5% level. The percentage of the population owning a mobile phone is for all groups lower than for the average individual from the Rusizi district (49%).22 Community
Cooperation is unbalanced at the 5% level as well and hence will serve as a control in the regressions conducted further on, same as Trust.
Group Account Allocations
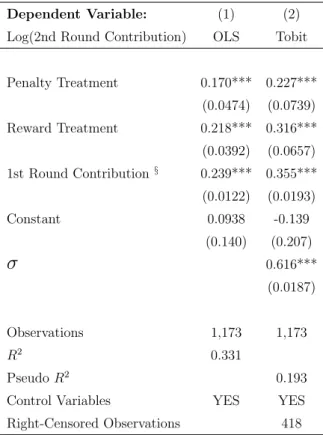
Table 2: Percentage-Points Change by Treatment Dependent Variable: (1) (2) Log(2nd Round Contribution) OLS Tobit
Penalty Treatment 0.170*** 0.227*** (0.0474) (0.0739) Reward Treatment 0.218*** 0.316*** (0.0392) (0.0657) 1st Round Contribution§ 0.239*** 0.355*** (0.0122) (0.0193) Constant 0.0938 -0.139 (0.140) (0.207) 0.616*** (0.0187) Observations 1,173 1,173 R2 0.331 Pseudo R2 0.193
Control Variables YES YES Right-Censored Observations 418
Penalty Treatment and Reward Treatment are dummy variables. The is the estimated standard error of the regression. Village clustered standard errors in parentheses, with *** p<0.01, ** p<0.05, * p<0.1.
§in 100 RWF.
As expected by the accounts of pre-vious experiments, there is a large de-viation from the game theoretically pre-dicted unique Nash equilibrium of zero allocation to the group account. Con-tributions to the public pot in the first round amount to 249.76 RWF on av-erage across the treatment and control groups which represents 62.44% of the initial endowment.
Coutts (2015) found that participants’ contribution within sectors increased in the visiting order while collecting the data. This is why even after exluding villages with unusual contribution pat-terns, results were expected to be at the upper end of usual group allocations ob-served in public good experiments. The results found here are in line with exist-ing literature (e.g. Ledyard, 1995), ex-pecting contributions initially to range
between 40%-60% of the endowment. A non-parametric Kruskal-Wallis (df: 2, p>0.5768)
test shows no significant di↵erence between control and treatment groups’ allocation.
Analyzing the results of the second round (see Table A1, Appendix) it is evident, that both the reward (278.17 RWF, on average) and the punishment (269.04 RWF, on average) treatment succeed in significantly increasing cooperation. At the same time. the contribution from the control group decreases by 11.65% on average. A Kruskal-Wallis test (X2= 42.919,
p>0.0001) strongly rejects the hypothesis of the levels of contributions being equal. Equally, the results in Table 2 column (1) indicate that both treatments have a positive significant impact on the contribution behavior in the second round. Looking at the frequency distri-bution of the contridistri-bution possibilities (see Histogram in Appendix: Figure 1), the sample appears to have an accumulation point on the right side. This may have partially been caused by the social learning discovered by Coutts (2015), but may also be due to the level of co-operation a large amount of individuals are willing to display. To do justice to players that if it weren’t for the upper contribution limit had contributed even more, a Tobit regression is conducted. Controlling for the truncation from above, the penalty and reward treatment succeed in increasing contribution to the group accounts by 22.7% and 31.6%, respectively. A Mann-Whitney-U test (p>0.3632) fails to reject the hypothesis that the two treatments impact second round contribution equally.Therefore, reward has a larger impact on the level of contributions than the penalty treatment. The leverage of the penalty and the reward is sufficiently large to pose a credible threat (resp. premium) that a socially more benefitial outcome is accomplished. These results stand in contrast to the findings of Walker and Hal-loran (2004), who found no significant changes in group allocation using one-shot public good games. These findings are in as much in line with Rand et al. (2009), in that both reward and treatment succeed in increasing cooperation already at the first stage of availability of these options. The results are congruent with Sefton et al. (2007) finding that reward initially causes higher contributions than punishment.
Outcome vs. Intentions-Based
In order to assess whether the decision to punish or reward is motivated by distributional preferences or as reciprocal response to a perceived level of kindness, the partner’s contribution is put in relation to both the group average contribution to the public pot and the subject’s contribution. The results in Table 3 use as a benchmark a partner contributing the exact average amount of the group and the same amount as the subject, respectively, and show the marginal e↵ects of the variables on the propensity to reward or punish the randomly assigned
partner.
Comparing columns (1) and (2) shows that the propensities for punishment and reward are influenced in opposite directions by the determinants. Subjects confronted with the decision to punish or reward possess all the required information to assess the kindness of a part-ner’s action. Much like predicted by the model of Falk and Fischbacher (2006), an absolute negative deviation from the partner’s contribution to the subjects contribution significantly increases the propensity to punish. The mechanism triggering the retaliation is strongly influ-enced by the di↵erence between the two contributions. A larger di↵erence given the available strategy set of cooperation [0,400], signals higher intentionality, which in combination with experienced hypothetical loss of possible payo↵ evokes the perception of the partner’s action as unkind. Therefore, a negative reciprocal reply succeeds in increasing the utility of the subject. This is in line with the model of reciprocal theory. On the other hand, the abso-lute negative deviation between partner’s and subject’s contribution decreases the partner’s probability of receiving a reward. Following the same line of argument as with punishment, a negative di↵erence between a partner’s and a subject’s contribution can not be perceived as a kind action. As players’ only reciprocal tool in the reward treatment is a positive an-swer, the probability of rewarding the partner decreases significantly with the intensity of the perceived unkindness of an action. This confirms the concern withdrawal stated in Charness and Rabin (2002) that subjects with less cooperative partners reduce their willingness to reward such an action. The e↵ects for a positive deviation of a partner’s contribution to the participant’s contribution show the expected signs but are insignificant for both the reward and the punishment treatment.
As for the reward treatment, the level of the first round contribution shows a significant positive impact on the probability to reward. One might therefore argue that individuals with more altruistic giving preferences have a higher propensity to reward. In order to assess the di↵erence between selfish and generous participants two sub samples are created.
T ab le 3: D ep en d en t V ar ia b le : P ro p en si ty to P u n is h & R ew ar d w it h He te ro ge n eo u s E ↵ ec ts D e p e nde n t V a ri a bl e : P ro p e ns it y T o ta l Sa m pl e G e ne ro us Sub je ct Se lfis h Sub je ct to P uni sh / R e w a rd (1) (2) (3) (4) (5) (6) In d ep en d en t V ar ia bl es (i n 10 0 R WF) P en al ty R ew ar d P en al ty R ew ar d P en al ty R ew ar d P ar tn er ’s Ne g. D ev . fr om S u b je ct ’s C on tr ib u ti on 0. 09 91 ** -0 .0 47 0* 0. 13 8* * -0 .0 66 5 0. 05 85 -0 .0 08 85 (0.0466) (0.0268) (0.0601) (0.0533) (0.0544) (0.0507) Pa rt n er ’s Po s. D ev . fr om S u b je ct ’s C on tr ib u ti on N -0. 0237 0. 00331 0. 00781 -0. 0411 -0. 0131 (0.0264) (0.0240) (0.0472) (0.0297) (0.0371) P ar tn er ’s Ne g. D ev . fr om Av er ag e C on tr ib u ti on 0. 16 0* ** -0 .1 00 ** 0. 21 1* ** -0 .0 29 5 0. 11 8* -0 .2 17 ** * (0.0554) (0.0408) (0.0787) (0.0959) (0.0633) (0.0811) P ar tn er ’s P os . D ev . fr om Av er ag e C on tr ib u ti on 0.2 02 ** * 0. 08 60 0. 26 5* ** 0. 17 0 0. 15 2* * 0. 03 66 (0.0550) (0.0527) (0.0665) (0.118) (0.0776) (0.0794) Vi ll ag e Av er ag e C on tr ib u ti on 2n d R ou n d § 0.0478 0.0622 0.00790 0.0905 0.0887 0.0318 (0.0868) (0.0460) (0.0965) (0.118) (0.118) (0.0715) 1st Round Con tribution § 0.00646 0.0397 *** 0.0556 0.0570 0.00467 0.0776** (0.0273) (0.0152) (0.0963) (0.0646) (0.0521) (0.0384) Observ ations 252 252 128 103 124 126 X 2 32.63 102.5 33.38 36.25 12.61 33.45 Pr ob >X 2 1.23e-05 0 8.86e-06 8.46e-07 0.0496 8.60e-06 Logi t m ar gi n al e↵ ec ts w it h Vi ll age cl u st er ed st an d ar d er ror s in p ar en th es es , w it h *** p < 0. 01, ** p < 0. 05, * p < 0. 1. G en er ou s S u b je ct re fe rs to a su b je ct h av in g con tr ib u te d m or e th an av er age in th e fi rs t rou n d of th e gam e w h er eas th e S el fi sh S u b je ct con tr ib u te d le ss th an av er age in th e fi rs t. N In col u m n (4) , 23 ob se rv at ion s w h er e P ar tn er ’s d ev iat ion fr om S u b je ct ’s con tr ib u ti on is p os it iv e ar e d rop p ed as th ey p re d ic t re w ar d in g p er fe ct ly . §in 100 R W F .
The sample of individuals in columns (3) and (4) contributed strictly more than the group average in the first round, whereas the participants in column (5) and (6) contributed strictly less than the average in the first round. This division certainly leaves a margin for error in assessing the level of altruism of the players closest to both sides of the average contribution but fulfills its job the larger the deviation from the average. A Chow test to validate that the coefficients are the same for the sub-samples for both reward and penalty treatment fails to reject the hypotheses of equality (reward: df: 5, p>0.3580; penalty: df: 6, p>0.8706). Nonetheless, valuable insights are gained from this exercise: In column (4), 23 observations are dropped as they perfectly predict the outcome of the dependent variable. In other words, every subject in the reward sample having contributed more than average in the first round and whose partner contributed more than them rewarded their partner. This result counters the findings of Charness and Rabin (2002) that positive reciprocity is no strong driver at least partially. Depending on the preferences of an individual positive reciprocality appears to be the default option that deters with unkind actions, and hence causes an unwillingness to play the default strategy option.23 In column (6), an absolute negative devation of the partner’s
contribution from the average contribution decreases the propensity to reward significantly. This result is in line with the result of the analysis of the total sample. Furthermore, this result is intuitive as more selfish subjects are expected to have a lower propensity of rewarding their partner. The significant positive coefficient of the first round contribution in column (6) only has reduced validity as, by definition, the first round contribution of subjects in this sub-sample is lower than the first round average contribution of the village. Besides that, this result is in line with the evidence obtained from the total sample in column (2).
Going back to columns (1) and (2), the regressions show that using the group average as a benchmark, a partner’s absolute negative deviation provokes the e↵ects as expected by Fehr and Schmidt’s (1999) model. A partner contributing less than the group average causes disadvantageous inequality in the distribution of incomes and reduces a subject’s utility. If, as assumed by Fehr and Schmidt (1999), the inequity aversion in a player is strong enough, he may want to forgo on parts of his income and mete a costly punishment. The result in column (1) confirms this. Disadvantageous inequality emerging in the reward treatment trig-gers the same emotions but as there is no tool to decrease inequality the probability of using an instrument that would further increase inequality becomes less likely (see column (2)).
23As the 23 observations predicting rewarding perfectly are dropped, the coefficients of the regression for
the generous sub-sample are underestimated. Therefore, an analysis of these results produces no additional value.
As for the positive deviation from a partner’s contribution to the group average allocation, the results in column (2) for reward are also in accordance with the inequity aversion model. Fehr and Schmidt (1999) assume, that the level of disutility derived from disadvantageous inequality exceeds the level experienced through advantageous inequality ( i ↵i). It hence
is within the explainable outcomes of the model that the sign of the coefficient is positive but insignificant.
In column (1) of Table 3 a positive deviation from the partner’s contribution to the average village contribution increases the propensity to punish significantly. This result is not explain-able by the inequity model. Nevertheless, this result is not uncommon in existing literature. Falk et al. (2005) found substantial antisocial punishment with a high-sanction condition in their three person public good game.24 In their treatment using a strategy method25to decide
over punishment they observed 34% of the defectors punishing cooperators and 6.8% of the cooperators sanctioning other cooperators. Punishment, when the partner contributed more or the same as average, occurs 24 times in the sample used for this paper. Out of these 24 ob-servations, half are defectors (i.e. contributing less than average) punishing cooperators and the other half cooperators penalizing other cooperators26 (see Table blabla in the Appendix
B-XXX). Both sorts of sanctions not only fail to reduce inequality but moreover increase it. In the case of cooperators punishing cooperators, both the punishing subject and the partner experience inequality with regard to the group. It can be conjectured, that this malicious punishment is caused by frustration over the group’s behavior. Given that 19.67% of total punishment occurs between cooperators and another 19.67% from defectors on cooperators, shows that both models fail to capture an existential part of punishment behavior.
The section above has provided evidence that both motives seem to be present in reward and punishment behavior. Creating interaction terms with the determinants used should prove helpful in separating the two motives. Table 4 sums up the results found using inter-action dummies. The benchmark for the coefficients is a partner contributing strictly less than the average and strictly less than the subject. The probability of being punished is the highest if the partner contributed less to the group account than the punisher and less than the group average as shown by the significant negative coefficients on all three other dummy
24For other examples of antisocial punishment see Sefton et al. (2007), and G¨achter et al. (2010). 25In the strategy method subjects have to decide beforehand how to punish cooperators or defectors. The
advantage is that fairness concerns can be measured better, whereas emotional reactions are not very well captured with this method.
26There are two subjects that contributed the exact average amount of the village. They are classified as
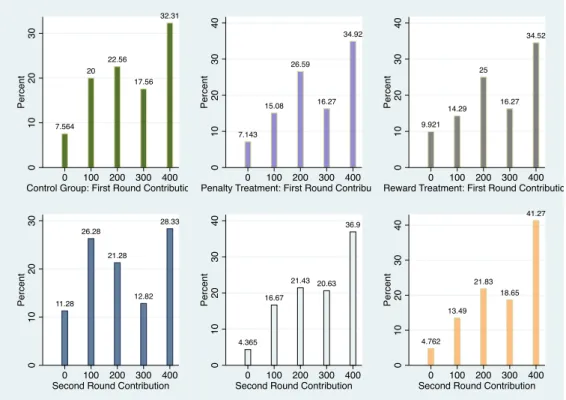
Table 4: Marginal E↵ects with Interaction Terms
(1) (2) Dependent Variable: Propensity to Penalty Reward Partner Contributed Average and Subject -0.183** 0.409*** (0.0865) (0.0792) Partner Contributed Average and <than Subject -0.110* -0.0183
(0.0651) (0.0797) Partner Contributed <Average and Subject -0.155*** 0.126*** (0.0600) (0.0347) Village Average Contribution 2nd Round§ 0.0198 0.0104
(0.0894) (0.0410) 2nd Round Contribution§ 0.0240 0.0381* (0.0379) (0.0220) 1st Round Contribution§ 0.0116 0.0361** (0.0225) (0.0149) Observations 252 252 X2 13.31 26.28 Prob>X2 0.0383 0.000197
Logit marginal e↵ects with village clustered standard errors in parentheses, with *** p<0.01, ** p<0.05, * p<0.1.
§in 100 RWF.
variables. The coefficient for the partner’s contribution exceeding the average contribution but not the subject’s contribution is an indicator for outcome-based motivation to punish. If the partner contributed more than the village average, he was not responsible for possible disadvantageous inequality arising towards the group and thus, doesn’t have to fear retali-ation because of distributional preferences. The coefficient in the first row of column (1) is evidence, that antisocial punishment is less likely to occur than ”justified” punishment. As seen previously, antisocial punishment has occured and also occurs in this setting. The drivers of this behavior cannot be explained by either of the theories presented but the results imply the advice, that in order to avoid (antisocial) punishment higher cooperative levels might be just the right strategy. The most significant decrease in the propensity to receive punishment arises when the partner contributed more than the subject but less than average. This result supports the theory of reciprocity by Falk and Fischbacher (2006) and Bolton and Ockenfels (2008) that model self-centered ideas of fairness. The choice to penalize in a public good setting seemingly follows a mixture of outcome- and intuition-based demand.
Interestingly, the results for the reward treatment suggest that the demand for rewarding fol-lows a more straight-forward pattern. Starting from the bottom, the significant and positive coefficients for the first and second round contribution confirm the findings from above, that more generous subjects have a higher propensity to reward. Analyzing the coefficients of the three interaction dummies clearly shows, that demand is motivated by rewarding good
inten-tions and that concerns for the outcome distribution are secondary at most. If distributional outcomes were of big concern, the coefficient for a partner contribution above average but below a subject’s contribution would have to be positive and significant. Subjects deciding to reward measure the action of a partner in relation to their own actions and consequently reward good behavior. In this setting, a partner contributing more than the subject shows good intentions and provides the rewarder with a better payo↵ than she would have experi-enced if the partner had played the same strategy as her. Therefore, the action is perceived as kind and the probability of receiving a reward increases significantly. Furthermore, the results suggest that subjects display a form of humility by acknowleding the inferiority of their decision if average and partner contribution are higher and thus respond with positive reciprocal action.
Conclusion
This paper conducts public good experiments using field data collected in the rural Rusizi district in Rwanda’s south-west. PGG are widely used to evaluate the extent of cooperative behavior of individuals in a collective action problem. A collective action problem arises because every individual has an incentives to free-ride due to the marginal per capita return of an investment for a public good being lower than 1, but the realization of the project depends on the success of inciting a sufficient level of cooperation that the funds required are achieved. Especially in the rural context of developing countries where public goods are generally under-provided, the insights gained from such experiments yield valuable advice for the implementation of well-integrated institutions. Previous research has shown that co-operation levels decrease in repeated interaction between individuals and thus attributed a lot of attention to instruments inciting and sustaining cooperation. Whereas the availability of punishment is widely recognized as a powerful tool to achieve high levels of contribution to a public good, literature regarding rewards is comparably scarce and produces diverging results. Another body of literature attempts to explain the mechanisms of punishment and reward. There are two main strands of models either assuming a decision being made based on outcome preferences (e.g. Fehr and Schmidt, 1999) or behavior emerging from satisfaction of reciprocal action (e.g. Falk and Fischbacher, 2006). Understanding the drivers underly-ing punishment and reward behavior elicits further implications for the institutional settunderly-ing preferred in a specific environment. The emphasis of this paper lies in analyzing the level of success of punishment and reward possibilities on inciting cooperation and determining
the motivations underlying penalty and reward decisions and hence o↵er useful evidence for public good provision in rural Rwanda.
In a first step, this paper finds that contributions to the group account in the first round do not di↵er across treatments and are significantly higher than zero amounting to 62.44% on average. Whereas contributions to the group account for the control group in the second round decrease, both the penalty and reward treatment significantly and successfully manage to increase contributions. In comparison to the control group, penalty and reward possibil-ities yield in 22.7% and 31.6% higher contribution levels. Moreover, there seems to be no significant di↵erence on the e↵ect on contributions between the two treatments.
The experimental setting used in this work allows for the punishment or reward of one ran-domly assigned partner. To assess the drivers behind a punishment and reward decision the partner’s contribution level is benchmarked on the group average and the subject’s contribu-tion level. The results obtained in the analysis suggest that both outcome-based preferences and intentions-based reciprocality influence the decision of a subject. By creating interaction between the two possible motivations stated in the models, this paper is capable of disen-tangling the the two drivers. The results from this method used provide evidence, that the decisions to punish and to reward are carried by di↵erent drivers. The choice to mete a penalty appears to be a product of outcome distribution preferences and willingness to retali-ate. Yet, and in accordance with other research, a significant part of (anti-social) punishment is captured by neither of the model. A possible explanation is that subjects choose spiteful punishment towards their innocent partner to vent their frustration with the other group members’ behavior. The results for the reward treatment provide evidence, that the choice between rewarding and not rewarding a partner is a reciprocal action. Outcome preferences are only significant in the sense that they influence the perception of kindness and intention-ality of a partner’s action. Hence, subjects choose to reward kind and intentional actions, but significantly reduce their willingness to reward if their partner displays unfair intentions. The provided evidence that the mechanisms at play for reward and treatment appear to di↵er is new and o↵ers interesting implications for the institutional framework. An well-integrated institution willing to provide a public good should therefore implement a set of rules regard-ing sanctions and rewards that takes into account the di↵erent drivers. This paper suggests, that testing the hypothesis of reward and punishment being triggered by di↵erent motives deserves more attention. Further research could provide results that suggest support for these findings in a di↵erent environment than the rural Rusizi district.
References
Andreoni, J. (1995). Cooperation in Public-Goods Experiments: Kindness or Confusion? The American Economic Review, Vol. 85, 4:891-904.
Andreoni, J. (1990). Impure Altruism and Donations to Public Goods: A Theory of Warm-Glow Giving. The Economic Journal, Vol. 100, 401:464.477.
Bandiera, O., Barankay, I. & Rasul, I. (2005). Cooperation in Collective Action. Economics of Transition, Vol. 13, 3:473-498.
Bolton, G. & Ockenfels, A. (2008). Self-centered fairness in games with more than two players. Hand-book of Experimental Economics Results, Vol. 1:531-540.
Cardenas, J. (2003). Real Wealth and Experimental Cooperation: Experiments in the Field Lab. Journal of Development Economics, 70:263-289.
Charness, G. & Rabin, M. (2002). Understanding Social Preferences with Simple Tests. The Quarterly Journal of Economics, Vol. 117, 3:817-869.
Chaudhuri, A. (2011). Sustaining Cooperation in Laboratory Public Goods Experiments: A Selective Survey of the Literature. Experimental Economics 14:47-83. doi: 10.1007/s10683-010-9257-1
Coutts, A. (2015). Social Learning in Experimental Games: Evidence from Rwanda. Novafrica Seminar Series.
Dufwenberg, M. & Kirchsteiger, G. (2004). A Theory of Sequential Reciprocity. Games and Economic Behavior, 47:268-298.
Falk, A. & Fischbacher, U. (2006). A Theory of Reciprocity. Games and Economic Behavior, 54:293-315. Falk, A., Fehr, E. & Fischbacher, U.(2008). Testing Theories of Fairness - Intentions matter. Games
and Economic Behavior, 62:287-303.
Falk, A., Fehr, E. & Fischbacher, U. (2005). Driving Forces behind Informal Sanctions. Econometria, Vol. 73, 6:2017-2030.
Fehr, E. & G¨achter, S. (2002). Altruistic Punishment in Humans. Nature, Vol. 415, 137-140.
Fehr, E. & G¨achter, S. (2000). Cooperation and Punishment in Public Goods Experiments. The American Economic Review, Vol. 90, 4:980-994.
Fehr, E. & Schmidt, K. (1999). A Theory of Fairness, Competition, and Cooperation. The Quarterly Journal of Economics, Vol. 14, 3:817-868, doi: 10.1162.003355399556151.
Fischbacher, U., G¨achter, S. & Fehr, E. (2001). Are people conditionally cooperative? Evidence from a public goods experiment. Economic Letters, Vol. 71, 3:397-404.
G¨achter, S., Herrmann, B. & Th¨oni, C. (2010). Culture and Cooperation. Philosophical Transactions of the Royal Society B, 365:2651-2661. doi: 10.1098/rstb.2010.0135
G¨achter, S., Renner, E. & Sefton, M. (2008). The Long-Run Benefits of Punishment. Science, Vol. 322, 5907: 1510.
Greig, F. & Bohnet, I. (2009). Exploring gendered behavior in the field with experiments: Why public goods are provided by women in a Nairobi slum. Journal of Economic Behavior & Organization, 70:1-9. Henrich, J., Boyd, R., Bowles, S., Camerer, C., Fehr, E., Gintis, H., McElreath, R., Alvard, M., Barr, A., Ensminger, J., Smith-Henrich, N., Hill, K., Gil-White, F., Gurven, M., Marlowe, F., Patton, J. & Tracer, D. (2005). ”Economic man” in cross-cultural perspective: Behavioral experiments in 15 small-scale societies. Behavioral and Brain Sciences, 28:795-855.
Ledyard, J. (1995). ”Public Goods: A Survey of Experimental Research” in Kagel, J., Roth, A. (eds.), The Handbook of Experimental Economics, Princeton: Princeton University Press, 111-194.
Masclet, D. & Villeval, M. (2008). Punishment, Inequality, and Welfare: A Public Good Experiment. Social Choice and Welfare, 31:475-502.
Masclet, D., Noussair, C., Tucker, S. & Villeval, M. (2003). Monetary and Nonmonetary Punishment in the Voluntary Contributions Mechanism. American Economic Review, 83:366-380.
Miguel, E. & Gugerty, M. (2004). Ethnic diversity, social sanctions, and public goods in Kenya. Jorunal of Public Economics, 89:2325-2368.
Nikiforakis, N. (2010). Feedback, punishment and cooperation in public good experiments. Games and Economic Behavior 68:689-702.
Nikiforakis, N. & Normann, H. (2008). A comparative statics analysis of punishment in public-goods experiments. Experimental Economics, Vol. 11, 4: 358-369.
Palfrey, T. & Rosenthal, H. (1998). Private incentives in social dilemmas: the e↵ects of incomplete in-formation on altruism. Journal of Public Economics, Vol. 35:309-332.
Rabin, M. (1993). Incorporating Fairness intoGameT heoryandEconomics.AmericanEconomicRe view, 83 : 1281 1302.
Rand, D., Dreber, A., Ellingsen, T., Fudenberg, D. & Nowak, M. (2009). Positive interactions promote public cooperation. Science, 325(5945):1272-1275. doi: 10.1126/science.1177418.
Sefton, M., Shupp, R. & Walker, J. (2007). The E↵ect of Rewards and Sanctions in Provision of Public Goods. Economic Inquiry, Vol. 45, 4:671-690
Sutter, M., Haigner, S. & Kocher, M. (2010). Choosing the Carrot or the Stick? Endogenous Insti-tutional Choice in Social Dilemma Situations. The Review of Economic Studies, Vol. 77, 4:1540-1566. Walker, J. & Halloran, M. (2004). Rewards and Sanctions and the Provision of Public Goods in One-Shot
Appendix A
Figure 1: Histogram of the Group Account Allocations Across Treatments
7.564 20 22.56 17.56 32.31 0 10 20 30 Pe rce n t 0 100 200 300 400 Control Group: First Round Contribution
7.143 15.08 26.59 16.27 34.92 0 10 20 30 40 Pe rce n t 0 100 200 300 400 Penalty Treatment: First Round Contribution
9.921 14.29 25 16.27 34.52 0 10 20 30 40 Pe rce n t 0 100 200 300 400 Reward Treatment: First Round Contribution
11.28 26.28 21.28 12.82 28.33 0 10 20 30 Pe rce n t 0 100 200 300 400 Second Round Contribution
4.365 16.67 21.43 20.63 36.9 0 10 20 30 40 Pe rce n t 0 100 200 300 400 Second Round Contribution
4.762 13.49 21.83 18.65 41.27 0 10 20 30 40 Pe rce n t 0 100 200 300 400 Second Round Contribution
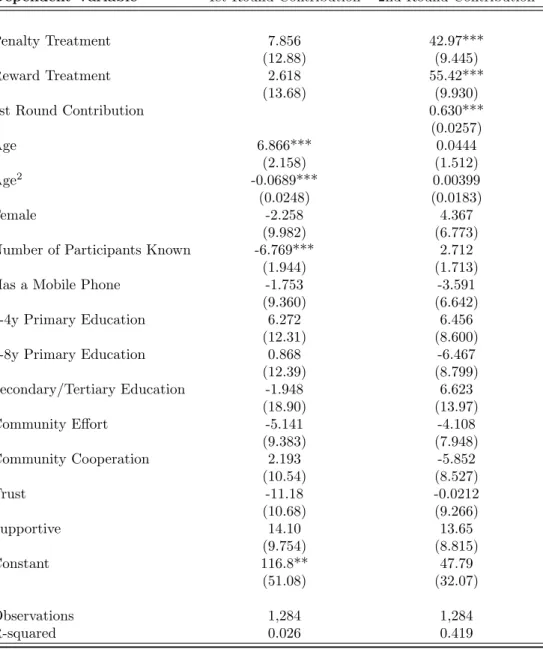
Table A1: OLS on Group Account Allocation
(1) (2)
Dependent Variable 1st Round Contribution 2nd Round Contribution
Penalty Treatment 7.856 42.97*** (12.88) (9.445) Reward Treatment 2.618 55.42*** (13.68) (9.930) 1st Round Contribution 0.630*** (0.0257) Age 6.866*** 0.0444 (2.158) (1.512) Age2 -0.0689*** 0.00399 (0.0248) (0.0183) Female -2.258 4.367 (9.982) (6.773)
Number of Participants Known -6.769*** 2.712
(1.944) (1.713)
Has a Mobile Phone -1.753 -3.591
(9.360) (6.642)
1-4y Primary Education 6.272 6.456
(12.31) (8.600)
5-8y Primary Education 0.868 -6.467
(12.39) (8.799) Secondary/Tertiary Education -1.948 6.623 (18.90) (13.97) Community E↵ort -5.141 -4.108 (9.383) (7.948) Community Cooperation 2.193 -5.852 (10.54) (8.527) Trust -11.18 -0.0212 (10.68) (9.266) Supportive 14.10 13.65 (9.754) (8.815) Constant 116.8** 47.79 (51.08) (32.07) Observations 1,284 1,284 R-squared 0.026 0.419
Village clustered standard errors in parentheses, with *** p<0.01, ** p<0.05, * p<0.1.