EUROSTEEL 2014, September 10-12, 2014, Naples, Italy
NUMERICAL VALIDATION OF T-STUB COMPONENT
SUBJECT TO IMPACT LOAD
João Ribeiroa, Constança Rigueirob, Aldina Santiagoa a
ISISE – Civil Engineering Dept., Faculty of Sciences and Technology, University of Coimbra, Portugal [email protected], [email protected]
b ISISE – Polytechnic Institute of Castelo Branco, Portugal
INTRODUCTION
Accidental loadings due to blast or impact may easily cause failure of the elements that are exposed or located in the vicinity of the hazard, leading in some cases, to the progressive collapse of the whole structure; therefore, assessment of the structural over strength is critical for structural engineers to ensure a certain level of security and validate alternative unloading paths. The importance of the ductility of connections has been highlighted for the robustness evaluation of structures in FEMA’s report [1] “Connection performance under impact loads... needs to be
analytically understood and quantified for improved design capabilities and performance as critical components in structural frames”. Structural connection capacity when subject to impact loads
remains a somewhat unclear theme in the robustness assessment of steel structures. Relevant literature in building robustness improvement [2] [3] provide little guidance on this matter, forwarding load assessment to Eurocode 1, Part 1.7 [4] and connection design to Eurocode 3, Part 1.8 [5]. Both standards fail to provide accurate guidance of how to deal with connection design to impact loading.
Efforts providing resistance and post-limit behaviour of connections under abnormal loadings have recently been put through by the scientific community; most of them focusing on fire and seismic hazard. Under rapidly applied loads, one of the main aspects to be assessed is the influence of strain-rate effect in connection response [6].
The T-stub model is used to describe the behaviour of tensile components i) “column flange in bending” and ii) “end-plate in bending” usually present in a beam-to-column bending resistant connection. These components are responsible for the behaviour in the tension zone of connections, being able to provide ductility to a connection; thus, proper characterization of T-stub behaviour under impact loading is crucial.
In this paper, a 3D finite element model exploring the behaviour of the T-stub subject to rapidly applied loads is validated against experimental results [9]. Close agreement of the numerical force-displacement responses for the tested T-stub, demonstrate that the material model assumptions, regarding its behaviour when subject to elevated strain-rates, are reliable.
1 FINITE-ELEMENT MODELLING OF ISOLATED BOLTED T-STUB
1.1 Structural and Numerical model
The T-stub model analysed in this paper belongs to an ongoing study that is being carried out at the University of Coimbra, where experimental and numerical studies under quasi-static and rapidly applied loadings are considered [7], [8], [9]. A welded T-stub flange thicknesses of 10 mm (T-10) has been studied; the steel grade is S355 and the bolts M20 grade 8.8 are fully threaded.
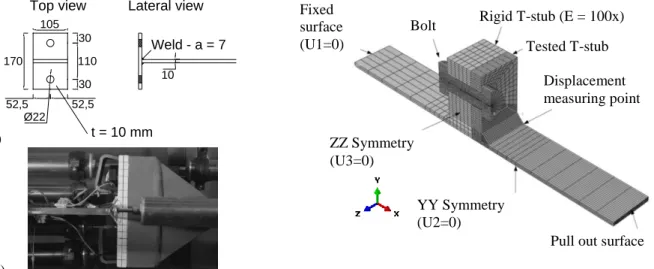
The testing programme comprises three loading levels: i) one quasi-static loading (reference case); and two different rapidly applied dynamic loadings based on the pressure of the gas in the chamber: ii) 120 Bar; and iii) 160 Bar. A detailed description of the experimental setup and the retrieved data analysis can be found in [9]. Fig. 1 presents the dimensions of the test specimens (Fig. 1a)) and the structural arrangement of the tested T-stub (Fig. 1b)).
The FE analyses are conducted with the software ABAQUS [10] using its implicit/dynamic algorithm to solve the non-linear problem (see section §1.4). Fig. 2 depicts the numerical model’s
boundary condition and mesh discretization. The FE model is composed of four parts: (i) rigid back T-stub; (ii) tested T-stub; (iii) bolt, (head and shank as a single piece) and (iv) pull-out plate (web). Contact interaction is modelled between all the four parts. The welds are modelled in the tested T-stub part and connected to the pull out plate with a tie constraint property. Normal contact conditions are accomplished with “hard-contact” property allowing for separation after contact, while the tangential behaviour has been assumed with a friction coefficient of 0.2 following “penalty” formulation. Bolt modelling follows the nominal geometry (bolt shank diameter of 20 mm and the hole diameter 22 mm). No pre-load on the bolt is considered.
a)
b)
Fig. 1. a) T-stub geometry; b) Structural arrangement. Fig. 2. T-stub model boundary conditions and mesh
discretization. 1.2 Material properties – Quasi-static response
Mild steel is macroscopically assumed as an isotropic material. Its constitutive characterization, for most engineering applications, can be obtained through quasi-static tension tests, from which the elastic modulus ( ) and the elastic ( ) and ultimate strengths ( ) are easily acquired.
Fig. 3 presents the results from quasi-static uniaxial tension tests. Both mild steel coupon (solid
line) grade S355 and quenched steel bolt grade 8.8 (dashed line) were tested, providing suitable material characterization for quasi-static FEA described in this paper. The mild steel specimens have been collected from the same steel batch of the material used on the tested T-stub specimens, while the steel grade 8.8 were picked from the same box of bolts M20. The solid curve denotes that mild steel is by nature a ductile material, with the capacity of absorbing great amount of energy before fracture; while the red dashed line which, despite its much higher elastic and ultimate strengths, exhibits rather low ductility capacity.
1.3 Material properties – Elevated strain rate response
Strain rate is the deformation, i.e. strain variation, that a material is subject per time unit, . Most ductile materials have strength properties which are dependent on the loading speed; mild steel is known to have its flow stress affected. The effects of different strain rates on true stress-logarithmic strain curves of T-stub steel are illustrated in Fig. 4. The high-strain rate curves were obtained from an experimental programme carried out at the University of Coimbra using a Compressive Split Hopkinson Pressure Bar (SHPB) [11]; an average strain rate around ̇ = 600s-1 has been applied. Comparison against quasi-static results showed that:
i. the yield and ultimate strengths ( , ) lead to an increase near 50% for the results obtained under quasi-static loading;
ii. the total strain on rupture ( ) decreases, and;
iii. the elastic modulus ( ) remains indifferent to the loading rate.
A simplified way to consider high-strain rate enhancement in the stress-strain material law is to adopt a dynamic increase factor (DIF), given by the relation of the dynamic yield strength, to
the yield strength obtained under quasi-static conditions, : ⁄ .
t = 10 mm 170 105 30 110 30 52,5 52,5
Top view Lateral view
Weld - a = 7 10 Ø22 t = 10 mm 170 105 30 110 30 52,5 52,5
Top view Lateral view
Weld - a = 7 10 Ø22 Fixed surface (U1=0) ZZ Symmetry (U3=0) YY Symmetry (U2=0) Displacement measuring point Tested T-stub Rigid T-stub (E = 100x)
Pull out surface Bolt
Finite element models aiming to simulate the behaviour of structural elements when subject to impact loads require a constitutive law representing the behaviour of materials for a range of strain rates. In this study the Johnson–Cook model [12] is considered; although purely empirical, this model is able to account not only for the strain rate sensitivity but also for the thermal softening behavior. It assumes that the slope of flow stress is independently affected by each of the mentioned variables, see Eq. 1:
[ ] [ ̇ ] [ ( ) ] (1)
where: A is the quasi-static yield strength; B and n represent the effects of strain hardening; m is the thermal softening fraction is a non-dimensional parameter defined based on the melting and transition temperatures to take account for material softening due to temperature variation; is the equivalent plastic strain; ̇ is the strain rate; ̇ ̇ ̇ is the reference dimensionless plastic strain rate ( ̇ ) and C is the strain rate constant.
Thus, based on the previous results from SHBT test and using the second term of Johnson–Cook’s law Eq. 1, Csteel = 0.039 for 600s-1 is calculated to fit the experimental data of the mild steel [11]
(Fig. 4). The dependency on the strain rate of the bolts’ material is accounted considering literature reports; impact tests on A 325 bolts recovered from the WTC debris showed very low sensitivity to strain rate [13]: high strength steels are less sensible to the effects of strain rate variation. According to Chang and his co-authors [6], a dynamic increase factor (DIF) of 1.1 may be considered for the bolts. This value has been adopted in the current study, thus a value of Cbolt=0.0072 is obtained. The
welds are assumed to have the same strain rate sensitivity as the mild steel. Fig. 5 provides the applied DIF for strain rate values between following the Johnson–Cook law. Fig. 6 presents the true-stress - true plastic strain relationship considered in the numerical models.
Fig. 3. Quasi-static stress-strain relationship
for t = 10 mm plate, S355 steel and bolt M20 (8.8).
Fig. 4. True stress - logarithmic strain relationship
of steel under high-strain rate (approx. 600 s-1) for t = 15 mm plate, S355 [11].
Fig. 5. Dynamic increase factor (DIF) of the
yield strength as function of the strain rate.
Fig. 6. Stress-strain relationship for mild steel and bolts
considering strain rate sensitivity input in the FE models. 1.4 Non-linear dynamic analysis – Solution algorithm
Two different solution strategies are available to perform non-linear dynamic analysis: implicit and
explicit. Implicit procedures are related to solution schemes that require the solution of a system of
equations for evaluation of ; whereas explicit procedures are those in which evaluation of can be directly obtained from the previous steps and do not require the solution of a system of
0 200 400 600 800 1000 0 0.05 0.1 0.15 0.2 0.25 St ress Strain [-] Engineering - S355 Engineering - M20 (8.8) yielding ultimate tensile strength fracture 0 200 400 600 800 1000 1200 0 0.05 0.1 0.15 0.2 0.25 T rue St ress [MPa] True Strain [-] S355 - 614/s S355 - 597/s S355 - 600/s S355 - Static 1 1.1 1.2 1.3 1.4 1.5 1.6 0.001 0.01 0.1 1 10 100 1000 DIF -Y ield Str ength Strain Rate [1/s] S355 - C = 0.039 Bolt (8.8) - C = 0.0072 0 200 400 600 800 1000 1200 0 0.1 0.2 0.3 T rue -St ress [MPa]
True Plastic Strain [-]
S355 - 0.001/s S355 - 600/s - C= 0.039 Bolt (8.8) - 0.001/s
equations. The Hilber-Hughes-Taylor (HHT) is a well-established implicit numerical procedure for the direct integration of the equations of structural dynamics. The HHT method provides dissipation combining the positive Newmark ϒ-dissipation and negative α-dissipation methods, with improved characteristics ensuring dissipation of the higher frequencies while the lower modes are not affected too strongly. Moreover, the HHT algorithm is unconditionally stable with respect to ⁄ (time-increment/period) whenever , thus allowing for relatively large time-increments [14]. The HHT method is available in ABAQUS and it is chosen to solve the non-linear dynamic analysis presented in this paper; two different applications are used: “quasi-static” application for quasi-static loading (section §2), and “moderate dissipation” for the short time transient analysis [7] (section §3).
2 VALIDATION UNDER QUASI-STATIC LOADING
The validation of the numerical model for T-stubs under quasi-static loading is based on the experimental results with the same nature reported in [7]. Fig. 7 compares the numerical (T-10-DynQS) with the experimental response from two similar test specimens subject to the same loading conditions (T-10-Test#1 and T10-Test#2). It can be observed that the numerical model accurately predicts the global behaviour of the T-stub component during the elastic, the plastic transition and strain hardening phases. In both tests, the ultimate failure mode has been the bolt failure, similarly to what is predicted with the numerical model. Although a smaller displacement capacity is predicted numerically, the ultimate maximum loading is in agreement with the tests. Further discussion of quasi-statically loaded material failure assessment is reported in [15].
3 IMPACT LOADING
3.1 Load application procedure
The numerical validation under impact loading is made with two different load levels applied on the experimental tests: gas pressures of 120 (Impact #1 of T10-D120-160) and 160 Bar (Impact #1 of T10-D160) [9]. Each load level induced a transient displacement curve represented in Fig. 8; both curves were obtained through laser gauge measurements. Maximum displacement values were reached in approximately 0.08 sec. These experimental displacement fields have been applied as a boundary condition in the “pull out surface” of the numerical model (Fig. 2).
Fig. 7. Force displacement curve for quasi-static loading:
numerical versus experimental results.
Fig. 8. T-stub displacement curves measured
experimentally and used for displacement based loading application in the FEA.
3.2 Numerical versus experimental results
Fig. 9 and Fig. 10 compare the T-10 force-displacement (F-δ) response subject to quasi-static (grey
dotted line – numerical curve) and rapidly applied dynamic loads with different intensity (black dotted line – numerical curve and black dashed line – experimental curve). The close agreement of these numerical responses confirms that the Johnson-Cook material model with the dynamic increase factors described in Fig. 5, provide accurate stress enhancement to describe the behaviour of bolted steel connections subject to impact loadings.
Fig. 11 illustrates the pattern of the strain rate (ER), ranging from 1/s to 3/s in the plastic hinge
developed next to the weld toe, corresponding to DIFs of 1.27 and 1.31 (see Fig. 5), while Fig. 12 0 50 100 150 200 250 300 0 10 20 30 40 For ce [k N] Displacement [mm] T-10 - 20ºC - Test#1 T-10 - 20ºC - Test#2 T-10-DynQS 0 2 4 6 8 10 12 14 16 18 20 0 0.02 0.04 0.06 0.08 0.1 Displa ce me nt [mm] Time (s) 160 Bar 120 Bar
presents superposition of quasi-static and dynamic loading levels of 120 and 160 Bar obtained numerically. It can be observed that the elastic stiffness remains unchanged for all loading schemes: ki = 180 kN/m, as the steel’s elastic modulus introduced in the numerical models is the same for
both quasi-static and dynamic situations. For the same displacement instant, the strain rates developed are similar for both dynamic loading (Fig. 11) inducing the same dynamic increase factors for the stress enhancement; the F-δ flows are therefore, similar for both numerical dynamic responses up to the end of 120 Bar response (Fig. 12). The markers in Fig. 12 represent the plastic resistances of the T-stub: FRd,quasi-static = 161 kN and FRd,120 Bar = FRd,160 Bar = 195 kN; corresponding
to an enhancement of +21% of the plastic resistance due to the elevated strain rate effects.
Fig. 9. T-10 F-δ responses: Experimental 120 Bar
loading Vs. numerical quasi-tatic and 120 Bar loading.
Fig. 10. T-10 F-δ responses: Experimental 160 Bar
loading Vs. numerical quasi-static and 160 Bar loading. Dynamic – 120 Bar δ = 1.76 mm F = 184.0 kN Dynamic – 160 Bar δ = 1.71 mm F = 184.5 kN
Fig. 11. Strain rate for loadings a) 120 Bar and b) 160 Bar for a global T-stub displacement of δ = 1.7 mm.
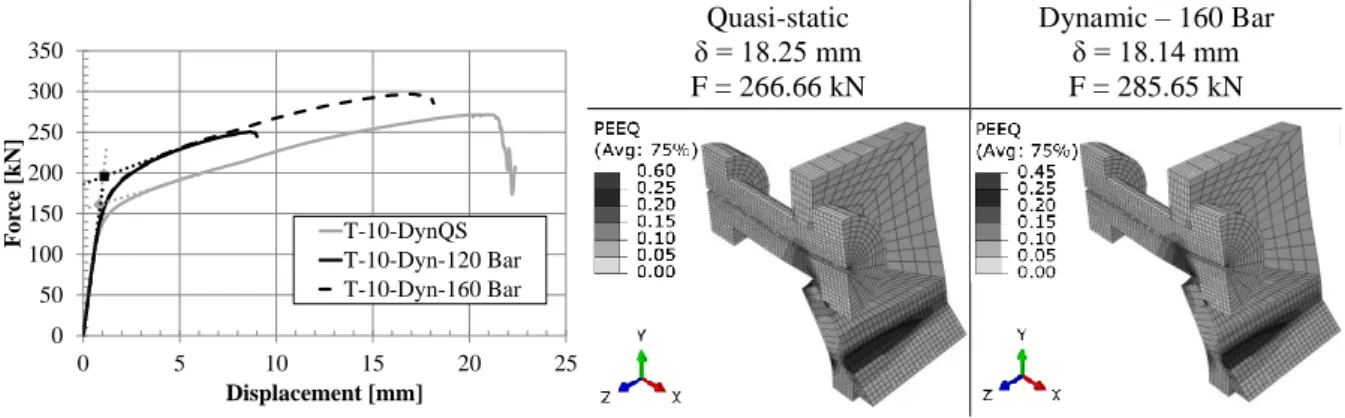
For a time step near the end of the analysis (δ = 18 mm approximately), Fig. 13 compares the equivalent plastic strain (PEEQ) patterns for the quasi-static and dynamic (160 Bar) response; it can be observed that for both situations two plastic hinges are developed per flange leg, consistently with the plastic failure mode type 1 predicted by the Eurocode 3, part 1.8 [5]. However, in the dynamic case, the plastic hinges are slightly underdeveloped and higher strains are required in the bolt to meet the same deformation level (Fig. 13b). As the increase of the strength is greater in the flange (DIFflange 1.3) rather than the bolt (maximum DIFbolt =1.1), stiffer plastic and failure modes
are triggered.
Fig. 12. T-10 Numerical predictions;
Quasi-static, 120 Bar & 160 Bar.
Quasi-static δ = 18.25 mm F = 266.66 kN Dynamic – 160 Bar δ = 18.14 mm F = 285.65 kN
Fig. 13. Equivalent strain patterns (PEEQ) [-]
– a) Quasi-static Vs. b) Dynamic 160 Bar.
0 50 100 150 200 250 300 0 5 10 15 20 25 For ce [k N] Displacement [mm] T-10-DynQS T-10-Dyn-Disp-120 Bar Impact #1 - T10-D120-160 0 50 100 150 200 250 300 350 0 5 10 15 20 25 For ce [k N] Displacement [mm] T-10-DynQS T-10-Dyn-Disp-160 Bar Impact #1 - T10-D160 0 50 100 150 200 250 300 350 0 5 10 15 20 25 For ce [k N] Displacement [mm] T-10-DynQS T-10-Dyn-120 Bar T-10-Dyn-160 Bar
4 CONCLUSIONS
A numerical study concerning the dynamic response of the T-stub model was described in this paper. The first analyses replicated tests of welded T-stub with a flange thickness of 10 mm subject to quasi-static load up to failure. Then, the model was improved to study the response when subject to rapidly applied dynamic loads and it results were compared against experimental results. Transient displacement responses measured experimentally were used to define two different load levels. Good agreement between experimental results and the numerical prediction was observed, showing that the developed finite element model, accounting for elevated strain rate effects following the Johnson-Cook model, is reliable for the prediction of the response of steel connections when subject to rapidly applied dynamic loads. Analysis of the equivalent strain patterns showed that when subject to impact loading schemes, the bolts are required to develop higher strains, therefore stiffer plastic and ultimate failure modes are induced.
ACKNOWLEDGMENT
The authors acknowledge financial support from Ministério da Educação e da Ciência (Fundação para a Ciência e Tecnologia) under research project PTDC/ECM/110807/2009.
REFERENCES
[1] McAllister, T., 2002, World Trade Center building performance study: data collection, preliminary
observations and recommendations, Federal Emergency Management Agency, Federal Insurance and
Mitigation Administration, Washington, D.C., FEMA Region II, New York.
[2] Arup, 2011, Review of international research on structural robustness and disproportionate collapse, Deparment for Communities and Local Government.
[3] Cormie, D., Mays, G. and Smith, P., 2009, Blast Effects on Buildings, 2nd edition, Thomas Telford [4] CEN, 2006, Eurocode 1: Actions on structures. Part 1-7, General actions - Accidental actions,
Brussels: European Committee for Standardization.
[5] CEN, 2005, Eurocode 3: Design of steel structures part 1-8: Design of joints, Brussels: European Committee for Standardization.
[6] Chang, L., Hai, T. K., Ching, F. T., Tyas, A., 2011, “Numerical simulation of steel bolted beam-column connections subjected to dynamic loading”, Applied Mechanics and Materials, Vol.82, pp. 314-319. [7] Barata, P., Santiago A., Rodrigues J.P., 2013, “Experimental behaviour of t-stub joint component at
elevated temperatures, 2º CISLACI, June 2013: Coimbra, Portugal, Vol I, pp. 345-354.
[8] Ribeiro J., Rigueiro C., Santiago A., 2013, “Numerical behaviour of T-stub joint component at ambient and elevated temperatures”, 2º CISLACI, June 2013: Coimbra, Portugal, Vol. I, pp. 355-364
[9] Barata, P., Santiago, A., Rodrigues, J.P., Rigueiro, C., 2014, “Experimental behaviour of T-stub component subject to impact loads, EUROSTEEL 2014, Naples, 2014 (submitted).
[10] Abaqus Theory Manual & Users Manuals, v.6.11, Hibbitt, Karlsson and Sorensen, Inc. USA, 2011. [11] Saraiva, E., 2012,“Variação das propriedades mecânicas do aço relacionadas com problemas de
impacto em estruturas”, Master Thesis at University of Coimbra, in portuguese.
[12] G.R. Johnson, W.H. Cook, 1983, “A constitutive model and data for metals subjected to large strains, high strain rates and high temperatures”, Proceedings of the 7th International Symposium on Ballistics,
The Hague, The Netherlands, pp. 541-547.
[13] Luecke, W., McColskey,J., McCowan, J, Banovic, S., Fields, R., Foecke, T., Siewert, T. Gayle, F., 2005, Mechanical Properties of Structural Steels, Federal Building and Fire Safety Investigation of the World Trade Center Disaster, NIST NCSTAR 1-3D.
[14] Hilber, H. M., Hughes, T., Taylor, R., 1977, “Improved numerical dissipation for time integration algorithms in structural dynamics”, Earthquake engineering and structural dynamics, Vol. 5, pp. 283-292.
[15] Ribeiro, J., Santiago, A., Rigueiro, C., 2014 “Material modelling of tensile steel component under impulsive loading”, XIV Portuguese Conference on Fracture, pp. 273-280, Régua, Portugal, 2014.
NUMERICAL VALIDATION OF T-STUB COMPONENT
SUBJECT TO IMPACT LOAD
João Ribeiroa, Constança Rigueirob, Aldina Santiagoa a
ISISE – Civil Engineering Dept., Faculty of Sciences and Technology, University of Coimbra, Portugal [email protected], [email protected]
b ISISE – Polytechnic Institute of Castelo Branco, Portugal
KEYWORDS: Bolted steel connection, T-stub, elevated strain rate, finite-element. ABSTRACT
Accidental loadings due to blast or impact may easily cause failure of the elements that are exposed or located in the vicinity of the hazard, leading in some cases, to the progressive collapse of the whole structure; therefore, assessment of the structural over strength is critical for structural engineers to ensure a certain level of security and validate alternative unloading paths. The T-stub model is used to describe the behaviour of components i) “column flange in bending” and ii) “end-plate in bending” usually present in a beam-to-column bending resistant connection [1]. These components are responsible for the behaviour in the tension zone of connections, being able to provide ductility to a connection; thus, proper characterization of T-stub behaviour under impact loading is crucial.
In this paper, a 3D finite element model exploring the behaviour of a welded T-stub with flange thickness of 10 mm (T-10) (Fig. 1) is validated against experimental results from:
i) one quasi-static loading (reference case) (grey dotted line Fig. 2 and Fig. 4);
ii) and two rapidly applied dynamic loadings according to the gas pressure in the chamber: a. 120 Bar (Impact #1 - T10-D120-160 - Fig. 2); and
b. 160 Bar (Impact #1 - T10-D160 - Fig. 4) [2].
The steel grade of the T-stub is S355 and the bolts M20 grade 8.8 are fully threaded. The dynamic loading simulations take into account the elevated strain rate effects in the stress enhancement, based on dynamic increase factors, following the Johnson-Cook material model [3]. The dynamic loadings are applied as a boundary condition in the “pull out surface” (Fig. 1) considering the T-stub’s transient displacement responses obtained from experimental tests; maximum displacement values are reached in approximately 0.08 sec. The accuracy of the numerical force-displacement predictions for both quasi-static and dynamic loading schemes confirms that the Johnson-Cook material model used, provide accurate stress enhancement to describe the behaviour of bolted steel connections subject to impact loadings.
From Fig. 2 and Fig. 4, it can be observed that the elastic stiffness remains unchanged for all loading schemes: ki = 180 kN/m, as the steel’s elastic modulus introduced in the numerical models
are the same for both quasi-static and dynamic situations; moreover, the strain rates developed are similar for both dynamic loading (Fig. 3), inducing the same dynamic increase factors for the stress enhancement; the F-δ flows are therefore, similar for both numerical dynamic responses but with different failure displacements. Plastic resistances of the T-stub: FRd,quasi-static = 161 kN and
FRd,120 Bar = FRd,160 Bar = 195 kN; corresponding to an enhancement of +21% of the plastic resistance
due to the elevated strain rate effects.
Fig. 3 illustrates the pattern of the strain rate (ER), ranging from 1/s to 3/s in the plastic hinge
developed next to the weld toe, corresponding to a DIFs of 1.27 and 1.31. Furthermore, comparison of the equivalent plastic strain (PEEQ) pattern for both loading situations, shows that two plastic hinges are developed per flange leg, consistently with the plastic failure mode type 1 predicted by the Eurocode 3, part 1.8 [1]. However, in the dynamic case, the plastic hinges are slightly underdeveloped and higher strains are required in the bolt to meet the same deformation level.
Fig. 1. T-stub model boundary conditions and mesh
discretization.
Fig. 2. T-10 F-δ responses:
Experimental (Impact #1 of T10-D120-160) Vs. numerical quasi-static and 120 Bar loading. Dynamic – 120 Bar δ = 1.76 mm F = 184.0 kN Dynamic – 160 Bar δ = 1.71 mm F = 184.5 kN
Fig. 3. Strain rate for loadings a) 120 Bar and b) 160 Bar
for a global T-stub displacement of δ = 1.7 mm.
Fig. 4. T-10 F-δ responses:
Experimental (Impact #1 of T10-D160) Vs. numerical quasi-static and 160 Bar loading. CONCLUSIONS
A numerical study concerning the dynamic response of the T-stub model was described in this paper. The first analyses replicated tests of welded T-stub with a flange thickness of 10 mm subject to quasi-static load up to failure. Then, the model was improved to study the response when subject to rapidly applied dynamic loads and it results were compared against experimental results. Transient displacement responses measured experimentally were used to define two different load levels. Good agreement between experimental results and the numerical prediction was observed, showing that the developed finite element model, accounting for elevated strain rate effects following the Johnson-Cook model, is reliable for the prediction of the response of steel connections when subject to rapidly applied dynamic loads. Analysis of the equivalent strain patterns showed that when subject to impact loading schemes, the bolts are required to develop higher strains, therefore stiffer plastic and ultimate failure modes are induced.
ACKNOWLEDGMENT
The authors acknowledge financial support from Ministério da Educação e da Ciência (Fundação para a Ciência e Tecnologia) under research project PTDC/ECM/110807/2009.
REFERENCES
[1] CEN, 2005, Eurocode 3: Design of steel structures part 1-8: Design of joints, Brussels: European Committee for Standardization.
[2] Barata, P., Santiago, A., Rodrigues, J.P., Rigueiro, C., 2014, “Experimental behaviour of T-stub component subject to impact loads, EUROSTEEL 2014, Naples, 2014 (submitted).
[3] G.R. Johnson, W.H. Cook, 1983, “A constitutive model and data for metals subjected to large strains, high strain rates and high temperatures”, Proceedings of the 7th International Symposium on Ballistics,
The Hague, The Netherlands, pp. 541-547.
0 50 100 150 200 250 300 0 5 10 15 20 25 For ce [k N] Displacement [mm] T-10-DynQS T-10-Dyn-Disp-120 Bar Impact #1 - T10-D120-160 0 50 100 150 200 250 300 350 0 5 10 15 20 25 For ce [k N] Displacement [mm] T-10-DynQS T-10-Dyn-Disp-160 Bar Impact #1 - T10-D160 Fixed surface (U1=0) ZZ Symmetry (U3=0) YY Symmetry (U2=0) Displacement measuring point Tested T-stub Rigid T-stub (E = 100x)
Pull out surface Bolt