A comparison between energy performance of one DSF buildings studied
sample and office buildings benchmarks in Europe
M. de Matos
ISQ – Instituto de Soldadura e Qualidade, Oeiras – Lisboa, Portugal
R. Duarte
ESTSetúbal, Politechnic Institute Setúbal, Portugal
ABSTRACT
This paper describes ongoing energy
benchmarks studies of double-skin façade buildings. A comparison between energy performance of these actual buildings and European office buildings benchmarks is
discussed. Some preliminary results are
presented.
1. INTRODUCTION
One building-related technology that has gained significant acceptance among architects and promoters of high-rise glazed office buildings is the double-skin façade (DSF). In spite of the acceptance gained among architects and promoters, and the number of European buildings that were built using DSF technology, the actual energy performance of DSF buildings is still lacking a more in-depth evaluation; there is a great variety in DSF typologies and wide variations in energy performance between different DSF buildings. In addition, the technological progress enables the continuous development of alternative façade systems that can prove to be more energy efficient.
Work carried out is focused in assessing the circumstances for which the DSF technology has energetic advantages, and based on actual examples discover the best practices. Within the Bestfaçade Project “Best Practices for Double Skin Façades” (BESTFACADE) - supported by the European Commission’s IEE Programme - a comparison between a sample of completely characterised DSF buildings distributed across
Europe and office buildings energy benchmarks for different countries were prepared.
BESTFACADE project aim and activities carried out are summarized by Farrou et al. (2007). Current paper relates to the work performed mainly within work package 3 of BESTFACADE project and deals specifically with the analysis and interpretation of energy performance data. It is structured in the following way: Section 2 presents the studied
data; Section 3 discusses the energy
performance indicators; Section 4 presents a preliminary analysis of the data; Section 5
includes the comparison with European
benchmarks, and conclusions and comments on the experience gathered so far are in section 6. 2. THE STUDIED SAMPLE DATA
The target group of buildings directly addressed by BESTFACADE project were DSF buildings in European countries, namely in Austria, Belgium, France, Germany, Portugal, Greece and Sweden.
Figure 1: Number of buildings per country. 5 1 0 0 3 2 3 0 1 2 3 4 5 N u m b er o f b u ild in g s
Sw eden Austria Belgium France Germany Greece Portugal initial sample useful data
Initially it was proposed that analysis would involve 27 DSF buildings plus 3, which were suggested later on, during meetings between BESTFACADE project partners. Figure 1 presents the number of buildings from each country.
A combination of data collection tools, namely questionnaires, documentation research, interviews and technical visits was used to gather sufficient data to fully analyse and interpret building’s performance and critical success factors. Energy data collected for DSF buildings were annual figures for recent years, 2004 and 2005. Data was verified as far as possible by identifying any anomalies outside the expected range of results.
Despite of the data collection effort, of these 30 buildings only a small percentage was able to provide a complete set of quantitative data for energy performance analysis. Useful energy performance data (merely heating and cooling
index) were gathered in 14 buildings,
corresponding to 45% of the total buildings number, which is a particularly narrow set. Even more limited if data is divided in the three main European climate regions, as classified by Streicher (2005).
The referred above difficulties in obtaining energy performance data were attributed to the
building managers fear for loss of
confidentiality and to the lack of monitoring devices, specially to assess cooling, ventilation and lighting demands.
For that reason, additionally to the detailed comparison between energy performance of DSF buildings with useful data, which were chosen to constitute our sample, it was decided to study DSF buildings energy behaviour in opposition to benchmarks of single skin façade office buildings in Europe. This decision was intended to enlarge the scope of the analysis and contributes to rate DSF buildings against each other and against single skin façade office buildings.
Assessment of the buildings with double skin façades based on their energy performance indicators and on benchmarks for similar building type, which result from each national building stock in Europe, allows the users and the operators of DSF buildings to compare their
energy consumption levels and set best future targets, looking for the recognition of potential measures to reduce energy consumptions. 3. ENERGY PERFORMANCE INDICATORS Herein, energy performance analysis is the study of energy indicators related to one or more variables in order to allow a meaningful comparison between buildings, subject to different (internal and external) environments, management conditions, etc.
Determining the isolated influence of the DSF on the building’s energy consumption is an
extremely complex task. BESTFACADE
project is also aimed to improve the understanding in this topic. Consequently, whenever the influence of the DSF in the buildings energy balance is significant an alternative approach is to assess the DSF technology indirectly using instead the whole building energy needs.
Buildings energy needs are (easily) obtained from energy billing accounting procedures or by computational simulation. For purposes of comparing energy needs it is common to define indicators. A frequently used indicator is annual energy delivered per square meter of useful pavement area, an indicator that normalizes energy consumption by building size. When this indicator is calculated for each building and the relative positions compared with the rest of the sample, good and poor energy performers are easily identified. Establishing for each building as energy performance indicators the annual
energy delivered per useful area [kWh/m2a]
figures, these indicators, usually called Energy Efficiency Indicators (EEI), were calculated and DSF buildings relative positions compared to define the good and the poor performers of the sample.
Energy performance of buildings is
determined by a wide range of factors, some of which are outside the control or influence of DSF technology, therefore data on the
background, utilization and managing
characteristics for each DSF building was also considered to understand their relative energy performance (Matos and Duarte, 2007).
Climatization EEI: Energy Efficiency Indicator 0 50 100 150 200 250 300 AE V C AB A D AD B G Q E R T W DSF Building code [k W h /m 2 .a ]
Electricity consumption index
0 25 50 75 100 125 150 175 200 225 250 AE AD AB G E B Q R D A W T DSF Building code [k W h /m 2 .a ] 480
Figure 2: Climatization EEI for the fourteen sample DSF buildings.
Figure 3: Electricity EEI for the sample of DSF buildings.
Figure 4: Lighting EEI for the sample of DSF buildings. Climate is a very important determinant of building energy performance. If buildings subject to different climates are to be compared it is imperative to take account for the severity of the climate. Following building size normalization it was apparently necessary to make some climate normalization and with this aim, a time-consuming study were carried out to choose reference conditions closer to average conditions to allow for a European climate
normalization level. Even dividing European conditions in three or four most important European climate regions, the results have shown that climate normalization is not a good approach at this level. With a climate
normalization based on average-normal
conditions the buildings with the best energy performance are in general those ones, which are located closest to the reference conditions chosen. This should be because low energy buildings are somehow designed for local climate and designers also should look for specific local DSF solutions. On the other hand, the attempt in this study has shown that good performers maintain their good behavior exposed prior to any climate normalization.
Energy consumption is also very dependent on internal gains and the HVAC system used, so any particular study on DSF building features has to be considered in order to account for these aspects.
4. PRELIMINARY ANALYSIS
Since the DSF buildings analysed in the reference sample are not sufficient to constitute a reasonably representative sample of the DSF buildings in European cities, it was decided to include in the energy analysis individually identified single-skin façade (SSF) office buildings, which have supplied annual data energy consumption indexes for both heating and cooling systems.
Preliminary results on similarity have shown some general interesting features revealed by tendencies in consumption for climatization. Raw energy data on heating and cooling energy consumptions for all the buildings, which supply useful data, highlight maximum values between 150 and 175kWh/m2a for both heating and cooling, and minimum values in the range of 25 to 50kWh/m2a as one can see in Figure 5. These limits are alike in DSF and SSF buildings, but although all the DSF buildings are equipped with heating and cooling systems some of the SSF buildings considered do not have any cooling system.
This introductory analysis was very
important in order to define a direction to the subsequently studies and to make clear how meaningful comparisons should be made. Lighting consumption index
0 25 50 75 100 AE E G Q T R W DSF Buildings [k W h /m 2 .a ]
Figure 6: Energy consumption in heating and cooling for a sample of individual identified buildings in Europe. DSF buildings can be compared with SSF buildings and, consequently, with European benchmarks for each building type. But this comparison only made sense for buildings in the same category; this means, for example, that one should compare DSFs with SSFs or benchmarks in southern, northern or central European climate, but never against each others in different climatic regions. If results for heating energy of a building in the southern region of Europe are mixed with similar results for central or northern European countries, this particular building can be wrongly seen as a good performer when in reality it simply does not need heating due to sympathetic external ambient temperatures. Of course this is valid for heating and cooling energy, at the same time as it was verified that solar gains are generally much relevant in DSFs buildings because they are often highly glazed buildings. A comparison
among ventilation or lighting energy,
considering time schedule, could be made among different climatic regions, but in the DSF buildings sample studied the former is about 1/7 of the global EEI in the most unfavourable case studied, and in the latter comparison can be made by observation of Figures 2 and 4. These graphs also show the noticeable lack of actual data when energy info are divided by kind of consumptions.
It should be stated that when a comparison is made between DSFs and SSFs or benchmarks for office buildings, the SSFs and the existing benchmarks include buildings with reduced glazed areas much smaller than those that are common in DSFs buildings. Simulation studies made in the scope of the BESTFACADE project show that low glazed office buildings are better
performers than highly glazed SSFs, and are often better performers than DSFs. Hence, and depending on the climatic region, comparing DSFs with SSFs of low glazed areas or benchmarks including energy performance of office buildings that can already be low glazed may be a high standard for DSFs, which would naturally be better qualified to be compared against highly glazed SSFs.
On first approach, no significant difference seems to exist between DSFs and SSFs, and it seems reasonable to establish an assessment scheme developed in order to compare and rate double-skin façade buildings in the same group and with similar type single-skin façade buildings by making use of the correspondent existing benchmarks.
5. COMPARISON WITH EUROPEAN
BENCHMARKS OF OFFICE BUILDINGS A comparison is made with standard energy consumption benchmarks for office buildings to establish how an individual building of the BESTFACADE project sample match up to typical and best practice buildings.
Typical and best practice benchmarks can be used as a target. These benchmarks give an absolute measure of how certain types of buildings should perform. Absolute difference between actual consumed energy and the reference benchmark provides a valuable indication of the potential for improvements in Energy Efficiency.
Energy performance indicators give only an open indication of building energy efficiency and for that reason must be treated with prudence. It should not be concluded that a building with a poor performance indicator represents a bad technological choice because in fact it can be being operated not efficiently. Also, it should be noted that the measured data collected related to the building’s energy use includes the performance of the system, if obtained by energy accounting procedures or
making use of sophisticated monitoring
apparatus.
Nevertheless, realistic targets should be set by the DSF building’s management as stated between “Best” practices and “Typical” practice benchmarks for all buildings, mostly SSF. 0 50 100 150 200 250 0 1 2 3 4 5 E n e rg y C o n s u m p ti o n I n d e x [k W h /m 2 a ] DSF buildings SSF buildings
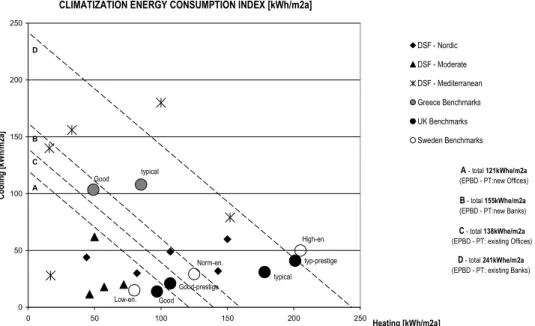
Figure 7: Heating and cooling energy consumption of the DSF buildings studied sample (BESTFACADE project): Comparison with European benchmarks of office buildings.
Figure 8: Electricity against fossil fuels energy consumption of DSF buildings studied sample (BESTFACADE project): Comparison with European benchmarks of office buildings.
As it is shown in Figures 7 and 8 a well-defined group of DSF buildings included in the sample of the BESTFACADE project is clearly within these upper limits defined by the European energy consumption benchmarks for office buildings.
So, it seems reasonably that “good practice” figures for existing buildings should be used as upper limits for new design.
In Central Europe and Northern countries is usual to associate fossil fuels consumption with the demand of final energy for heating, and a big portion of electricity for consumption is due to the needs for cooling because HVAC systems are designed this way. However in Mediterranean countries is not uncommon to fulfill heating needs with electricity (heat pump).
PRIMARY ENERGY CONSUMPTION INDEX [kWh/m2a]
typical Good typ-prestige Good-prestige typical Good Low-en. Norm-en. High-en. standard equip. high equip. 0 50 100 150 200 250 300 350 400 450 500 0 50 100 150 200 250 300 350 400 450 500
Fossil Fuels [kWh/m2a]
E lect ri ci ty [kW h e/ m 2a] DSF - Nordic DSF - Moderate DSF - Mediterranean Greece Benchmarks UK Benchmarks Belgium Benchmarks Sweden Benchmarks Germany Benchmarks
Brussels Private NACE Code 65-67 NACE Code 70-74
NACE Code 75
B - total 45kgep/m2a (EPBD - PT:new Banks)
C - total 40kgep/m2a (EPBD - PT: existing Offices)
A - total 35kgep/m2a (EPBD - PT:new Offices)
D - total 70kgep/m2a (EPBD - PT: existing Banks)
A C B D Walloon Private Brussels Public Walloon Public
CLIMATIZATION ENERGY CONSUMPTION INDEX [kWh/m2a]
Good typical Good Good-prestige typ-prestige typical Low-en. Norm-en. High-en. 0 50 100 150 200 250 0 50 100 150 200 250 Heating [kWh/m2a] C o o li n g [ k W h /m 2a ] DSF - Nordic DSF - Moderate DSF - Mediterranean Greece Benchmarks UK Benchmarks Sweden Benchmarks B - total 155kWhe/m2a (EPBD - PT:new Banks)
C - total 138kWhe/m2a (EPBD - PT: existing Offices)
A - total 121kWhe/m2a (EPBD - PT:new Offices)
D - total 241kWhe/m2a (EPBD - PT: existing Banks) A
C B D
The overall energy performance of a building can be expressed by the Primary Energy Index, as revealed by Figure 8. Separate benchmarks for electricity and fossil fuels make available an analysis for the widely different costs, and CO2 emissions per unit of energy delivered. Generally each unit of electricity results in more than two times of CO2 emissions as the direct building use of fossil fuels. On the other hand a unit of electrical energy should be more expensive than the equivalent amount of energy obtained through the consumption of fossil fuels in the heating system of the building.
6. CONCLUSIONS
For purposes of comparing energy needs,
obtained by energy billing accounting
procedures or with monitoring dealings, annual energy delivered per useful pavement area normalizes energy related consumptions by building size. These indicators were calculated for each DSF building and compared to European energy benchmarks in office buildings for different countries.
In general, one may say that results have shown good energy performance of DSF
buildings. Nevertheless, some interesting
tendencies were revealed. For example, DSF buildings built in regions where warm seasons are very small and soft do not correspond to a good energy performance for satisfaction of cooling needs, which are higher than expected. This could be associated with lack or ineffective shading devices or even with the impracticality of manual free-cooling by means of opening windows, which is something that is common in Mediterranean countries.
The analysis carried out has clearly shown that energy rating techniques may be applied to better understand the characteristics of the buildings sample and thus organize possible energy improvements and suggest good practices. Future work will assess energy performance indicators towards to clear define classes of buildings with similar energy behavior and also look for establishing a group of best performers.
As conclusion it should be reminded that benchmarks are based on the characteristics of each national building stock and may not be
used elsewhere, even so it has been demonstrated that DSF buildings design may have the benchmarks of best practices in Europe as a target for the designing process.
7. AKNOWLEDGEMENTS
The BESTFACADE project was supported by
EIE/04/135/S07.38652. The sole responsibility for the content of the articles and reports from BESTFACADE lies with the authors. It does not represent the opinion of the European Communities. The European Commission is not responsible for any use that may be made of the information contained therein.
REFERENCES
Farrou I. et al (2007): Best Practice for Double Skin Facades – The BESTFACADE Project; paper accepted to publish in the 2nd PALENC Conference and 28th AIVC Conference – Building Low Energy Cooling and Advanced Ventilation Technologies in the 21st Century. Crete Island, Greece, 21-29 September 2007.
Streicher, W. (2005). BESTFAÇADE – Best Practice for Double Skin Façades EIE/04/135/S07.38652: WP1 Report “State of the Art”, Reporting Period: 1.1.2005 – 31.12.2005.
Matos M. and Duarte R. (2007): BESTFACADE – Best
Practice for Double Skin Façades
EIE/04/135/S07.38652: WP3 Report “Benchmarks and Certification”, Reporting Period: 1.7.2005 – 31.03.2007.
Duarte R. and Matos M. (2006): Energy Benchmarking of Double-skin Façade Buildings; EPIC 2006 Lyon – Technologies & Sustainable Policies for a Radical Decrease of the Energy Consumption Buildings. Lyon, France, 20-22 November 2006.
Blomsterberg A. (2004): Energy use in Swedish office buildings. Input to the BESTFACADE WP3. Slagthuset, Sweden.
Erhorn-Kluttig H. (2007): IEE SAVE BESTFACADE: IBP-input to WP3 Benchmarking. Stuttgart, Germany. Prieus S. and Flamant G. (2006): Energy consumptions of
office buildings in Belgium. Division Energy and Climate, Belgian Building Research Institute.
The Government’s Energy Efficiency Best Practice programme (2000): Energy Consumption Guide 19: Energy use in offices. Garston, UK: BRECSU. National energy data (2006): Energy benchmarks for