www.elsevier.com / locate / chroma
D
ifferent multidimensional chromatographic approaches applied to
the study of wine malolactic fermentation
a a a b ,
*
L. Fernandes , A.M. Relva , M.D.R. Gomes da Silva , A.M. Costa Freitas
a
´ ´ ˆ
Departamento de Quımica, Centro de Quımica Fina e Biotecnologia—CQFB, Faculdade de Ciencias e Tecnologia /Universidade Nova de Lisboa, Quinta da Torre 2829-516 Caparica, Portugal
b ´
ˆ ´ ˆ
Departamento de Fitotecnia, Instituto de Ciencias Agrarias e Mediterranicas—ICAM, Universidade de Evora, Apt. 94, ´
7002-554 Evora, Portugal
Received 11 October 2002; received in revised form 7 March 2003; accepted 18 March 2003
Abstract
Different multidimensional chromatographic techniques were used to study wine aroma pattern changes during malolactic fermentation (MLF). Ethyl lactate enantiomeric ratios were determined using on-line multidimensional gas chromatography. The values found agree with a spontaneous MLF. Off-line multidimensional HPLC / GC was used to deconvolute and enrich the sample and ease enantioselective chromatography. Chiral compound enantiomeric ratio changes during MLF were monitored. Evaluation of enantiomeric ratio changes during MLF has never been studied. (R,R), (S,S ) and meso-butane-2,3-diol and pentane-2,4-meso-butane-2,3-diol (reported in wines for the first time) were submitted to untrained sensory panel tests. All stereoisomers revealed different sensory notes; pentane-2,4-diol showed an aromatic impact.
2003 Elsevier Science B.V. All rights reserved.
Keywords: Enantiomer separation; Malolactic fermentation; Multidimensional techniques; Wine; Pentane-2,4-diol
1
. Introduction chromatographic techniques can be used to prepare
the sample to a refined separation on a second
Multidimensional (MD) separation techniques are separation media [2,3]. The application of
multi-a result of combining two or more independent or dimensional techniques to the analysis of the aroma
nearly independent separation techniques [1]. For compound changes during MLF brought about the
complex samples, multidimensional techniques can possibility of analysing the minor compounds and
provide a remarkable improvement on physical the possibility of their enantiomeric analysis. In wine
separation of individual compounds [1]. In conven- flavour, terpenes, for instance, represent just 1% of
tional MD when the second dimension is a chiral the extract and are known to significantly contribute
column, two aims are achieved: reduced peak crowd- to the bouquet [4,5]. To achieve complete chemical
ing and chiral separation. Off-line multidimensional information on wine volatile compounds, in addition
to compound identification, it is important to study the structural configuration and enantiomeric ratio. In
*Corresponding author. Tel.: 1351-266-760-800x4334; fax:
fact, the enantiomers of a compound can differ
1351-266-711-163.
E-mail address: [email protected](A.M. Costa Freitas). considerably in their odour, quality, and threshold. In
0021-9673 / 03 / $ – see front matter 2003 Elsevier Science B.V. All rights reserved. doi:10.1016 / S0021-9673(03)00517-X
addition, determination of enantiomeric excess (ee) were analysed by HPLC / UV on a Waters instrument
can be used in adulteration detection[6,7].MLF, the model 600E (Waters Corporation, USA) equipped
second wine fermentation, is considered as having with a Waters 2487 Dual l detector and a Rheodyne
the main role of reducing wine acidity. Most of the injector with a 20-ml loop. Detection was achieved at
papers that deal with wine aroma changes during 210 nm on an Aminex HPX-87H column (30037.8
MLF are directed to the aroma impact of different mm) from Bio-Rad. Temperature was kept at 30 8C
21
compounds [8,9], or the study of bacterial influence and flow-rate was 0.6 ml min . Eluent was H SO2 4
[10]. Results are controversial and conclusions are 4 mM. Quantification was achieved by a calibration
somehow different [7]. No authors have directed curve obtained for the concentration range of 6.253
24 22 21
their attention, so far, to the enantiomeric changes 10 –1310 mol l . Correlation coefficients of
produced during this fermentation. In fact, little 0.9997 and 0.9999 were obtained for the calibration
attention has been given to the impact of enantiomers curves of malic and lactic acids, respectively.
on wine aroma [11].The use of conventional liquid Butane-2,3-dione quantification was achieved by
chromatography to the pre-separation of complex SIM-GC–MS analysis of a butane-2,4-dionediacetyl
aroma extracts has already been described and used derivative 6,7-dichloro-2,3-dimethylquinoxaline
in different types of samples [2,12–15].Its use as a (DCDMQ) according to the method already
de-pre-separation technique prior to GC analysis of scribed by Martineau et al. [17]. The derivatives
volatile compounds has not really been examined. were analysed by GC–MS using a MD 800 from
Off-line multidimensional HPLC / GC has allowed Fisons. GC separation was achieved using a DB-Wax
the collection of several fractions that were analysed (J&W Scientific, Folsom, USA) capillary column
by GC and / or GC–MS and, whenever needed, by 30 m30.25 mm I.D. using helium as the carrier gas
enantioselective GC. at a pressure of 100 kPa. Initial oven temperature
Conventional on-line multidimensional GC was 80 8C for 3 min; temperature incremental rate: 20 8C
21
used to determine ethyl lactate enantiomeric excess min up to 200 8C followed by a second ramp of
21
[16]. 10 8C min up to 260 8C. Injector temperature:
200 8C. Interface temperature: 250 8C and ion source 200 8C. Detection was achieved by monitoring the
2
. Experimental fragment ions m /z 74, 109, 144, 185 and 226 for
DCDMQ derivative whereas m /z 57, 85, 113, 183 2
.1. Wine samples and 268 were used for nonadecane (internal
stan-dard). Quantification was accomplished by the area
Wine preparation has been carried out at SOG- ratio versus concentration ratio using the internal
˜
RAPE winery in the Dao region (North Portugal). As standard method. According to others [17]
calibra-soon as alcoholic fermentation was achieved, wines tion curves for DCDMQ were linear within the
were transferred to 50-l inox containers. Both con- concentrations ratios studied. Within run precision
tainers were kept at 18 8C. These containers followed was estimated by injecting the same sample seven
spontaneous MLF. Samples (one 0.75-l bottle) were times. A relative standard deviation of 0.172% was
taken each weekday (during November and De- determined.
cember 1999) until complete MLF (followed by
paper chromatography at the winery) and stored at 2 .3. Ethyl lactate analysis
4 8C. After MLF completion, the remaining wines
were transferred to bottles and kept at 4 8C until For ethyl lactate analysis, 25 ml of wine was
analysis. Two wines were monitored: 0107 and 0105. dealcoholized by vacuum distillation until 75% of
the initial volume. To this solution 2.5 ml of a 2
.2. Sample preparation solution (1% in water) of the internal standard
(methyl lactate) was added and the volume (25 ml)
Organic acids were extracted by SPE using a LC18 made up with deionised water. From this solution,
The extracts were combined and evaporated under Pre and main column were connected via a
live-nitrogen until a final volume of about 2 ml. From switching coupling piece (live T piece). Retention
this solution, 1 ml was used for GC analysis. time on the pre-column was 6.6 min for ethyl lactate.
GC analysis was carried out using a 30 m30.25 Cut time interval was 6.3–6.9 min for ethyl lactate.
mm I.D. DB-Wax column (J&W Scientific), a GOW- Reproducibility was evaluated by injecting the same
MAC series 600 GC (GOW-MAC Instrument Co., sample five times. RSD % was 0.75 for the (R)-ethyl
Shannon, Ireland), and split injection. Oven tempera- lactate and 1.58 for the (S )-ethyl lactate.
ture was kept at 80 8C. Detector and injector
tem-peratures were 280 and 250 8C, respectively. 2 .5. Aroma compound analysis
Ethyl lactate 98% and methyl lactate 98% from
Aldrich were used to prepare the calibration curve. Aroma compounds were extracted as previously
Quantification of ethyl lactate was achieved by the described [18]; 50 ml of wine were used to which
internal standard method. Calibration curves were octan-2-ol was added as internal standard at a
21
obtained for a concentration range of 9.8–2507 mg concentration of 5 mg l . The wine was extracted
21
l of ethyl lactate using methyl lactate as internal three times using 151515 ml of dichloromethane.
21
standard in a concentration of 312.4 mg l and After extraction, the organic layers were collected in
dichloromethane as the solvent. The calibration the same flask and dried over anhydrous sodium
2
curve is linear with R 50.9996. sulphate (E. Merck). The extracts were concentrated
by rotary evaporator and gentle nitrogen stream to a 2
.4. Multidimensional analysis final volume of about 100 ml (for direct GC
in-jection) and to 500 ml when previous HPLC
pre-For enantioselective GC, a 30 m30.25 mm I.D. fractionation was carried out.
tailor-made fused-silica capillary column coated with
0.25 mm film thickness of 15% heptakis (2,3-di-O- 2 .6. Pre-fractionation by HPLC
methyl-6-O-tert.-butyldimethylsilyl)-b-cyclodextrin
in SE 52 (DiMe) was used. GC conditions were: Four hundred microliters of extract was
fraction-temperature 65 8C for 5 min and then linearly heated ated in two successive injections on an HPLC Waters
21 21
at a rate of 2 8C min to 85 8C and then 6 8C min model 600E equipped with a UV detector Waters
up to 220 8C with a holding time of 15 min. Carrier 2487 using a 200-ml sample loop. Fractions were
gas velocity was adjusted to a hold up time of 60 s collected every 2 min. The final total volume of
for methane at 100 8C. Enantio-multidimensional sample was 8 ml. The column used was a
semi-GC–MS (e-MDGC)–MS, was carried out with a preparative Interchim column (Interchim,
Mon-Siemens SiChromat 2.8 double oven gas chromato- tluc¸on, France); 250310 mm packed with
Lich-graph and a GCQ ion trap detector (Finnigan Mat), rosorb diol (particle size 5 mm). The initial eluent
connected to the main column by the ITD transfer was pentane / diethyl ether (9:1 v / v) increased to
line with an open split interface. The first oven held 100% ether in 30 min. The column was then
a pre-column (30 m30.25 mm I.D. fused-silica equilibrated with methanol for 20 min, reequilibrated
capillary coated with SE 52) and was equipped with with ether for 5 min and again pentane / ether (911
a flame ionisation detector. Carrier gas helium 2.20 v / v) for an extra 5 min. All solvents were HPLC
21
bar; split / splitless injector 250 8C; detector 250 8C; grade. The flow-rate was 2 ml min . Fractions were
Oven temperature 60 8C linearly increases at a rate of concentrated to about 100 ml before GC analysis.
21
5 8C min to 250 8C. The second oven was
equipped with a 30 m30.25 mm I.D. fused-silica 2 .7. Gas chromatographic and gas
capillary, BGB 176 (BGB Analytical Vertrieb, chromatography –mass spectrometric analysis
Schlobboeckelheim, Germany) (DiMeb-CD), Oven
21
temperature was 45 8C for 5 min then 5 8C min up Gas chromatographic analysis was carried out with
to 220 8C. ITD transfer line 250 8C, helium sweeping a GOW-MAC series 600 gas chromatograph
(GOW-21
ionisa-tion detector (FID), linked to a PC with Chromeleon 2 .9. Panel tests (Dionex) software. GC separation was carried out on
a DB-Wax 60 m30.25 mm I.D., film thickness 0.25 To verify aromatic impact, the three stereoisomers
mm (J&W Scientific). Operating conditions were as of butane-2,3-diol and pentane-2,4-diol were
sub-follows: injector and detector temperature 250 8C; mitted to an untrained sensory evaluation panel.
21
carrier gas, H2 1 ml min ; oven temperature Different aqueous stock solutions were prepared as
21 21
program, 3 min at 50 8C then 2 8C min up to follows: meso-butane-2,3-diol 0.006 ml ml , (S,S
)-210 8C and held until the end. Injection volume was butane-2,3-diol and (R,R)-butane-2,3-diol 0.01 ml
21 21
between 0.5 and 1.0 ml. Injection mode: splitless for ml , and pentane-2,4-diol 0.05 ml ml . Several
1 min. successive dilutions of these stock solutions were
For enantioselective chromatography, a 30 m3 used.
0.25 mm I.D. tailor-made fused-silica capillary col- To each panelist, a glass with between 10 and
umn coated with 0.25 mm film thickness of 15% 20 ml of each dilution was given. Panelists were
heptakis (2,3-di-O-methyl-6-O-tert.-butyldimethyl- asked to assign a description and note the limit above
silyl)-b-cyclodextrin in SE 52 (DiMe) was used. GC which aroma could be detected.
operating conditions were the same, except for a higher GC time. The oven was programmed from
210 to 220 at 10 8C and held until the end. Chroma- 3 . Results and discussion
tography was carried out using the same GC
ap-paratus. The so-called ‘‘key turn points’’ (start, middle and
GC–MS analysis was carried out using a GC- end) of MLF were determined by controlling the
Trace Thermo Quest Instrument coupled to a MS- evolution of the ratio lactic / malic (L / M) acids,
Trace Finnigan-Mat (EI, 70 eV) and the same DB- starting just after alcoholic fermentation. This ratio
Wax column. Analytical conditions: interface tem- increases with time. After the 17th day, the
con-perature 220 8C; ion source temcon-perature 200 8C. GC centration of malic acid could not be detected for
operating conditions were identical to those de- wine 0107, whilst wine 0105 shows a ratio (L / M) of
scribed above, using helium as the carrier gas. The 95 after 21 days. Butane-2,3-dione (a key compound
mass spectrometer was scanned either over the range of MLF) [17,19,20] reaches a maximum (around
m /z 40–300 or by time-scheduled selected ion days 12–14), decreasing at the end of MLF when the
monitoring (SIM). SIM was used to achieve better L / M stabilizes. These results are in good agreement
identification and R /S ratio determinations. with the evolution followed by the L / M ratio. These
two sets of results were used to determine the 2
.8. Standards used for stereoisomer identification evolution of MLF. Ethyl lactate increases during
21
MLF from 0.06 to 14.20 mg l for wine 0105 and
21
(R,R)-Butane-2,3-diol; (S,S )-butane-2,3-diol and 0.15 to 47.78 mg l for wine 0107. These results
meso-butane-2,3-diol used for stereoisomer identifi- are in agreement with others that concomitantly refer
cation were purchased from Sigma with 97, 99 and to unpleasant notes when its intensity is too high
97% enantiomeric purity, respectively; ethyl(R)-(2)- [21]. The enantiomeric ratio of the produced ethyl
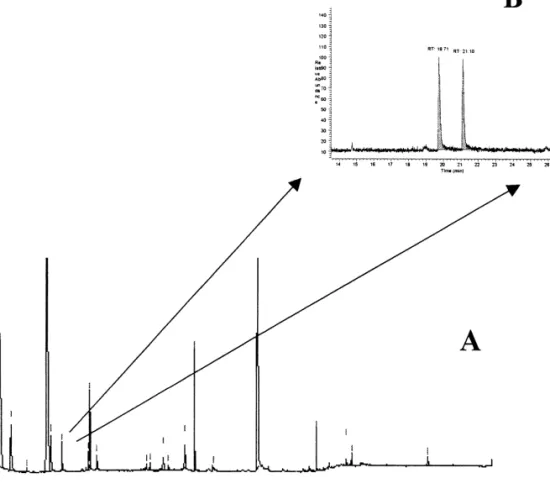
hydroxybutyrate was purchased from Aldrich with lactate was monitored at the start middle and end of
98% enantiomeric purity while the S compound was MLF, using on-line multidimensional GC (Fig. 1). In
also from Aldrich but with 99% enantiomeric purity. fact at the beginning of MLF, while there is a high
Pentane-2,4-diol was also from Aldrich and both malic acid concentration, one observes a ratio R /S of
stereoisomers had an enantiomeric purity of 99%. 62:38 for the 0107 wine and 78:22 for 0105.
For 2-methylbutan-1-ol, only the S enantiomer was However, in both wines, this ratio decreased during
tested (from Aldrich) with an enantiomeric purity of MLF reaching the ratios of 53:47 and 57:53 for the
99%. (S )-Ethyl lactate was from Aldrich with an respective wines at the end of MLF.
Semi-quantita-enantiomeric purity of 98%. All optical purities were tive data has shown that whilst the R enantiomer was
Fig. 1. Enantio-MDGC–MS (A) of a wine using a 30 m30.25 mm I.D. fused-silica capillary coated with SE-52 as pre-column and a 30 ¨
m30.25 mm I.D. fused-silica capillary, BGB 176 (BGB Analytic Vertrieb, Schloßbochelheim, Germany) (DiMe b-CD) as main column. Pre and main column were connected to a live-switching coupling piece (live T-piece). The elution orders of the substances studied were assigned using reference materials of definite chirality. Retention time on the pre column was 6.6 min for ethyl lactate. Cut time interval was: 6.3–6.9 min for ethyl lactate (B).
21
during MLF the S enantiomer was raised 85–78%. ml of wine) were calculated from peak area of
The high percentage of (S )-ethyl lactate found in components versus area of internal standard[22];no
these samples agrees with the induction of MLF by response factors were used [1,14,22]. We could
spontaneous infection [16]. observe from data on Table 1 that some of the
To study the evolution of volatile compounds compounds rose and others decreased during MLF.
during MLF, dichloromethane extracts of wine sam- Most, however, did not suffer any change. Belonging
ples were analyzed at previously determined ‘‘key to the first group are: 3-hydroxybutan-2-one, ethyl
turn points’’. The GC and GC–MS-TIC chromato- lactate, 3-methylbutan-1-ol, diethyl succinate,
2-grams obtained are rather complex and do not show phenylethanol, 2-methylpropan-1-ol, both peaks of
relevant qualitative differences. Volatile compounds butane-2,3-diol (meso, and the enantiomeric pair R,R
were tentatively identified from their mass spectra by and S,S), and the acetic and hexanoic acids. Between
comparison with library data (Wiley Spectral li- the groups of compounds that decreased during MLF
brary). Table 1 shows the identified compounds in are the acids and some alcohols; 3- and
2-the three stages of MLF studied, an asterisk denotes methylbutan-1-ol, propane-2,3-diol,
T able 1
Semi-quantitative analysis of compounds identified in wine 0107 (total sample) at start, middle and end of MLF
Peak no. Compound name Begin FML Middle FML End FML
1 Isobutyl acetate 0.0925 0.1762 0.0358 2 Propan-1-ol – – 0.1736 3 2-Methylpropan-1-ol 1.0598 1.0072 3.1346 4 Isopentyl acetate 0.6170 0.9458 0.0539 5 Butan-1-ol 0.0525 0.0579 0.0528 b,d 6 312-Methylbutan-1-ol 4.7099 4.4395 2.2246 7 Ethyl hexanoate 0.0683 0.0863 0.0333 b,d 8 3-Hydroxybutan-2-one 0.6879 1.4029 1.9251 b,d 9 Ethyl lactate 0.7390 1.3524 2.3211 10 Hexan-1-ol 0.2867 0.2546 0.2015 11 3-Ethoxypropan-1-ol 0.0438 0.0342 0.0222 12 Hex-3-en-1-ol 0.0081 0.0101 0.0096 a 13 Octan-2-ol 1.000 1.000 1.000 c c c 14 Ethyl octanoate 0.0164 0.0200 0.0448 c c c 15 Acetic acid 0.2827 0.4004 0.8113 16 Furfural – – 0.0040 17 Isopentil hexanoate 0.0311 0.0242 – b,d 18 2-Ethylhexan-1-ol 0.0832 0.0688 0.0061 b,d 19 Ethyl 3-hydroxybutanoate 0.0650 0.0730 0.0321 20 Benzaldehyde 0.0156 0.0128 – b,d 21 (R,R)1(S,S) Butane-2,3-diol 1.4645 1.2329 2.9051 22 Octan-1-ol 0.0067 0.0081 0.0050 23 2-Methylpropanoic acid 0, 1902 0.1888 0.1151 b,d 24 meso Butane-2,3-diol 0.3498 0.2347 1.2214 d 25 Propane-1,2-diol 0.0966 0.0732 0.0092 26 Butanoic acid 0.1011 0.0913 0.0524 27 N-Ethylacetamide 0.0571 0.0287 0.0367 b 28 Butane-4-lactone 0.8326 0.7557 0.8477 29 Ethyl decanoate 0.0138 0.0084 – 30 3-Methylbutanoic acid 0.2301 0.2292 0.1010 31 Diethyl succinate 0.5974 1.2272 1.2225 32 3-(Methylthio) propan-1-ol 0.1309 0.1368 0.0390 33 Ethyl 4-hydroxybutanoate 0.2236 0.4531 0.3362 34 2-Phenylethyl acetate 0.1128 0.1454 0.0139 c c c 35 Hexanoic acid 0.0196 0.0202 0.2159 36 N-Isopentylacetamide 1.9076 1.5734 1.7834 37 Benzyl alcohol 0.0270 0.0091 – 38 Phenylethyl alcohol 2.4768 2.0476 3.6624 d c c c 39 Diethyl hydroxybutanedioate 0.0869 0.0521 0.0229 40 Octanoic acid 0.4397 0.4136 0.3104 41 4-Ethenyl-2-methoxyphenol 0.0832 0.0688 0.0061 42 Decanoic acid 0.0886 0.0469 0.0403 43 Monoethyl succinate 4.1454 5.3307 9.4582 44 N-(2-Phenylethyl) acetamide 0.2502 0.2332 – a Internal standard. b
Identified with standards. c
Areas calculated by SIM. d
Chiral compounds.
relevant change. In order to simplify and resolve separation was achieved by HPLC (first dimension)
coelution problems, an off-line multidimensional followed by a second separation by either normal
allowed the fractionation of the extract by compound synthetic chiral aroma substances. Among the chiral
families, 22 fractions were collected. The analysis of compounds identified: butane-2,3-diol; ethyl
3-hy-these fractions by GC–MS allowed further identifica- droxy butyrate; 3-hydroxybutan-2-one;
pentane-2,4-tion of an addipentane-2,4-tional 38 compounds (Table 2). This diol and 2-methylbutan-1-ol were submitted to
enan-method acknowledged: (a) the identification of a tioselective GC. The identification of the different
large number of compounds that could not be stereoisomers was obtained by either coinjection
identified before, probably, because they coeluted with pure enantiomeric standards or biosynthetic
with major compounds; (b) the identification of trace deduction as proposed further for
3-hydroxybutan-2-compounds; (c) the separation of compounds that one. Quantification to assess enantiomeric ratios
normal GC, using Carbowax-coated columns was not during MLF was achieved by means of
enantioselec-able to separate, like 3-methylbutan-1-ol and 2- tive GC–MS-SIM using the following characteristic
methylbutan-1-ol. During fractionation, the first ap- m /z ions: 76, 117, 88 and 71, respectively for
peared in fraction 11 whereas the second came in butane-2,3-diol, ethyl 3-hydroxybutyrate,
3-hydroxy-fraction 10. To the aroma of 3-methylbutan-1-ol, oily butan-2-one and pentane-2,4-diol. Quantification was
and whiskey aromas have been assigned [23,24] not necessary for 2-methylbutan-1-ol because only
whilst the 2-methylbutan-1-ol has not been referred the S enantiomer was found during MLF. Fig. 2
as having any aromatic signature. shows the enantiomeric ratio of these compounds at
The chiral compounds identified (Table 1) de- the three key points of MLF. For ethyl
3-hydroxy-served special attention. The biosynthesis of these butyrate, we could not observe quantitative
enantio-compounds is often enantioselective [6], and the meric changes during MLF, the aroma related to this
quantification of the enantiomeric ratio can be used compound is fresh, fruity and grape-like [23,24];
to improve the knowledge of the aroma and quality 3-hydroxybutan-2-one and butane-2,3-diol on the
of wines. In addition, determination of enantiomeric other hand showed a different behaviour. To assess
excess (ee) can be used to detect aromatisation with the order of elution for the three stereoisomers of
butane-2,3-diol, each enantiomeric standard were separately injected. The order of elution was as
T able 2
follows, R,R followed by the S,S and the meso
Compounds identified after fractionation by HPLC
compound come at the end. For
3-hydroxybutan-2-Alcohols Acids
one, no enantiomeric forms were available, however,
Glycerol Hexadecanoic acid
following Prelog’s rule, the yeast-reduction of
Pentan-1-ol Esters
a
Pentan-2-ol Ethyl acetate butane-2,3-dione produced (S
)-3-hydroxybutan-2-a
2-Methylbutan-1-ol Ethyl pyruvate one, further reduction yields the corresponding 2,3-a
3-Methylbutan-1-ol Propane-1,3-diol, diacetate
butanediol predominantly in the anti-configuration,
cis Hex-3-en-1-ol Diethyl malonate
which is in accordance with our results, where the
trans Hex-3-en-1-ol Hexyl acetate
meso form rose in the early stage of MLF. It seems
3-Methylpentan-1-ol Butane-1,4-diol, diacetate
4-Methylpentan-1-ol Octyl acetate natural to conclude that the (S
)-3-hydroxybutan-2-Heptan-1-ol Lactones one is the enantiomer that concomitantly decreases. 2,6-Dimethoxyphenol Pentane-4-lactone
This result is in accordance with similar orders of
Nonan-1-ol Aldehydes
elution found by others [25] for compounds having
Nonan-2-ol Phenylethanal
similar structures. Special attention has been
ad-3-(2-Hydroxyethyl)-indol Nonanal
Decan-1-ol Terpenes dressed to pentane-2,4-diol, which was only
iden-a
Pentane-2,4-diol Linalool tified at the end of MLF (fraction 18). This com-a
Acids Nerol
pound has never been noted as part of wine aroma
Propanoic acid Geraniol
nor, to the best of our knowledge, as part of the
2-Methylbutanoic acid Citronelol
aroma of fruit. Its identification was carried out by
Pentanoic acid Others
trans Hex-2-enoic acid Dimethyl sulfone GC–MS spectral analysis, retention time, and
in-Heptanoic acid Furfurol jection of a standard under similar conditions. Elu-a
Fig. 2. Ratio of selected isomers found along the three stages of MLF.
by e-GC–MS. Literature [26] notes that (R,R)-pen- never been noted as part of wine aroma, its odorant
tane-2,4-diol can be obtained by enantioselective impact was also tested; two-thirds of the panelists
reduction of acetylacetone (pentane-2,4-dione) from attributed an aroma descriptor and still recognized
21
the resting cells of methanol yeast, Candida boidini, the aroma at a concentration of 6 ml l .
a wild yeast that can also be present during wine processing. Although contamination cannot be com-pletely excluded, the fact that the compound was
A
cknowledgements present in two different wines virtually excluded this
assumption. Pentane-2,4-dione and
4-hydroxypentan-We wish to thank Professor A. Mosandl, Johann 2-one were also detected in the three stages of MLF
Wolfgang Goethe University, for the use of the
studied. These compounds are not listed inTables 1
˜ ˆ
MDGC–MS apparatus and Fundac¸ao para a Ciencia
and 2since these just refer to compounds previously
e Tecnologia for financial support as POCTI /AGR / cited in the literature.
11116 / 98. To demonstrate the impact of enantioseparation,
water solutions of the three stereoisomers of butane-2,3-diol and pentane-2,4-diol were sniffed by an
untrained panel. Descriptors used were not suggested R eferences
or confirmed by positive assignment. Results clearly
show that each stereoisomer of butane-2,3-diol has a [1] W . Bertsch, J. High Resolut. Chromatogr. 12 (1999) 647.
´
[3] V . Ferreira, R. Lopez, A. Escudero, J.F. Cacho, J. Chroma- [15] H . Komae, N. Hayashi, J. Chromatogr. 114 (1975) 258. togr. A 806 (1998) 349. [16] A . Kaunzinger, M. Wust, H. Grobmiller, S. Burow, U. [4] V . Ferreira, M. Sharman, J.F. Cacho, J. Dennis, J. Chroma- Hemmrich, A. Dietrich, T. Beck, U. Hener, A. Mosandl, A.
togr. A 731 (1996) 247. Rapp, Z. Lebensm.-Unters.-Forsch. 203 (1996) 499. [5] A . Rapp, Nahrung 42 (1998) 351. [17] B . Martineau, T. Henick-Kling, T. Acree, Am. J. Enol. Vitic. [6] H .D. Belitz, W. Gorsch, Food Chemistry, Springer, Heidel- 46 (1995) 385.
berg, 1999, p. 329. [18] C . Cocito, G. Gaetano, C. Delfini, Food Chem. 52 (1995) [7] D .R. Davis, D. Wibowo, R. Eschenbruch, T.H. Lee, Am. J. 311.
Enol. Vitic. 36 (1985) 290. [19] B . Martineau, T. Acree, T. Henick-Kling, Biotechnol. Tech. [8] T . Henick-Kling, T.E. Acree, S.A. Krieger, M. Laurent, W.D. 8 (1994) 7.
Edinger, Wine East, 3rd Biotechnology Dossier, Vignevini, [20] Y . Hayasaka, E. Bartowsky, J. Agric. Food Chem. 47 (1999)
1994, pp. 120–138. 612.
[9] M .H. Laurent, T. Henick-Kling, T.E. Acree, Vitic. Enol. Sci. [21] T . Henick-Kling, Malolactic fermentation, in: G.H. Fleet
49 (1994) 3. (Ed.), Wine Microbiology and Biotechnology, Harwood
[10] F . Tateo, M. Bononi, F. Trambaiolo, S. Cunial, in: P. Sandra Academic, Chur, 1993, p. 289.
(Ed.), Proceedings of the 18th International Symposium on [22] E . Valero, M.J. Villasenor, J. Sanz, I. Martinez Castro, ¨
Capillary Chromatography, Huethig Verlag, Heidelberg, Chromatographia 52 (2000) 340.
1995, p. 1122. [23] F lavors and Fragrances, 2001, Aldrich, International Edition. [11] G . de Revel, N. Martin, L. Pripis-Nicolau, A. Lonvaud- [24] T . Acree, H. Arn, inhttp: / / www.nysaes.cornell.edu /
flavor-Funel, A. Bertrand, J. Agric. Food Chem. 47 (1999) 4003. net / index.html
[12] M .S.F. Ross, J. Chromatogr. 118 (1976) 273. [25] A . Dietrich, Ph.D. Thesis, Johann Wolfgang Goethe Uni-[13] M .S.F. Ross, J. Chromatogr. 160 (1978) 199. versity, Frankfurt am Main, 1996.
[14] J .E. Newbery, M.P. Lopez de Haddad, J. Chromatogr. 260 [26] S . Matsumura, Y. Kawai, Y. Takahashi, K. Toshima,