i Universidade Católica Portuguesa
Catolica Lisbon School of Business & Economics
Equity Research
Mota Engil SGPS
Pedro Miguel Rodrigues Valério Da Silva Moreira, 152110097
Abstract
Equity Valuation has been since the beginning a generator of controversy among authors. New methods have been developed throughout time and even though they are clearly justified, weakenesses have been pointed to each one. The growth, increased speed and connection of modern economies, implies a more detailed and appropriate valuation of corporations. The purpose of this dissertation is to provide a general view over the concept and methods of equity valuation, through a review of the extensive literature and the valuation of Mota-Engil SGPS.
Advisor: José carlos Tudela Martins
Dissertation submitted in partial fulfillment of requirements for the degree of Masters of Science in Economics, at the Católica Lisboa School of Business and Economics, 17th Semptember 2012
ii I. Acknowledgments ... vi II. Overview ... vi 1. Executive Summary ... vi 2. Literature Review ... i 2.1 Introduction ... i 2.2 Methodology ... 2
2.1.1 Dividend discount model ... 2
2.1.2 Multi-Stage Dividend Discount Model ... 4
2.2 Discounted cash Flow ... 6
2.2.1 The differences in the DCF model ... 7
2.2.1.1 FCFF ... 7
2.2.1.2 FCFE ... 10
2.2.1.3 Capital Cash Flow ... 10
2.2.1.4 APV ... 11
2.2.2 Important issues to consider in the DCF methodology ... 14
2.2.2.1 Cost of equity ... 14
2.2.2.2 Cost of debt (Beta) ... 14
2.2.2.3 Risk free rate ... 15
2.2.2.4 Risk premium Rate ... 16
2.2.2.5 Terminal value ... 16
2.3 Relative Valuation (Multiples) ... 16
2.3.1 Importance of defining a good peer group ... 17
2.3.2 Enterprise vs equity multiples ... 17
2.3.3 Using the right multiple ... 17
2.4 Options valuation ... 18
2.5 Other Valuation approaches ... 19
iii 3. Mota-Engil SGPS ... 19 3.1.1 Company Presentation ... 19 3.1.2 Shareholders Structure ... 20 3.1.3 Martifer ... 21 3.1.4 Ascendi Group ... 22
3.1.5 Mota-Engil in the Stock Exchange ... 22
3.2 Industry overview ... 25
3.2.1 The construction sector, Engineering, Cement and GDP in Portugal ... 25
3.2.2 Central Europe ... 29
3.2.3 Africa ... 31
3.2.4 America... 34
3.3 Competition Overview ... 35
3.4 Cyclical Industry ... 36
4 Valuation of Mota Engil SGPS ... 37
4.1.1.1 Engineering & Construction ... 37
4.1.1.2 DCF ... 39 4.1.2.1 E&S ... 40 4.1.2.2 DCF ... 41 4.1.3.1 Ascendi ... 42 4.1.3.2 DCF ... 43 4.1.4 Martifer ... 44 4.2 Cost of capital ... 44
4.2.1 Risk free rate ... 44
4.2.2 Country risk premium ... 44
4.2.3 Beta estimation ... 45
4.2.4 Cost of debt ... 45
iv
4.4 Multiples ... 48
4.5 Net Debt ... 49
4.6 Dividend Discount Model ... 49
4.7 Sensitive analysis ... 49
5. Dissertation Comparison with Millennium Investment bank Valuation ... 51
6. Conclusion ... 53
7. Appendices ... 54
7.1 Appendix 1 (Terminal Value) ... 54
7.2 Appendix 2 (Other valuation approaches) ... 55
7.3 Appendix 3 (Other valuation issues) ... 57
7.4 Appendix 4 (General Economic Review of Mota Engil SGPS) ... 59
7.5 Appendix 5 (Martifer Financial Info) ... 68
7.6 Appendix 6 (Ascendi concessions) ... 71
7.7 Appendix 7 (Brazilian market analysis) ... 72
7.8 Appendix 8 (E&C Turnover Sources) ... 75
7.9 Appendix 9 (E&C Capex, Nwc, Depreciation info.) ... 77
7.10 Appendix 10 (Terminal Value Stable Growth Rate) ... 79
7.11 Appendix 11 (sum of the parts DCF, company’s info.) ... 80
7.12 Appendix 12 (E&S Capex, Nwc, Depreciation, info.) ... 83
7.13 Appendix 13 (Ascendi’s PPP revaluation) ... 84
7.14 Appendix 14 (Rating Methodology, Moody’s) ... 85
7.15 Appendix 15 (Beta Estimation) ... 86
7.16 Appendix 16 (Income statement DCF, Company’s info.) ... 87
7.17 Appendix 17 (Multiples, PER, EV/EBITDA)... 90
7.18 Appendix 18 (Net Debt) ... 91
7.19 Appendix 19 (Dividend Discount Model Data) ... 93
7.20 Appendix 20 (Sensitive analysis, rating effect) ... 93
v
7.22 Appendix 22 (Balance Sheet Info.) ... 95
7.23 Appendix 23 (Income Statement Info.) ... 97
8. Bibliography ... 98
8.1 Literature ... 98
8.2 Research ... 100
8.3 Industry Sources ... 100
8.4 Company and Competitors data ... 101
vi I. Acknowledgments
In order to fulfill the development of this dissertation, it fundamental the contact and assistance of a certain group of people, without whom it would not be possible the realization of this academic work.
First of all, I would like to thank Dr.João vermelho of Mota-Engil SGPS, who was always available to provide the information needed for the valuation process and any information regarding the company’s operations, as well as the knowledge he provided me regarding the valuation methodology.
Second, I am thankfull to the entire Millenium Investment Bank Equity team. Particularly Dr. Luís Feria and Dr. António Seladas. For being always available and support the comparison between the valuation done in this dissertion and the one realized by the bank.
Last, I am greatful to Professor José Carlos Tudela Martins, for being always available for any doubt regarding the academic work as well the important advices given to improve the dissertation.
II. Overview
Practitioners have developed Equity research with a vast, complex and rich literature, which is the base of this work. As any complex theme, the theories supporting it are debatable and subjugated to different opinions.
In literature terms, the main goal was to provide a general view of the different approaches that compose a company’s valuation process. Some contradictory approaches within a certain theory have been exposed, so that the lack of consensus in some points would be observable. However clearness was a concern, so that the main goal of providing a global and real sample would be fulfill. Some specific questions, such as valuing emerging markets or cyclical firms have been developed due to the nature of the company’s analyzed further, but also because of the relevance that both questions are gaining for valuation purposes nowadays.
vii
Recommendation Buy
Price target € 1,92
Price (01/08/2012) € 1,006 FY 2012
Reutersers EGL.LS
Bloomberg EGL.PL Upside 91% No. Shares (mn) 205 Market cap (€mn) € 205 FY 2012(f) 2013(f) Turnover (€mn) € 2.499 € 2.664 EBITDA mg 13,33% 12,80% Net Profit (€mn) € 79,21 € 78,57 EPS € 0,199 € 0,198 DPS € 0,108 € 0,108 ROE 9,55% 9,39% Dividend Yield 6,50% 5,75% 1. Executive Summary
Mota-Engil is one of the biggest Portuguese Companies, and the main reference in the construction sector in the Country. Present in 19 countries, spread between Europe, Africa and America, the company operates in two different business areas. Engineering and Construction which is the core activity, and Environment and Services, mainly developed in Portugal.
The Engineering and Construction sector, continues to be the main activity of the company. The exponential increase in order book particularly in Africa and Latin America predicts a positive year for 2012. While in Poland, low EBITDA margins due to high competition turned the market less attractive.
The Environment and Services have recently reached a 20% weight in the total turnover of the company. However, the main incidence in Portuguese market leads predictions to be cautious in this Area. Although an increase in the Logistics operations is expected due to the expansion of exportations in the country. In terms of investments, the participation in Martifer is overshadowing the good performance of the company in its core activities. And for Ascendi, even though the company knows more or less with what can count for the future, the revaluation of the PPP’s by the Portuguese Government may compromise the profitability of the company.
Financially it is also important to highlight the high debt level of the company. Even though the company is making an effort to decrease it, the increase in the order book and the consequent need to expand will hamper the intentions of the company.
Mota-Engil SGPS is listed in Portuguese Stock exchange, Euronext Lisboa, and at the beginning of 2012 the company valued €1,035 per Share, giving it a upside potential of 58%. For a price target of €1,66 and a market capitalization of approximately €336 million euros.
0 0,2 0,4 0,6 0,8 1 1,2 1,4 M a y-0 7 M a y-0 8 M a y-0 9 M a y-1 0 M a y-1 1 M a y-1 2 PSI 20 Mota-Engil PSI-20 vs Mota-Engil
Mota-Engil SGPS
Company Valuation 2012
1 2. Literature Review
2.1 Introduction
Financial markets are constantly growing up, making corporate valuation a more significant process. The importance of proper valuation is now more relevant than ever, as mergers, acquisitions, high volume transactions, IPO’s, financial restructuring or project valuation are becoming more common. Every day, investors, research analysts or portfolio managers deal with the most important question of their activity: How much does a certain asset value? It is this simple question that generates numerous, complex and contradictory answers and may safeguard the health of a certain investment decision. (Pinto, Henry, Robinson, Stowe, 2010)
Listed companies, see their evaluation changing constantly due to changes in macroeconomic variables, the company’s business characteristics or the business environment they face.
However, mergers and acquisitions or IPO’s involve not only listed companies making the valuation of private companies also part of this complex theme. Analysts tend to follow two different sets of approaches: (1) the use of transaction multiples of other private companies, (2) comparing the company with listed firms, making the necessary adjustments so that a proper value is reached. (Damodaran,2012)
There is no rules book, on what method should be applied in a given company. But it is relevant to choose an accurate model, which may depend on the intentions behind the valuation. The life cycle of a firm, future forecasts or the capital structure, are some of the factors needed to be considered when selecting the valuation methodology (Talmor, Vasvari, 2011).
The main differences between practitioners when computing a valuation, is the assumptions used. Even when using the same method, analysts may reach a wide range of possible values depending mainly on the macroeconomic variables used. Changes in the whole economy, such as exchange rates or inflation, play the main role of valuation techniques with slightly mistakes compromising the validity of the process (Damodaran, 2002).
Corporate valuation is then a process which exceeds the company itself. If the company acts in several countries, there is the need to pay attention to the macroeconomic environment, so
2 forecasts are done properly. The company’s competition must not be neglected from the valuation, as well as the portfolio of investments hold by the company.
2.2 Methodology
2.1.1 Dividend discount model
The Dividend Discount Model (DDM), it is widely refer as the oldest valuation method still used. Developed by John B. Williams in 1931, has in its basis the equity cash flows, namely the dividends paid. Considering this, the value of share is defined as the present value of the cash payments, provided by owning the titles. (Armitage, 2005)
According to Brigham and Houston (2011) the cash flows that shares are entitled with depend on two components: (1) The dividends mentioned above that constitute one investor’s right. (2) And the price received by the same investor when he sells the shares. Taking into account that the price of a share is defined by the evolution of future dividends, the PV of the same is equal to share’s price today.
Although modern literature sometimes looks to the dividend discount model as a very conservative and inappropriate model, some of its assumptions may be used as base concepts for other discounting cash flow methods. To consider this valuation method it is necessary to consider 4 different approaches developed in literature. (1) The Gordon Growth Model, (2) Two Stage Dividend Discount Model, (3) The H Model for Valuing Growth, (4) Three Stage Dividend Discount Model.
Both two stage dividend discount models will not be considered, has they may point to very specific situations and both use opposite approaches.
3 The Gordon Growth Model is going to be consider for analysis, due to the contribuition of Myron J.Gordon theory (1962), which constitutes a simple improvement of the general form of the DDM, looking forward the perpetuity of the discounted cash flows (Poitras , 2011).
g
-Ke
DPS1
Share
per
Value
(1) Where,DPS1= Dividends per share Ke= Cost of equity
G= Growth Rate
Although it excels for the simplicity of the mathematical terms, the assumption behind the estimation of the cost of equity, demands the usage of an accurate risk free rate, share’s beta and equity premium, since the basis of calculation is CAPM (Armitage, 2005).
)
R
-R
(
-R
Ke
f
L
m f (2) Where,Ke= cost of equity Rf = Risk free Rate
βL= Systematic risk of the company Rm – Rf = Market Risk Premium
The growth rate used has a determinant impact in the valuation process, has slightly changes of it may have a great impact in value obtained. There are two insights which need to be kept in consideration when computing the growth estimation. First of all, the growth rate estimated is
4 intended to last forever and secondly it must assume reasonable values, specifically within the growth rate of the economy, (damodaran, 2011)
2.1.2 Multi-Stage Dividend Discount Model
However, some companies may reveal unstable growth rate, dividends or payout ratios, essential factors for the well function of the Gordon model. In this case we may consider a Multi-Stage approach, particularly a three stage Dividend Discount model.
P
0=
n n st , e n n 2 n 2 n t 2 t e,t t t 1 n t 1 t e,hg t a t a 0 r 1 g k g 1 EPS k 1 DPS k 1 g 1 EPS
(3) Where,EPSt = Earnings per share, year t DPSt = Dividends per share, year t
ga= Growth rate, high growth period (n1 periods) gn= Growth rate, infinite stable period
a = Payout ratio for the high growth period
n = Payout ratio for the Infinite stable growth period ke = Cost of equity, for all different periods, (hg), (t), (st)The three stage growth model has become the most famous multi stage approach. It assumes that all companies go through three phases, imposing a higher flexibility in terms of growth rate, market risk and payout ratios, in comparison with the Gordon Model .
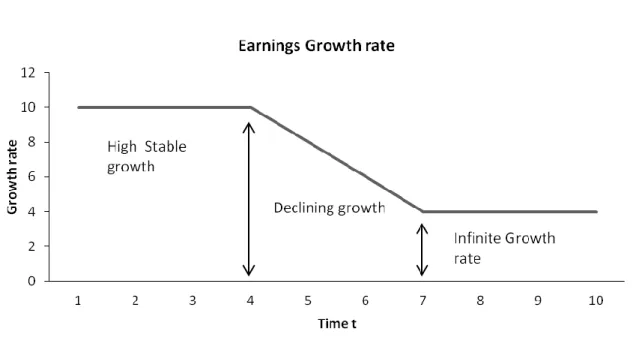
5 Figure 1: Growth DDM; Three stage model
So, as it is showed in the image above, in a first phase, the company faces a high growth rate experience, probably above the economy’s growth rate generating high and rapid earnings. In transitional phase the company is starting to become mature, and cash flows and growth rate are now turning towards the general economy. At the end in the third and final stage, the company is expected to grow at the same level of the economy as a whole, in a infinite stable state(Fabozzi, 2009).
6 Although it seems strange in graphical analysis, in the final stage, investors may receive higher dividends, as the investment needs of the company are now lower.
2.2 Discounted cash Flow
The Discounted Cash Flow method (DCF) uses in its basis, the projections related with future cash flows of a company, discounting this same cash flows at a determined rate in order to achieve the present value.
In General, Financial authors describe four different approaches to value a company by so: 1) Free Cash Flow to the Firm (FCFF), 2) Free Cash Flow to Equity (FCFE), 3) Adjusted Present Value (APV), and 4 ) Capital Cash Flows (CCF) (Oded & Michel,2007)
Value =
n t 1 t t tr
1
CF
(6) Where,CFt = Cash Flow at period t r = Discount rate
Although through a basic analysis, it seems an easy, clear and precise method it has been shown in different literature that the clearness of the method has been challenged by different authors.
In order to particularly analyze this method we need to consider some key concepts, as the free cash flow (FCF), the cost of capital (WACC), the cost of equity (ke), growth rate (g). These concepts have been debated by different authors and different perspectives will be presented here.
7 2.2.1 The differences in the DCF model
The DCF method as well as the other valuation approaches, is defined through massive assumptions. Slightly movements on the assumptions made differently by analysts will tamper the final results obtained. The valuation results from future predictions of numerous variables must be made in different prediction scenarios, in order to absorb the possible changes in macroeconomic factors (Steiger, 2008). In a “Bear case”, predictions are made in the case a negative performance is expected for the company. In the opposite direction goes the “Bull Scenario”, with basis for “base to base scenario” resulting for management estimations.
When considering the DCF valuation approach, 2 different paths may be considered for the analysis. First we may look to the Enterprise valuation models, considering the operation cash flows generated by the company. And on the other hand, the equity holder’s rights on the same cash flows.( Koller, Goedhart, Wessels, 2005).
The usage of Enterprise valuation models has been widely defended by authors. According to koller, Goedhart and Wessels (2005), this occurs because of the relevance that the majority of authors give to the operational cash flows for valuation purposes.
Since it is more popular between authors we are going in first hand to develop this question, developing after the equity approach based on the equity holder’s claims.
2.2.1.1 FCFF
According to Damodarn (2002) the FCFF approach is based in prediction and sum of future cash flows that are rightly entitetled to all of the company’s claim holders, including bondholders, stockholders and preferred stockholders.
Four main issues must be considered in the FCFF valuation approach: 1. Estimation of future cash Flows
8 2. Estimation of the accurate discount rate
3. Both the costs of Equity and Debt
4. How does the valuation incorporate the impact of taxes
Value of the Firm =
n t 1 t t t WACC 1 FCFF (5) Where,
FCFFt= Free Cash Flow Firm in period t WACC = Weighted average cost of capital
Each of these subjects has been highly discussed in literature, leading to supported differences in each of them. However, here we are going to follow the theory that mainly supports the reasoning behind the valuation made.
Damodaran (2002) has defined two different ways of estimating the free cash flow to the firm. First, we may add to the cash flows to equity the part relative to the claim holders, on the other hand and most used, we may compute the EBIT net out taxes and reinvestment needs, and giving us an estimate of the FCFF.
1
t
Depreciati
on
Capital
EBIT
FCFF
ExpendituresNWC (6)The widely usage of the DCF model, namely the FCFF, turned the method popular, among Financial Analysts and investors. Besides the mechanization of the process, usually, when an investor acquires a company, it takes over the total amount of liabilities, whether they are debt or equity. (Steiger, 2008).
However the estimation of future cash flows has raised several theories, with some authors considering another concept
9
increase
Capex
A
&
D
NOPLAT
FCFF
in NWC (7)Taking into account these two different approaches of calculating the FCFF, we are going to consider the analysis demonstrated by Damodaran (2002) for forward analysis. The reason behind this choice is related with the fact, that the FCFF uses information that can be gathered through the financial statements.
After estimating properly the free cash flows, we need to consider the discount rate used. Several authors defend that the most important step of the valuation process, starts with the estimation of the cost of capital, the key input of the process. The Weighted average cost of capital (WACC), represents the sum of the weighted costs of the equity capital (ke) and debt (Kd), each properly weighted in the capital structure(Bierman, 2010). Considering this we obtain:
WACC d
Ke E D E t 1 K E D D (8) Where, E D D = Debt-to-value ratio Kd=Cost of Debt t = taxes E D E = Equity-to-value ratio Ke = Cost of EquityBefore proceeding with the analysis, we need to mention that the WACC must be analyzed, not as a return rate but as a discount one. Its construction aims to lead, in valuation terms, from the cash flow of the firm as unlevered to the levered value of the firm (Oded and Michel, 2007).
To estimate the weighted average cost of capital, we need to consider three different components: the cost of equity, the after-tax cost of debt and the company’s target capital structure. Considering this, different models, assumptions and approximations may be considered in order to estimate each component since none of them can be directly observable.
10 2.2.1.2 FCFE
The DCF model composed by the free cash flow to equity (FCFE) will lead the valuation process directly to the equity value, and not to the enterprise value obtained through the usage of the free cash flow to the firm.
If we consider a direct comparison with the DDM model, which states that only the cash flows received by the shareholders are taken into account, we may adulterate the valuation in the case of firms that do not pay dividends to investors (Damodaran, 2012). This way, it is possible to bridge the main limitation of the DDM model, which means valuing firms with no zero payout ratios (Madura, 2010) Equity value =
n t 1 t e t tk
1
FCFE
(13) Where, (Damodaran,2012) FCFE = Free Cash Flow to Equity Ke = Cost of Equityt= t periods
The main question under this approach is then the estimation of the free cash flow and the discount rate. Damodaran (2012), defines the FCFE as following:
FCFE=FCFF
Interest
1
t
debt
repayment
debt issue
preferred dividends (14) As can be observed in the formula, in order to estimate the FCFE, we start from the net income, subtracting capital expenditures as a cash outflow and adding back depreciations because they do not represent a cash expense. Variations in net working capital are considered as they increase the cash flow available for equity holders, as well as the effect of debt changes in the cash flows.However, the estimation of the FCFE may become easier than it seems, if we consider some assumptions regarding the debt ratio, capital expenditures or working capital needs.
2.2.1.3 Capital Cash Flow
Now let’s consider a second approach linked with the Enterprise Value, the cost of capital which is in part similar to the FCFF. According to the main developer of this methodology (Ruback, 2000), the
11 Capital Cash Flow prizes the simplicity, of using the same assumptions as the FCFF but valuing in a different way. According to the author, the present value of the tax shields is included in the cash flows, using the cost of capital before taxes as the discount rate
The main difference respects in way the present tax shields are treated. Ruback(2000), supports the alternative as the best suited when valuing risky cash flows. As the tax shields are seen as a cash flow which does not decrease the value of them. For the author, CCF is more properly used when the present value of tax shields has a major impact in the valuation results, namely capital restructuring or high leveraged operations.
Value of the firm =
n t 1 t bf n 1g
WACC
FCFF
(16) Where,FCFF1 = Free Cash Flow to the Firm in the next period WACCbf = Weighted average cost of capital before taxes gn =Growth rate
Ruback (2000), states that the riskiness of the CCF’s is the WACC before taxes, where both the cost of equity and debt are determined through the CAPM.
Pre-tax WACC= d Ke V E K V D (17)
Even though, it has been explored throughout literature, some authors have prefered to base their opinion on the limitations of the CCF’s method. Koller, Goedhart and Wessels ( 2005) believe that FCFF and CCF lead to the same results, however the first one is more accurate than the CCF.
2.2.1.4 APV
The APV method has been discussed throughout literature by several authors. The valuation process has followed the discipline of Modigliani and Miller, who defended that only market imperfection such as taxes or distress costs would affect the value of a firm. Damodaran (2012) claims that in the APV approach we consider three different parts. The unlevered value of the firm, discounting the
12 cash flows at the unlevered cost of equity, the costs (bankruptcy costs) and benefits (Interest tax shields), which appear when debt is added to firm’s capital structure. We this we obtain1:
APV = Enterprise Value all equity financed
PV tax shieldsExpectedBankruptcy costs (18)If we analyze the different parts that compose the APV approach separately, we should start by estimating the value of the unlevered firm. Through that we obtain the following:
Value of the Unlevered firm
g
FCFF
U 1
(19) Where,FCFF1= After-tax Free Cash Flow to the firm in period 1 ρu = Unlevered cost of equity
g = growth rate
When estimating the value of the unlevered firm we must not forget that the company may be under the assumption of constant growth, and as in the other free cash flow approaches a perpetuity may be considered.
We now reach on of the main differences of the APV approach when compared with the WACC model. As we have seen before, the APV method sums the value of tax shields to the present value of equity in order to reach the current value of the firm. Like the CCF method, tax shields are then better treated when compared with the WACC. The support comes from the believe that debt ratios fluctuate over time, and in this cases the value of the tax shields and their impact on the valuation will be mis-valued by the WACC approach. (Koller et all, 2005)
However the estimation of the present value of tax shields has been one of the most debated questions throughout literature. Linked with the subject of capital structure and particularly the question of the usage of constant or rebalanced debt ratios, has been discussed by authors such as Ruback, Damodaran, Koller or Harris and Pringle.
Koller, Wessels, Goedhart (2005), have a particular and interest point of view regarding how tax shields need to be treated, depending on the debt ratio policy implemented throughout the years. If the company defines a certain target ratio level, debt level will tend to follow the company’s growth.
1 Source: Investment Valuation, Tools and Techniques for Determining the value of Any Asset; Damodaran
13 In this case, what happens is that the tax shields will follow the value assumed for the operating assets. ktxa = ku (20) ke =ku
k
uk
d
E
D
(21) Where,ktxa = ku = the risk of the tax shield matches the operating asset’s risk
On the other hand, if the debt ratio fluctuates over time, the value assumed for the tax shields will be easily linked with the forecast value for the debt.
ktxa = kd (22) ke =ku txa
ku kd
E V D (23)The unlevered cost of equity is then, in the first approach linked with target debt to value ratio, as well as the cost of equity and debt verified. While in the second approach both the cost of equity and debt verified, as well as the inconstant debt to value ratio and the consequent value of the tax shields, determine this same cost (Koller,2005).
This secondary approach proposed by Koller et all (2005), seems more reasonable, has companies usually tend to change their capital structure during their life. Whether for investment needs or restructuring measures, it turns more easily to accept non-fixed debt policies, since their more realistic. (Ruback,2000)
The APV method in its theory, takes also into to account the present value of Bankruptcy costs. Where the present value of the costs of financial distress are given through:
14 Perhaps the main challenge and possible disadvantage in using APV comes at this point. As it is difficult to predict cost associated with the financial distress and the probability of happening. (Fabozzi, Drake, Polimeni, 2008). With this in mind many authors use the APV considering only the value of the all equity form and the present value of tax shields, meaning that the value of the firm may become overstated by not accounting the bankruptcy probability.
2.2.2 Important issues to consider in the DCF methodology
2.2.2.1 Cost of equity
We start now, analyzing the cost of equity as a composing part of the WACC. Determined as a cost for a company, it represents the return that investors require to compensate the risk of investing their capital.
)
R
-R
(
-R
Ke
f
L
m f (9)The capital Asset Pricing Model (CAPM) has gained popularity among authors, as the most common approach to determine the cost of equity. The method consists in the sum of the risk free rate, with the product between the systemic risk of the company and the market premium. (Subramanyam, 2008)
Although the is widely recognized, CAPM’S has rised some empirical doubts about it (Pratt, Grabowski,2010). Other approaches have criticized the components used by the model, namely the company’s beta. The three factor model developed by Eugene Fama and Kenneth French as well as the APM (Arbitrage Pricing Model) provides an alternative theory. Where not only one market risk is considered but several are taken into account, using different Betas and market premiums (Pratt, Grabowski, 2010).
However, CAPM is simpler and easier to understand and apply. The main assumption behind the model is that, investors may hold well diversified common stock portfolios in order to spread out the risk ( Pratt, Grabowski, 2010).
2.2.2.2 Cost of debt (Beta)
When composing the CAPM, besides the estimation and application of the risk free rate and the equity risk premium already mentioned, there is also the need to estimate the Beta.
15 Although there are several ways of doing it, the most common consists in comparing the share’s returns (Ri) and the market return (Rm) in regression model, during a certain time period. The regression is highly sensitive to the extension of the period in analysis, usually being used by analysts, periods from 2 to 9 years. (Clayman, Fridson, Troughton, 2012)
Ri
a
bR
m (10) Where,Ri =Share’s returns a = estimated intercept b = Slope of the regression Rm = Market return
The slope of the regression is equal to the beta of the company, so:
=
m m iR
Variance
R
,
R
iance
var
Co
(11)Other approaches, have been developed by other authors, as the “Bottom Up” approach, which is based on the usage of the unleveraged Beta for the Industry or business type, adding up the leverage of the company, according to the debt ratio or target capital structure (Meyer, Mathonet, 2005). According to Damodaran (2002), the main advantage of this approach consists in the fact that averaging the unleveraged beta of the business may reduce the risk of the approach.
2.2.2.3 Risk free rate
The estimation the risk free rate is linked with the Treasury bond, usually with a 10 year maturity. Some authors define it, based on U.S Treasury securities, namely short-term securities, where the inflation has a low or even absent impact. (Brigham, Ehrhardt, 2010). In Europe, the tendency was to use the German Bund, the 10 Treasury bond for Germany, however recent foreign crisis in Europe has raised the question about the riskless factor of the bunds.
Choosing the accurate figure, has shown to be mainly a theoretical problem. Analysts nowadays tend to realize a portfolio of foreign currency bonds, computing the average between them, or simply selecting a rate adjusted for the risk level. (Greer, Kolbe, 2003)
16 2.2.2.4 Risk premium Rate
The equity risk premium represents the incremental amount that investors demand for a certain investment when compared with the risk-free rate, which represents the time value of the money. (Pinto, Henry, Robinson, Stowe, 2010)
Required return on equity =
R
freturnEquityRisk premium (12)The risk premium differs from market to market, it differs throughout time, and it affects differently several economy sectors. The complexity behind the concept, does not allow a consensus among authors. If we consider Standard & Poors (S&P) 500 Index, in a eighty year period, from 1926 to 2006, the equity return exceeded the U.S Treasury Bill by 6,6% (Goetzmann, Ibbotson, 2006). However, data also shows that the returns are now decreasing, since for the 1926-1974 period, the same comparison amounted for 8,1%, leading to possible expect a downgrade for the future.
2.2.2.5 Terminal value
The terminal value is an extremely important concept in valuation terms, since the its weight will have a big impact in a company’s value. The estimation of an appropriate growth is essential to provide validity to the process. Authors have developed several theories in order to reach a proper value. (see appendix 1)
2.3 Relative Valuation (Multiples)
The use of DCF method has become highly used has the principal valuation method. However the complexity of its usage has induced different authors to developed different approaches around the general method, showing evidence of weaknesses of the model.
With this in mind it is appropriate to consider other processes of valuation, namely the Multiples approach. Which has become popular among analysts and investors in order to particularly understand, whether a certain stock is under or over-valued when compared with the industry or simply the peer group chosen for the analysis (Vishwanath, Krishnamurti, 2009).
Authors have debated in terms of peer group, equity vs entity multiples and the influences of economical variables, since the valuation is then obtain through comparable companies in the market, the method is known as relative valuation
17 2.3.1 Importance of defining a good peer group
We need to consider from now on, in the multiples valuation the importance of choosing the accurate peer group, the comparable firms in the industry or market. Even inside the same industry it may be difficult to find similar firms, because financial structures, future investment opportunities or growth perspectives may differ across a given industry making it difficult to create a comparable peer group. Analysts, believe that different characteristics, non comparable between companies, annul each other out, making the use of multiples effectual. (Palepu, Healy, 2008)
However it is more reasonable to understand that the criteria of comparison may differ from multiple to multiple. In a practical example, if we consider the P/E multiple, debt ratio among companies must be similar, in order to avoid high differences in the number of shares and by consequence in the earnings of per share, adulterating the result of the valuation. (Vishwanath, Krishnamurti, 2009)
2.3.2 Enterprise vs equity multiples
As it happened with the DCF model, there is the possibility of using the Multiples approach in two different ways. One linked with the enterprise value, related with all the claims using data such as sales or EBIT and another other equivalent to the claims of equity shareholders, thus using sources as earnings.
Both methods show limitations and advantages regarding each other. If we consider the teachings of Modigliani & Miller (1963), the existence of taxes may encourage managers to use debt, in order to create value for shareholders. The tax benefits of leverage as well as the costs of financial distress have an influence on the firm’s value, affecting less entity value multiples, encouraging the use them for valuation purposes.(Schreiner, 2007)
2.3.3 Using the right multiple
Although it has been mentioned before that enterprise multiples may be more accurate, it is one equity approach that is the most used in valuation. The price earnings ratio (PER), gains advantage through the attractiveness it offers by its simplicity. It is mainly used to price public offerings, and to triangulate a company’s value, giving the investor the information whether a stock is over or undervalued (Pinto, Henry, Robinson, Stowe, 2010). However analysts tend to ignore the financial
18 fundamentals of the approach, mis-valuing the company and the method (damodaran 2012). The reasoning behind PER, is to give the investor the information whether a stock may be over or under valued. 0 0
EPS
P
PER
(28) Where,P0 = Market price of a share in t=0 EPS0 = Earnings Per Share in t=0
In an extreme situation PER may mis-value totally the value of a company, in the beginning of the century, the technological bubble lead several companies of the sector to negative earnings. However PER was still considered as a valuation choice, tampering the results obtained (Stahl, 2004). The PER’s restrictions have aroused throughout the authors and analysts the usage of the EV/EBITDA approach. Besides the fact that it constitutes an enterprise valuation method, Damodaran (2012), points three advantages of using it over the price earnings ratio.
(1) Although it is more common to find companies with negative earnings in the market, it is far more difficult to find the same situation in EBITDA terms. (2) The different settings of depreciation rates assumed by different companies will not have effect, since the EBITDA measure preecedes the accounting of the same. (3) At last, the financial structure of the companies analyzed may not have a vast effect on the valuation, since debt costs like amortization are taken into account after the estimation of the EBITDA.
As a final remark even though PER prizes simplicity, when compared with EV/EBITDA the tendency is now changing for the application of the last one among authors, and particularly between analysts and investors.
2.4 Options valuation
Although it is not going to be developed further on in the dissertation, the “Options Valuation” model is here mentioned due to the relevance it has for some specific cases.
The method claims for valuing flexibility and it has gained notoriety mainly in the commodities industry, as well as companies in financial distress or sellers of single products. (Koller et all, 2005)
19 The Black and Scholes model (1972) has been highly used since its creation particularly for decision making processes in the commodities and natural resources businesses or R&D investments (Luehrman, 1997).
2.5 Other Valuation approaches
Even though they are not used for the dissertation purposes it is necessary to refer the excess return valuation approaches, particularly EVA and Dynamic ROE, both measuring the excess returns that a given expects to obtain from a certain project or assets. (see appendix 2)
2.6 Other Valuation Issues
Macroeconomic factors have a high impact in valuation terms and now more than ever, with the Globalization process reaching its peak, valuing emerging markets and companies with a performance highly influenced by economic factors is more important than ever. (see appendix 3)
3. Mota-Engil SGPS
3.1.1 Company Presentation
Mota-Engil SGPS is today, the largest Portuguese company in the sector of civil and public construction, being a result of the merger between Mota and Engil, back in 2000. However before the merger, both companies acquired experience for several years, at national and international level. Mota & Companhia, was created in 1946 by Manuel António da Mota, and in the same year the company opened a branch in Angola, and by 1952 it was awarded with the first big international project, the Luanda’s International airport. It was also in 1952 that the Engil, Sociedade de Engenharia, Lda was founded, by António Lopes de Almeida and Fernando José Saraiva.
Internationalization is since the beginning a major concern and philosophy for Mota-Engil, the small dimension of the domestic market and more recently the macroeconomic environment lived in Portugal, forced the company to seek for foreign opportunities. Nowadays, the company develops activities throughout 19 countries, spread between Europe, Africa and America, making the process of internationalization the essence of growth of the group.
20 Besides internationalization, Mota-Engil has also diversified its activities to other business areas, in order to seek for new profitable opportunities. The company is now structured in three different areas: Enginnering & Construction, Environment & Services and Investments.
Error!
Although it is not the only business area of the group, has Services & Environment are gaining more importance nowadays, Engineering & Construction represent the core area of the group. Has it is the engine for the leading position in Portugal as well for the internationalization process.
Economically the company has been growing in recent years, mainly due to the strong operational presence in Africa and more recently in Latin America. (see appendix 4 for details on the financial figures of Mota-Engil)
3.1.2 Shareholders Structure
Eventhough the company is listed at the stock market, the shareholder structure of company, has been stable throughout time. Approximately 2/3 of the company are owned by the Mota family, meaning that the free float present in the market assumes very low levels as well as the volume of transactions on the stock exchange.
Mota-Engil SGPS
Engineering & Construction
Environment & Service
Investments
Buiding Infra-structure
Real Estate
waste water Port & Logistics
Multi-services
Ascendi & Martifer
Figure 3: Mota-Engil Structure 1
21 Source: Bloomberg
Such structure may grant the company some stability in terms of management, since the majority of capital is control of the company’s managers. However, regular investors may have difficult to enter the shareholders structure of the company, has the Mota family position in the company, may give them the incentive to prefer debt over equity funding, in order to maintain the control of the company and avoid the overlap of their interests.
3.1.3 Martifer
Martifer Group is a multinational company based in Portugal, acting mainly in the metallic construction and solar energy sectors. The company is listed in the stock exchange since 2007 and by the following year Mota-Engil acquired a strategic position in Martifer Group, holding nowadays 37,5% of the equity claims of the group. Martifer, holds positions in 19 countries including Polond, Slovakia and Angola where Mota-Engil also holds strategic operations.
The company has shown high growth rates during the mid 2000’s, mainly in the solar energy sector due to high investments made in renewable energies on the past decade. However, recently Martifer’s activity has been highly compromised by the same macro-economic factors that have conditioned Mota-Engil’s activity, particularly in Portugal. The intensification of the sovereign debt crisis and the more restrict budgetary policies have delayed or even frozen some projects. This policies allied with the disinvestment on renewable energies had a severe damage on Martifer’s operations, and the results have been reflected on the company’s figures. (see details on Appendix 5)
Mota-Family 64,75% Free Float 19,13% Kendall 2,44% NMAS 2,07% QMC 2,05% Morgan Stanley 1,94%
22 3.1.4 Ascendi Group
Ascendi Group SGPS, results from a partnership made between “Mota-Engil Concessões de transportes, SGPS, SA” and “Espírito Santo concessões, SGPS, SA”. Mota-Engil, holds 60% of this partnership created by the end of 2006 in order to obtain synergies from exploring road concessions on highways build by the company.
By 2012, the group is expected totalize 3000km of highways under concession, with more than a 1500km in Portugal, through 11 concessions and the rest spread between, Spain, Mexico, Brazil and Mozambique, with a total investment of €10 85amillion. (see appendix 6 for detailed concessions)
Table 1: Ascendi Concessions
Concessionarie Km Investment €mn Portugal 1608 8491 Spain 156 810 Latin America 475 859 Africa 701 151 Railways concessions 20 338 Total 3046 10854 Source: Mota-Engil SGPS
However the concessions managed by the Ascendi Group are now being reviewed by the Portuguese government, mainly due to the austerity measures applied in the country which led to the revaluation of the public-private partnerships (PPP). This means that the concessions contracts may change in the near future, with the payments made to Ascendi being reduced.
3.1.5 Mota-Engil in the Stock Exchange
The financial crisis in euro area witnessed during 2011 as an extension of what happened in 2010, had a severe impact on the financial markets, requiring financial aid conceded by IMF and the European Union to Portugal, Greece and Ireland. The Contagion to Spain and Italy, two of the largest
23 European economies seems now more real than before and the efforts by the European Central bank to control the increase in the interest rates of government bonds, has been highly compromised. The 1.5% average GDP growth for the Euro area in 20112, and the low perspective for the next two years, brought down the confidence levels of investors, leading to a massive capital flight, particularly in the peripheral countries of Europe. The suspension of large construction projects in Portugal and Europe, lead to reluctant expectancy regarding the performance of the construction and public works sector.
Mota-Engil SGPS is a Portuguese listed Company at the Euronext Lisbon Stock Exchange. In terms of index weight as well as market capitalization, the company is only in 19th position, only ahead of “Sonae Indústria SGPS SA”, with index weight of 0,5% and a market cap of €250 million.3
During 2011, Mota-Engil shares loss 41% of its value, which allied with the 56% drop in 2010 has made, represents a loss of € 182 million.
Figure 5: Shares performance (2007-2012)
Source: Bloomberg 2 Source: Eurostat 3 Source: Bloomberg
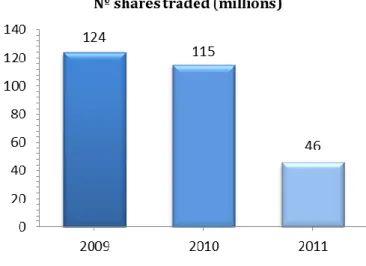
24 During 2011, 46 million shares were traded, 60% less than 2010, a decrease following the trend of the Index. PSI-20 has lost more than half of its value in past 5 years, being severed damaged by the financial crisis that plagues Europe, and particularly Portugal.
Figure 6: Nº of Shares traded on PSI-20 1
Source: Mota-Engil SGPS
When compared with some international peers, Mota-Engil, has been highly punished by the markets. The sovereign debt crisis faced by Portugal, as well as the importance of the internal market for the company’s performance, led to a suspicious and cautious predictions regarding the future of Mota-Engil.
25 Figure 7: Mota-Engil&Peers Performance “2010-2011”
Source: Bloomberg
As we may see above, even in an above average risk business, some European competitors, Ferrovia (Spain), Vinci (France) and Hochtief (Germany), have been able to minimize the European crisis and the crash of the sector. In the Past two years, Vinci and Hochtief lost approximately 15% of their value, while Ferrovial increased by 13%. Mota-Engil, punished by the Portuguese market, lost 70% of its value.
3.2 Industry overview
In order to conduct a proper valuation process of Mota-Engil, we need to conduct an overview from the different sectors the company operates, as well as the different competitors and the macroeconomic variables that influence the operating activities of the group. The hugeness of the operations in geographical terms implies an accurate study of these variables, due the great impact assumptions may generate in the valuation.
3.2.1 The construction sector, Engineering, Cement and GDP in Portugal
The sovereign debt crisis which is affecting the European peripheral countries, particularly, Greece, Portugal and Spain has resulted in the forced use of austerity policies, with direct consequences for the economical growth. GDP figures are reviewed constantly, pointing to severe recession values, damaging directly the construction sector.
26 For several years, the Portuguese economy was known as dependent of the civil and public construction sectors. It was in this sector that Mota-Engil gained a prestigious position, being awarded with several public projects that have increased the order book of the company for years. However, the general paradigm is changing, has the construction business areas are now becoming less attractive, with lower margins and worst profitable expectations.
Recent forecasts point to a more severe recession than what was expected, with Eurostat predicting a reduction of 3.3% in GDP terms for 2012. The confidence of the sector has felled down almost 3%, in the last 6 months, has figure (8) indicates us. And if we consider the year basis is 1997, the accumulate decrease of the confidence level in the last 15 years is near 70%.
Figure 8: Confidence index, construction Sector in Portugal
Source: INE, Portuguese National Statistic Institute
This break of confidence by the sector aligned with the government’s measures of public disinvestment, leads us to believe in low output construction levels for the upcoming years.
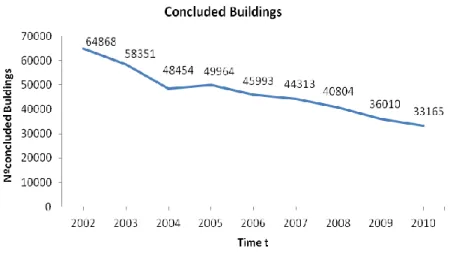
Official data, provided by the Portuguese national statistic institute, demonstrates the deceleration of the sector in Portugal. Between 2008 and 2010, the number of concluded buildings dropped an impressive 49%.
27 Figure 9: Nº Concluded buildings 1
Source: INE, Portuguese Stat. Institute
Future expectations do not bring any brightness to the sector, large projects, mainly related to the transportation sector such as highways, the new Lisbon international airport or the TGV have been postponed4. In the Domestic market, Troika has pushed the government to smooth the house renting market, opening an opportunity to renovation and rehabilitation of existing houses.
Figure 10: New construction/Reconstruction Projects weight in the sector
Source: AECOPS, “Uma Visão revisitada do futuro”, 31-01-2011
4 Source: 70th Euroconstruct Conference, 70th Euroconstruct summary book. Market Trends until 2013, 2/3
28 In addition to this5, from the total of €13.150 million of the non-performed loans from the Portuguese banks, €3.079 million come from the construction sector that defends that the situation was caused by the government’s debt of € 1.419 million to the companies of the segment, who were forced to appeal for bank’s credit, in order to face short-term liabilities. Construction companies are now on their debt limit, strangled in operational terms which will directly affect the country’s unemployment rate, seriously compromising the future of the sector.
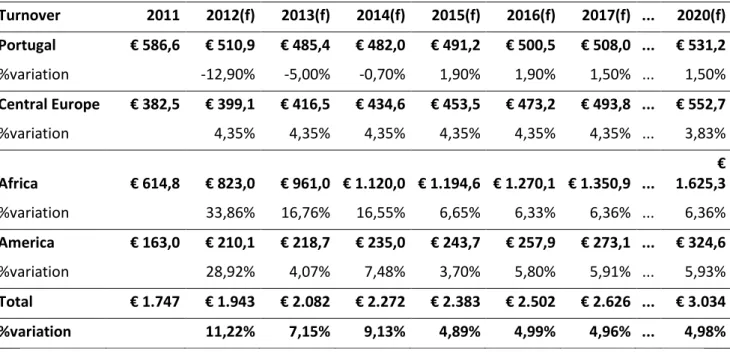
Although internationalization is part of Mota-Engil’s philosophy, the negative expectation of the Portuguese market emphasized the importance of the foreign markets for the company’s financial health, creating a forcing movement on external operations, with no positive prediction for the Portuguese operation.
Table 2: GDP forecast/Investment as % of GDP “2010-2017”
Portugal 2010 2011 2012(f) 2013(f) 2014(f) 2015(f) 2016(f) 2017(f)
GDP evolution 1,4% -1,5% -3,3% 0,3% 2,1% 1,9% 1,9% 1,5%
Total investment as % GDP 19,6% 17,7% 16,0% 16,5% 17,1% 17,6% 17,9% 17,8%
Source: IMF, INE, Portuguese National Statistic Institute
The Portuguese market is considered has been defined as a slow recovery market. The low output of the construction aligned with the low levels of GDP growth for the next years, led European institution to consider Portugal as a low speed market.
5 News: Jornal de Negócios: AECOPS: “Crédito malparado baixaria para metade se o Estado pagasse as dívidas.”
29 Figure 11: European Countries, low speed Construction Sector recovery
Source: Euroconstruct, 70th Euroconstruct conference
3.2.2 Central Europe
In Central Europe, Mota-Engil exercises activities in 5 different countries: Poland, Czech Republic, Slovakia, Hungary and Romania. However, recently the Romanian, Hungarian and Slovakian operations have been cancelled, due to non-profitable operations. Leaving a real-estate position, and the large Poland operation as the two market approaches in the region.
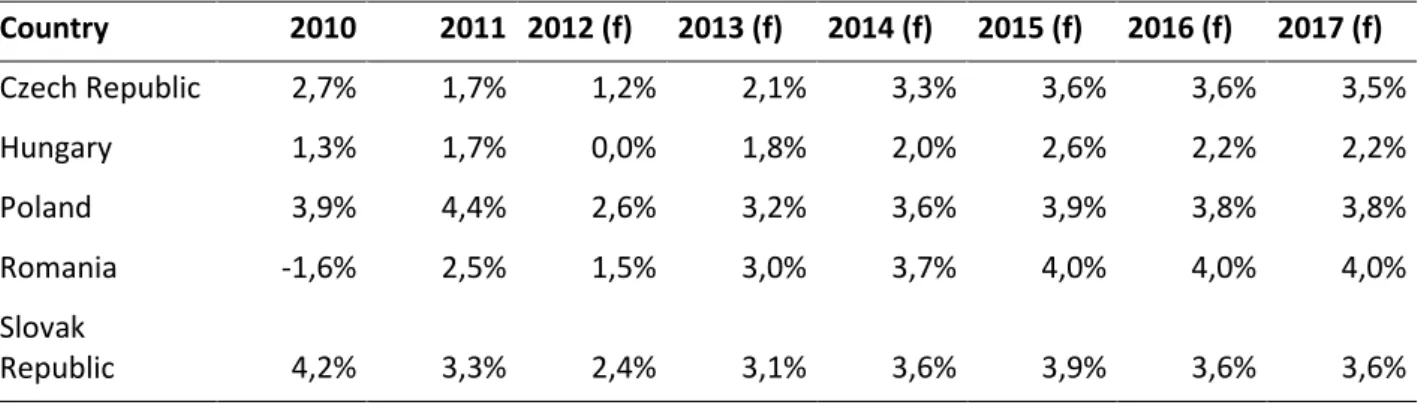
Central European countries have grown exponentially during the last decade, in some particular years the GDP nearly reached two digit values. The forecast for the next couple of years shows a different perspective of the eastern European countries, particularly the Eurozone.
30 Table 3: Central Europe GDP forecast 1
Country 2010 2011 2012 (f) 2013 (f) 2014 (f) 2015 (f) 2016 (f) 2017 (f) Czech Republic 2,7% 1,7% 1,2% 2,1% 3,3% 3,6% 3,6% 3,5% Hungary 1,3% 1,7% 0,0% 1,8% 2,0% 2,6% 2,2% 2,2% Poland 3,9% 4,4% 2,6% 3,2% 3,6% 3,9% 3,8% 3,8% Romania -1,6% 2,5% 1,5% 3,0% 3,7% 4,0% 4,0% 4,0% Slovak Republic 4,2% 3,3% 2,4% 3,1% 3,6% 3,9% 3,6% 3,6% Source: IMF
Poland has been and is expected to be in future, the main focus of Mota-Engil in the Central European market. Macroeconomic figures, such has the GDP growth or public debt make the country a pole of attraction for foreign investment, in comparison with the figures presented by the Eurozone Countries.
Table 4: Polish macroeconomic figures 1
Subject Descriptor 2010 2011 2012(f) 2013(f) 2014(f) 2015(f) 2016(f) 2017(f) Total investment 20,95% 21,79% 22,03% 22,10% 22,68% 23,27% 23,91% 24,58% Inflation 2,51% 4,27% 3,81% 2,67% 2,50% 2,50% 2,50% 2,50% Unemployment rate 9,62% 9,65% 9,38% 9,11% 8,84% 8,57% 8,30% 8,93% Public deficit -7,85% -5,49% -3,26% -2,61% -2,41% -1,88% -1,80% -1,63% Public debt 54,89% 55,39% 55,69% 55,17% 53,89% 52,15% 50,46% 48,68%
Source:IMF, Polish Nat.Stat.Office
Besides hosting the football Eurocup in 2012, which is increasing notoriously the construction levels, the country is expected to receive €67.28 million between 2007 and 2013, for investments in
infra-31 structures, particularly highways, which are intended to connect the north and European south known has the Baltic-Adriatic Corridor and the East and West, through Amsterdam, Berlin and Warsaw. As well as railways, mainly the repairment and renewal of important international sections such as the Warsaw-Tallin line or the Warsaw-Poznan-Berlin 6.
Figure 12: Poland Construction output YoY
Source: Euroconstruct, 70th Euroconstruct conference, 03-12-2010
Even though Poland’s contruction output is something a part of the Eurozone reality, the possible contagion of the Eurozone crisis, allied with the fierce competition and the low EBITDA margins caused by it, turn the approach on the polish market difficult and cautious by Mota-Engil.
3.2.3 Africa
Even before the creation of Mota-Engil SGPS, both Mota & Companhia and Engil, SA, comprehended the importance of developing operations in the African Continent, particularly in the Portuguese speaking countries. Nowadays, Mota-Engil operates in 5 different countries: Angola, Mozambique, Malawi, São Tomé e Príncipe and Cape Verde.
6
32 The intention of Mota-Engil is to turn Africa in the biggest operation of the company. The machinery and employees based in the country are now overtaking the Portugal in the same terms and the future tendency is two increase the gap between both operations.
Angola, is the most profitable operation in Africa, and is expected to become soon the most profitable region for the company. Commodities price, particularly the oil and the consequent demand for it, drives the GDP of the country, as well as the construction sector highly financed by the government.
Figure 13: Oil price evolution (2007-2011)
Source: Bloomberg
From 2002 to 2011, the average GDP growth in Angola was 11%, and even though it reached approximate values of 20% between 2005 and 2007, afterwards the rates declined as a result of the decreasing demand for oil and the consequent decrease of prices. Nowadays, the sustainable increase of the oil price, increased the expectancy regarding the GDP, however IMF is prudent when forecasting future years, particularly due to the crash in the demand for:
33 Table 5: Angola GDP forecast
Angola 2012(f) 2013(f) 2014(f) 2015(f) 2016(f) 2017(f)
GDP Growth 9,66% 6,75% 6,67% 6,63% 6,06% 6,16%
Investment as % of GPD 10,42% 12,61% 13,26% 13,78% 14,28% 14,77%
Source: IMF, National Statistic Office
Even though it looks promising for the future, the delayed payments made by the Angola’s Government crush the margins obtain by Mota Engil, leading the company to save their presence in continent by investing in other countries.
Mozambique is now facing high GDP growth rates as well. Recent findings of natural gas fields are attracting international oil companies to the country. Although it requires high levels of initial investment, it is expected to provide highly returns in the following years7. Mota Engil has gained a dominant position in the region, and is now a inevitable reference.
The construction of the Pan-African Games Village in 2011 and Sport infra-structures, highly improved the company’s turnover and EBITDA margins in the country, as well as the awarded 145km of railway in Malawi.
Figure 14: MZN/USD GDP comparison
Source: IMF
7
34 Even though GDP in Mozambique is reaching values near the two digits, the devaluation of the local currency is one of the main supporters of this economic growth. When compared with the USD, the Mozambican economy shows high levels of volatility, particularly due to the close relation with the unstable Malawi economy.
3.2.4 America
Mota-Engil’s presence in the American continent, is mainly dependent on the Mexico and Peru operations, although is expected an exponential growth for Colombian, Brazil and US activities for the next years.
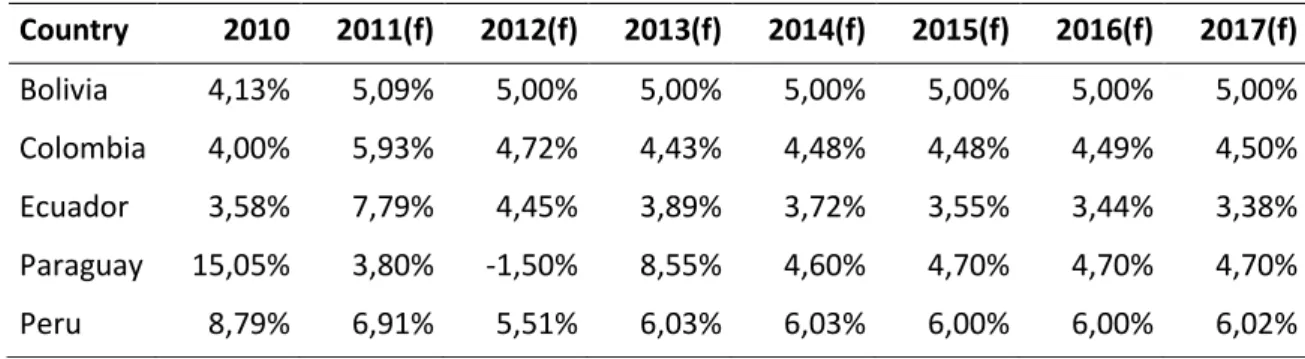
Peru assumes the biggest role for Mota-Engil in the Continent. In 2011, the order book amounted for €344 million, an increase of 74% when compared with the previous year. Allied with this figures is the IMF projections of an average growth rate of 6%, between 2012 and 2017.
Table 6: Latin America GDP forecast 1
Country 2010 2011(f) 2012(f) 2013(f) 2014(f) 2015(f) 2016(f) 2017(f) Bolivia 4,13% 5,09% 5,00% 5,00% 5,00% 5,00% 5,00% 5,00% Colombia 4,00% 5,93% 4,72% 4,43% 4,48% 4,48% 4,49% 4,50% Ecuador 3,58% 7,79% 4,45% 3,89% 3,72% 3,55% 3,44% 3,38% Paraguay 15,05% 3,80% -1,50% 8,55% 4,60% 4,70% 4,70% 4,70% Peru 8,79% 6,91% 5,51% 6,03% 6,03% 6,00% 6,00% 6,02% Source : IMF
The country presents in average, the highest GDP growth rate of Latin America, partly due to the monetary devaluation policies created by the Government. The investment continues to be an important part of the economic development, with a forecast for the 2012-2017 period of a total weight of 25% of the GDP8.
8
35 In Mexico, Mota-Engil is working in partnership with Isolux Corsán Groups, in the construction of the €75 million project of the “Perote Y Xalapa” motorway. The program of infrastructure development launched by Felipe Calderón administration between 2006 and 2012, indentifies more than 300 construction projects in different areas such as: Oil and Gas, Energy, Airports, Ports and Harbors, constituting a window of opportunity for Mota-Engil activities in the country.
The company is now seeking a strong entrance in the Brazilian market, although the strong competition constitutes a major threat for the success of the operation, the attractiveness of the infrastructure market in country counter balances the risk. (see more details on the Brazilian market in Appendix 7)
3.3 Competition Overview
It is difficult to find a company operating in the Engineering, environment and concessions sector in the market, which would be a perfect match as a Mota-Engil competitor. However, considering the core Business of the company, Soares da Costa SGPS and Teixeira Duarte S.A are the main competitors of Mota-Engil in Portugal. The three companies were considered in 2010, part of the 50 biggest construction companies in Europe, with a combined turnover exceeding €4.3 million9.
Table 7: Portuguese main players info
Comparables Mota Engil Soares da costa Teixeira Duarte Revenues (€ million) € 2.176.072 € 873.500 € 1.200.270
EBITDA (€million) € 295.957 € 94.1 € 117.314
EBITDA margin % 13,60% 10,80% 9,80%
Net income (€ million) € 33.4 € 2.4 - € 200.487
PER 7.1 8.4 …
ROE 8,1% 2,1% -78,3%
Source: Companies Reports & Bloomberg
9
36 However, other Portuguese companies such as Somague, Lena or Edifer are gaining domestic market status. According to a study elaborated by Deloitte and ANEOP, the 50 biggest companies of the sector in Portugal compose 23% of the total turnover of the sector, highlighting the relevance of small companies.
Internationally, Portuguese companies are in general blocked by large international groups, when entering new markets or developing new projects, turning countries of Portuguese speaking language more desirable. Mota-Engil, although it looks for high growth potential markets, is now looking for more profitable projects both in Angola or Brazil. However some of these countries are now attracting some of the biggest players in the sector, speeding up investments in order to establish solid market positions in these markets.
3.4 Cyclical Industry
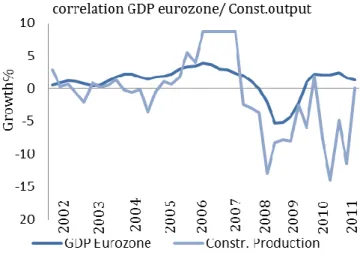
The construction activity is known for the correlation between the output of the sector and GDP growth rate. Although it may not be linear as it is supposed to be, the weight of the investment made by the sector as well as the employment generated by it, contribute largely for a country’s GDP rate.
Figure 15: Correlation GDP Eurozone/ Construction Output
Source: Eurostat
The data here used regards the Eurozone area, the link between the countries GDP and the construction output is not as linear as we may observe. However in a 10year basis, we may observe that during periods of constant or low GDP growth rates, the construction has a neutral
37 performance, with some positive or negative observable cases. On extremes and particularly, after the 2008 crisis, the sector plummeted. The sovereign debt crisis now lived in Europe and the delicate situation of the financial sector, have conditioned the lending terms offered by banks. Construction outputs are now in very low levels and even with a slightly recovery of the European economies, there are no good future prospects.
If we compare this situation with the Brazilian economy, the relation between both factors is much more direct when compared with the situation in the Eurozone. As it is shown in figure (30), the output figures of the construction sector tend to follow directly the trends of the country’s GDP. We may assume through this that the relationship between both factors may depend on the weight that total investments have on the GDP rate and how relevant is the infrastructure investment for the overall amount.10
As it was mentioned in the Brazilian market analysis, over the past decade infrastructure investment totalized 2% of the GDP, while the overall investment reached 17%. During the 1970’s, when the investment of the construction sector totalized 5% of the GDP, the total amount invested in the country reached 22%, illustrating the dependence of the national economy on the sector.
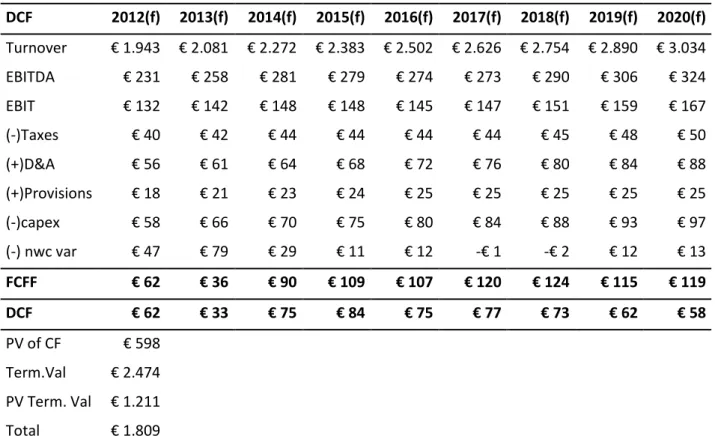
4 Valuation of Mota Engil SGPS
As it has been highlighted before, Mota-Engil operates in three major different areas, each of them with different financial characteristics, easier to analyze and develop in valuation terms if computed separately.
This way, through the usage of the DCF (WACC) for the E&C and E&S business areas, and the DCF (FCFE) for Ascendi, it was possible to catch and attribute the appropriate information to the valuation, while the company’s position in Martifer (37,5%) was considered through the market value of the shares.
4.1.1.1 Engineering & Construction
The nature of the business in the construction area is now changing more than ever. Mota-Engil, is now seeing the contraction of the Portuguese market which was once the main profitable operations
10
Source: Morgan Stanley, Morgan Stanley Blue Paper, “Brazil Infrastructure paving the way”, 05-05-2010