A Work Project, presented as part of the requirements for the Award of a Master’s degree in Finance
from the Nova School of Business and Economics.
NETFLIX IN EASTERN AND ASIAN REGIONS
NEZA KRIVONOG 34063
SVETLANA ANDROSHCHUK 32504
Work project carried out under the supervision of:
Francisco Martins
NETFLIX COMPANY REPORT
ABSTRACT
EQUITY RESEARCH NETFLIX
Netflix is a media subscription services provider and production corporation headquartered in Los
Gatos, California. North America remains its largest and most highly penetrated market to date, whilst
the international markets accounted for roughly 90% of the company’s overall growth since the
beginning of 2017. As the streaming video on demand industry is ushering in a new era of intensifying
competition in 2020, the streaming provider invests significantly into its exclusive content, licensed
and produced. The purpose of this paper is to provide a detailed analysis of Netflix and an estimation
of the company’s enterprise value as of December 2020.
Keywords: Streaming Video on Demand, Content Investment, Subscriber, Average Revenue per User
This work used infrastructure and resources funded by Fundação para a Ciência e a Tecnologia
(UID/ECO/00124/2013, UID/ECO/00124/2019 and Social Sciences DataLab, Project 22209), POR
Lisboa (LISBOA-01-0145-FEDER-007722 and Social Sciences DataLab, Project 22209) and POR
Norte (Social Sciences DataLab, Project 22209).
▪ North America remains Netflix largest and most highly penetrated market to date, whilst the international markets accounted for roughly 90% of the company’s overall growth in the Q1 2017 to Q3 2019 period. We project that by 2024 the company will reach 83,4 million domestic and 204 million international subscribers with EMEA becoming its largest subscriber base.
▪ Netflix is currently facing a growing competition from major new players in the industry, which will remove some of the licensed content from the platform. Thus, the company expanded its content expenditure to $15 billion for 2019 to produce more exclusive content. It will likely continue increasing the budget until 2024. A higher up-front investment for the production relative to licensing is an important factor behind the growing expenditures, however, we argue that it is more profitable on the long-term. ▪ The streaming rivals could potentially affect the Netflix subscribers’ growth or put a competitive pricing pressure on the company. As its perceived value for expenditure remains the highest in the industry, we believe the new competition will not have a significant impact on the streaming giant in terms of the subscribers as well as the prices.
▪ Based on a discounted cash flow valuation, the Netflix price target for the FY20 equals $359,66. As of December 31st 2019, The closing stock price for Netflix was $323,57, indicating it is trading at discount of 11,15%. Thus, the final recommendation is to BUY.
Company description
Netflix is a media subscription services provider and production corporation headquartered in Los Gatos, California. It operates on a subscription-based model in three reportable segments: domestic streaming, international streaming and domestic DVD.
NETFLIX
COMPANY REPORT
E
NTERTAINMENT AND MEDIA INDUSTRY 3JANUARY 2020NEZA KRIVONOG,SVETLANA ANDROSHCHUK [email protected], [email protected]
Netflix: Streaming Wars
Who Will Win Streaming Wars?
Recommendation: BUY
Price Target FY20: 359.66 $
Price (as of 31-Dec-19) 323.57 $
Reuters: NFLX.OQ, Bloomberg: NFLX US
52-week range ($) 230,37 - 385,75
Market Cap ($ bn) 141.787
Outstanding Shares (m) 438.250
Source: Bloomberg
Source: Bloomberg
(Values in $ millions) 2018 2019E 2020F
Revenues 15794 20023 23598 Revenue growth 35% 27% 28% Operating income 1605 1875 1854 Operating margin 10% 9% 8% Net income 1501 1873 2500 ROIC 19% 13% 10% Growth rate 56,7% 36,9% 27,3% Subscribers 141,9 168 197,6 Net debt 7153 8778 12815 Amortization 7573 9174 11214 Source: Bloomberg, 2019
NETFLIX COMPANY REPORT PAGE 2/32
Table of Contents
COMPANY OVERVIEW... 3 COMPANY DESCRIPTION ... 3 BUSINESS MODEL ... 3 COMPANY ANALYSIS ... 4REVENUES VALUE DRIVERS ... 4
CONSOLIDATED REVENUE ... 5
PROFITABILITY ... 5
CONTENT STRATEGY ... 6
ASSETS AND LIABILITIES ... 7
CAPITAL STRUCTURE ... 7
INDUSTRY OVERVIEW ... 9
MEDIA AND ENTERTAINMENT INDUSTRY ... 9
OVER-THE-TOP VIDEO... 10
STREAMING VIDEO ON DEMAND ... 10
DVD... 11
INTERNET TRENDS AND DIGITAL VIDEO ... 11
SUBSCRIPTION TV AND CORD CUTTING ... 11
COMPETITIVE LANDSCAPE ... 12
STREAMING WARS ... 12
WHO WILL WIN STREAMING WARS? ... 14
IMPACT OF STREAMING WARS ON NETFLIX ... 15
FORECASTING ... 16
CONTENT STRATEGY,ASSETS AND LIABILITIES FORECAST ... 16
COST OF REVENUES FORECAST... 17
MARKETING FORECAST ... 17
TECHNOLOGY AND G&AFORECAST... 18
DVDREVENUES FORECAST... 18
DOMESTIC STREAMING REVENUES FORECAST ... 18
INTERNATIONAL STREAMING REVENUES FORECAST ... 20
VALUATION ... 22
WEIGHTED AVERAGE COST OF CAPITAL ... 22
FREE CASH FLOWS... 22
GROWTH,REINVESTMENT RATE AND ROIC ... 22
SCENARIO ANALYSIS ... 23
SENSITIVITY ANALYSIS ... 23
RELATIVE VALUATION ... 24
STOCK PRICE AND FINAL RECOMMENDATIONS ... 24
APPENDIX ... 25
FINANCIAL STATEMENTS ... 25
REFERENCES ... 26
DISCLOSURES AND DISCLAIMERS ... 30
NETFLIX COMPANY REPORT
PAGE 3/32
Company Overview
Company Description
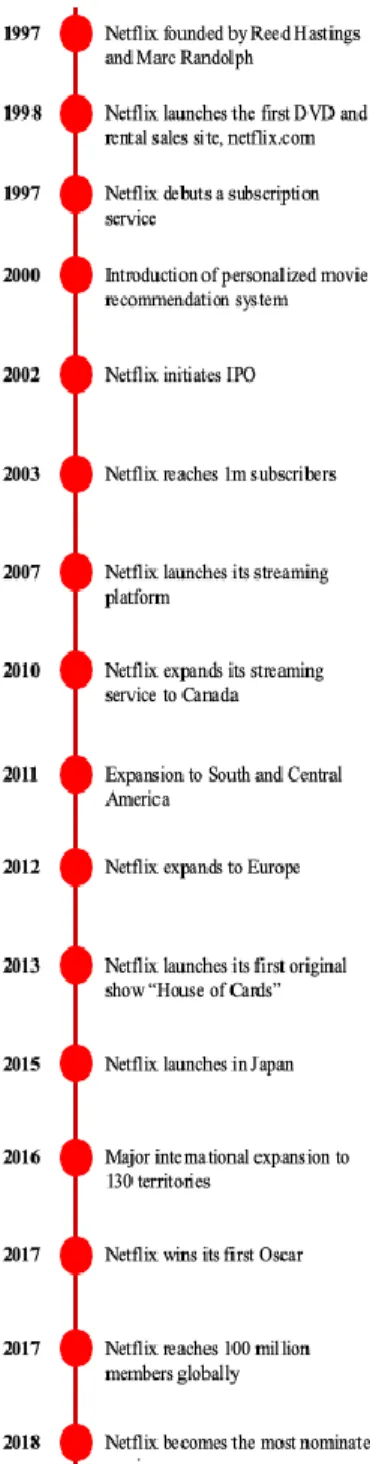
Netflix is a media subscription services provider and production corporation headquartered in Los Gatos, California. The company was incorporated in 1997 as a DVD-rental-by-mail business, but it has gone through a whirlwind of changes ever since. In 2007, Netflix launched its streaming platform in the US as a pioneer in Over-the-Top market, enabling its members to instantly watch TV shows and movies over the internet. Four years later, the company offered its streaming services through Latin America and the Caribbean and further internationally expanded to more than 130 countries in 2016. (Netflix, 2019) (Figure 1) Nowadays, the streaming giant is the world’s leading internet entertainment service provider with more than 160 million subscribers in over 190 countries enjoying a large library of movies and TV shows across a wide variety of genres and languages. It offers 2nd run licensed titles as well as original content. Additionally, over two million members in the US still subscribed to the company's legacy DVD-by-mail service in 2019. (Netflix, 2019)
Business Model
Netflix operates on a subscription-based model in three reportable segments: domestic streaming, international streaming and domestic DVD. Subscribers pay in advance of the start of their monthly membership to access streaming content or to get DVDs delivered to them. The company offers three different plans for streaming users based on the streaming quality of the content provided and number of screens it can be streamed concurrently – basic (standard definition, single screen), standard (high definition, two screens) and premium (ultra-high definition, four screens). (Figure 2) Netflix has miscellaneous price strategies for its subscription varying across different countries. Pricing on the US plans ranged from $8,99 to $15,99 per month in 2019 and as of December 2018, from the US dollar equivalent of roughly $3 to $20 per month internationally. (Netflix, 2018) Similar operating model is adopted for the DVD renting service, where the monthly membership fees depend on the number of Disc out-at-a-time and Discs definition. As of December 2019, prices for this service started at $7,99 per month and went up to $14,99 per month. (Netflix, 2019) The DVD rental and streaming membership plans are two different services and cannot be clubbed as one.
Figure 2. US Netflix Streaming Plans Source: Netflix Website, 2019
Figure 1. Netflix Timeline Source: Netflix Website, 2019
NETFLIX COMPANY REPORT
PAGE 4/32
Figure 3. Domestic Netflix Subscribers
2017 – 2019
Source: Netflix Annual Report, 2018
Company Analysis
Revenues Value Drivers
Number of SubscribersNorth America remains Netflix largest and most highly penetrated market. The number of domestic streaming subscribers increased at a rapid pace since the introduction of streaming platform, reaching 64,8 million subscribers in 2018. In the second quarter of 2019, the company lost its domestic users for the first time in eight years, dropping by 132.000 paid memberships. (Netflix, 2018) This could mark the streaming giant’s peak subscriber point in North America, which is a natural result of high penetration. However, the company still net added roughly 3 million users in its largest market in 2019, combining a total of estimated 67,8 million domestic subscribers.1 (Figure 3)
Meanwhile Netflix subscriber growth may be slowing in North America, the international markets accounted for roughly 90% of the company’s overall growth in the period between Q1 2017 and Q3 2019, the latest available official data. Europe, Middle East and Africa (EMEA) subscribers increased by 140% during the respective period to 47,4 million memberships, while the Latin American (LATAM) figure nearly doubled to 29,4 million. Asia-Pacific (APAC) is a smaller but faster-growing market, rising from 4,7 million in Q1 2017 to 14,5 million paid membership in Q3 2019. Overall, the company net added roughly 24,4 million international subscribers in 2019, aggregating estimated 98,9 million international members. (Netflix, 2018) (Figure 4)
As for the DVD segment, estimated 2,1 million users still subscribed to the service in 2019. However, the figure has been decreasing year-over-year since its peak in 2010 of about 20 million US subscribers. (D’Onfro, 2019) This represents an annual compound decrease rate of 22,15% to this date. (Figure 5)
Average Revenue per User (ARPU)
An average monthly revenue per paying domestic membership was $12,36 in the first three quarters of 2019, an inflation adjusted growth of 8,5% from the previous year. In 2018, an annual real growth rate of the domestic ARPU was slightly higher at 9,8%.2 (Netflix, 2019) (Figure 6)
1 Total numbers for 2019 in this report were estimated based on first 3 reported quarters of 2019.
2 For the real growth calculations, the following inflation rates were used: 2,1% in 2017, 1,9% in 2018, 2,1% in 2019
Figure 5. Netflix DVD Subscribers 2015 -
2019
Source: Netflix Annual Report, 2018 Figure 4. International Netflix Subscribers
2017 - 2019
NETFLIX COMPANY REPORT
PAGE 5/32 On Netflix international markets, the weighted average monthly revenue per user was $9,44 in the first three quarters of 2019, in comparison to $9,52 in 2018 and $8,70 in 2017. EMEA has consistently had the highest ARPU among the company’s international regions, reported at $10,40 in Q3 2019. In Asia Pacific the respective number was $9,29, followed by Latin America with the lowest revenue per subscriber of $8,63. (Netflix, 2019) However, the ARPU in international regions has fluctuated quarter over quarter, suggesting constant currency exchange rate changes and less aggressive pricing relative to the domestic market. (Figure 6) As for the DVD segment, an average monthly revenue per paying membership has had a negative real growth over the past years. In 2019, the respective revenue was estimated to $10,15, an inflation adjusted decrease of 2,4% from the previous year. On average, the annual real growth of DVDs ARPU was negative 2,3% in the period between 2015 and 2018. (Netflix, 2019) (Figure 6)
Consolidated Revenue
Netflix reported an annual consolidated revenue of $15,8 billion in 2018, a 32,6% real growth from the previous year. With the highest average revenue per user, the streaming within North America contributed the majority of revenues (52,4%). Among the company’s international markets, the highest revenues growth was observed within EMEA, which increased by an inflation adjusted rate of 64,6% to about $4 billion. LATAM revenues were roughly $2,2 billion in 2018, followed by $945,8 million generated in APAC markets. (Netflix, 2019) (Figure 7)
In 2019, the total revenues were estimated to $20 billion. North America streaming segment still contributed about 50% of the revenues, while the respective international streaming share increased to 48,6%. In EMEA the revenues were estimated to $5,5 billion, followed by $2,7 billion in LATAM and $1,5 billion in APAC. The DVDs service generated roughly $294 million revenues in 2019, a 20,6% inflation adjusted decrease from 2018. (Netflix, 2019) (Figure 7)
Profitability
Netflix operating margin has been increasing year-over-year, from 4% in 2016 to estimated 9% in 2019, suggesting an improved profitability of the company. Its net profit margin indicates the same, growing from 3% in 2016 to an estimated 8% in 2019. However, the gross margin of roughly 30% of total revenues, compared to the entertainment industry average of over 90%, suggests that the company has invested a significant amount into its content and the corresponding cost of revenues is therefore notably increasing relative to the revenues. (CSI Market,
2019) (Figure 8) Figure 8. Netflix Profitability Ratios
Source: Netflix Annual Report, 2018 Figure 6. Netflix Average Revenue per
User in 2017 – 2019Q3
Source: Netflix SEC Report, 2019
Figure 7. Netflix Revenues per Region in
2017 - 2019
NETFLIX COMPANY REPORT
PAGE 6/32
Content Strategy
Netflix offers to its subscribers two types of streaming content – licensed and produced. It licenses 2nd run titles as well as Netflix originals, which are licensed exclusively to the streaming giant, such as “House of Cards” and “Narcos”. In 2016, Netflix also started with the self-production of original content, owning the underlying intellectual property of movies and TV shows produced, including “Bird Box” and “Stranger Things”. (Netflix, 2019)
The company spent roughly $15 billion on the content in 2019, its largest annual budget to date. (Smith, 2019) (Figure 9) Aligned with its strategy to move increasingly to original programming, approximately 85% of the expenditure has been earmarked for originals. (Spangler, 2018) Although the licenses remained the majority of content in 2019, the produced assets increased from $2,9 billion in December 2017 to $6,6 billion in March 2019. (Netflix, 2019) The inaguration of Netflix’s first European Production Hub in May 2019 and the announcement of the US Production Hub in New Mexico suggest that the production activities will continue growing.
A higher up-front investment for the prodction relative to licensing is an important factor behind the company's increasing expenditures. However, in-house content could potentially be less expensive in the long term. Owning the underlying intellectual property opens up the possibility for future licensing revenue streams and it provides greater rights flexibility. (Netflix, 2019) It also benefits from lower costs due to an asbcense of studio middle-men,whose markup ranged between 30% and 50% on Netflix original shows. (Fox Business, 2018) Thus, we believe that the increasing production will lead the company to a more profitable future than licensing.
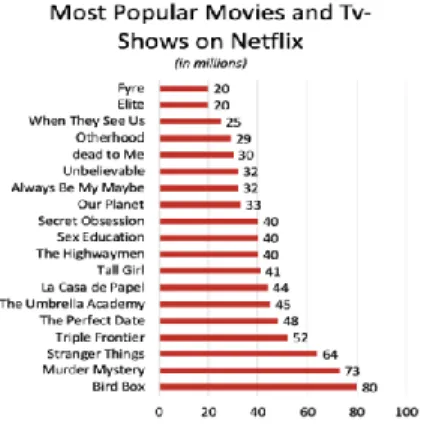
Moreover, Netflix has been to date successful in creating its own content as regards to viewership. The most watched titles released in the period between October 2018 and September 2019 were “Bird Box” with 80 million views in its first month of availability, followed by “Murder Mystery” with 73 million and “Stranger Things Season 3” with 64 million views. (Kobliin, 2019) (Figure 10) Those numbers were significantly lower only two years prior, indicating that the increasing content spend attracts more viewers. The most popular original streaming TV show in 2016 -“Orange is the New Black Season 4”- gained 23 million viewes in the first month of its release, followed by “Stranger Things” with 21,7 million and “Fuller House” with 21,5 million views. (Statista, 2017) (Figure 11)
As of March 2019, roughly 40% of US consumers belived Netflix has the best original content among OTT services. (Schomer, 2019) Besides, fully 62% of US
Figure 9. Netflix Investment into Content
2016 - 2019
Source: Netflix Website, 2019
Figure 12. Importance of Original
Content to Netflix users in the U.S. 2018
Source: Statista, 2018
Figure 10. The Most Popular Shows and
Movies on Netflix in 2019
Source: Irishtimes, 2019
Figure 11. The Most Popular Original
Streaming Shows in 2016
NETFLIX COMPANY REPORT
PAGE 7/32 Netflix subscribers considered original shows absolutely critical (21%) or very important (41%) in their decision to keep using the platform. (Watson, 2018)
(Figure 12) Focusing on international markets with several high profile
commitments for production of local original programming, we expect the company to follow the same path of success globally. In 2019, Spanish “La Casa de Papel Season 3” became the most watched show across the company’s non-English language territories with 44 million views in the first month of release. Sintonia, the latest Brazilian original, was the second most watched inaugural season in Brazil in 2019. (Netflix, 2019)
Assets and Liabilities
Total costs of titles are recorded in the balance sheet as content assets. The company capitalizes the fee per title for licenses, while it capitalizes costs associated with the production, including development costs, direct costs and production overhead for the self-produced content. (Netflix, 2019) The content assets have been increasing year-over-year, from $14,7 billion in 2017 to estimated $25,4 billion in 2019. (Figure 13) Over the past four years, the content assets have represented approximately 77% of total assets, which were estimated to $28,6 billion in 2019. The return on total assets ratio has increased from 2,8% in 2016 to estimated 6,6% in 2019, indicating increasing effectivenes of the investments conversion into net income. (Figure 14)
Once a title becomes available, a corresponding content liability is also recorded in the amount of the total unpaid cost of titles. Consistently with the content assets, the content liabilities have been increasing year-over-year. The respective liabilities grew from $7,5 billion in 2017 to estimated $9,5 billion in 2019. (Figure
15) meanwhile the total liabilities increased from $15,4 billion in 2017 to estimated
$24,2 billion in 2019. Total liabilities to total assets ratio was on average 80% in the 2016 to 2019 period, indicating that the majority of assets was financed through debt.
Capital Structure
The company's free cash flows continued to be negative in 2019 due to the increasing investments in original content. The figure was estimated to - $2,9 billion in 2019, compared to - $2,9 billion in 2018 and - $2 billion in 2017. (Figure
16) Netflix has mostly funded its content acquisition and production by issuing junk
bonds roughly every six months, putting its long-term debt at about $12,5 billion in 2019. This is a significant increasing since 2017, when the long-term debt was $6,5 billion. (Spangler, 2019) (Figure 17) Net debt to market capitalization ratio has
Figure 13. Total Content Assets 2017 -
2020
Source: Netflix Annual Report, 2018
Figure 14. Return on Total Assets 2016 -
2019
Source: Netflix Annual Report, 2019
Figure 15. Total Content Liabilities Source: Netflix Annual Report, 2018
Figure 16. Free Cash Flow 2016 - 2019 Source: Netflix Annual Report, 2018
NETFLIX COMPANY REPORT
PAGE 8/32 changed accordingly – from 0,04 in 2017 to 0,07 in 2019, meanwhile the average ratio of entertainment industry is 0,03. (CSI Market, 2019)
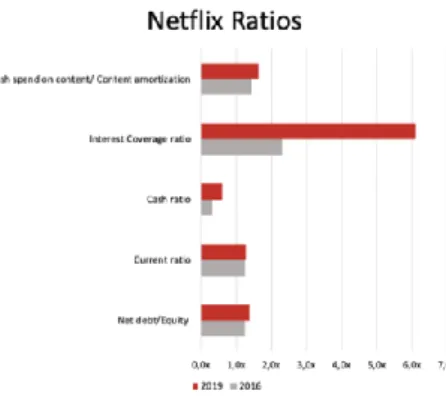
However, increasing debt should not be alarming to investors as the company continues to yield improving results. Netflix current ratio has been increasing year-over-year, from 1,2 in 2016 to estimated 1,3 in 2019, suggesting the growing company’s ability to cover its short-term liabilities. The cash ratio, a liquidity metric of the capacity to pay off short-term liabilities with cash or cash-equivalents, has also improved from 0,32 in 2016 to estimated 0,61 in 2019. Besides, the interest coverage ratio, which grew from 2,3 in 2017 to estimated 6,1 in 2019, indicates Netflix increasing ability to meet its interest payments. (Figure 18)
The return on equity increased from 8,55% in 2016 to estimated 23,64% in 2019, compared to the average ROE of 13% in the entertainment industry, suggesting increasing Netflix profitability in relation to its equity. This growth has occurred even though the return on invested capital is estimated to decrease to 13% in 2019 from 17% in 2017, indicating that the return on equity would have likely been lower without the significant amount of debt in the company’s capital structure. (Yahoo
Finance, 2019)
Stock Performance
Netflix common stock is traded on the NASDAQ Global Select Market under the symbol “NFLX”. The company initiated an initial public offering (IPO) in May 2002, selling 5,5 million shares of common stock at the offering price of $15 per share and closing its first day of trading at $1,20 per present-day share after adjusting for stock splits. (Yahoo Finance, 2019) From thenceforth the stock price has increased significantly and it has continued to be volatile. As of December 15th 2019, the company had a 52-week high record of $385,99 and low record of $231,23 per share. Comparing the performance of the company’s common stock to the S&P500 index over the last three years, Netflix shows significantly higher cumulative returns. (Figure 19)
With 438,25 million shares outstanding, the company’s earnings per share for the twelve months ending September 30th 2019 was $3,13, a 12,19% increase year-over-year. Its price-to-earnings ratio amounted 101,39 compared to the rivals Disney’s22,30, AT&T’s 17,28 and CBS Corporation’s 5,29. (Yahoo Finance, 2019) This indicates that the market anticipates significantly higher earnings growth of Netflix relative to its competitors. Amid the rapid expansion and high investments in the content, the company has not paid any cash dividends and it is highly likely it will not do so in the foreseeable future.
Figure 17. Netflix Long-Term Debt 2016 -
2019
Source: Netflix Annual Report, 2018
Figure 19. Netflix Cumulative Returns Source: Bloomberg, 2019
Figure 18. Netflix Ratios
NETFLIX COMPANY REPORT
PAGE 9/32 Moreover, the company redefined its corporate governance structure in 2018 in a way that brings the board of directors closer to managers and allow an open access to all operational information to efficiently increase. (Spangler, 2018) However, the Netflix approach to governance appears to ignore proxy votes whenever legally possible. (McRitchie, 2018) In June 2019, 158.66 million shareholders voted against the increase of executive compensation plan and 158.46 million voted for it. While the margin was only 190,862 votes against, the company said the vote was non-binding. Thus, the rising compensation will continue to be fueled by stock option grants, which could, if exercised, dilute the value of existing shareholders’ stakes. (Fox Business, 2019)
Industry Overview
Netflix is the leader in Over-the-Top Video (OTT) market, a segment of Entertainment and Media industry. OTT comprises from stand-alone services, which filmed entertainment content is accessed through a broadband or wireless internet connection and is viewable on computer, television, tablet, smartphone or other devices that bypass TV subscription providers. These services are split between transactional video on demand (TVOD) and subscription video on demand (SVOD), the later requiring a subscription like Netflix. To better understand the company, we have analyzed the relevant sectors as well as the trends that indirectly impact on Netflix activity such as an internet usage and cord cutting.
Media and Entertainment Industry
As devices proliferated, two key and closely related trends continue to grab headlines in the media and entertainment industry (M&E): the growth of streaming and mobile video and a shift away from traditional pay TV. Year after year, digital revenues have accounted for a larger share of the industry total revenue. By 2023, the global digital revenues will account for over 60% of the total M&E revenues compared to 50% in 2017. (Chow, 2018) (Figure 20)
Despite the shifting consumer behaviors, the industry forecasted annual growth rate will remain similar to historical trends. Over the next three years, the compound annual growth rate of total revenues in the M&E market will be 4,3%, sending an overall figure of $2,2 trillion in 2019 to $2,6 trillion by 2023. The US M&E industry is the largest in the world. At $717 billion it represents a third of the global M&E industry and is expected to reach more than $825 billion by 2023.
(Chow, 2018) (Figure 21) Figure 20. Share of Digital Revenues in
E&M Industry
Source: PWC Media Outlook, 2018
Figure 21. Revenues of Global E&M
industry
Source: PWC Media Outlook, 2018
Figure 22. Total Over-the-Top Video
Revenues
NETFLIX COMPANY REPORT
PAGE 10/32
Figure 25. SVoD Users by Region 2017 -
2024
Source: Statista, 2019
Over-the-Top Video
Over-the-Top Video (OTT) will lead a growth across media segments in the global M&E market and double its size over the next few years. Global OTT revenue will increase at CAGR 13,8% to $72,8 billion in 2023, with its growth supported by the rising consumer appetite for video-streaming services, consumption increasing in mature markets and rapid expansion in less-developed regions. (Figure 22) In 2018, OTT video revenues were just 18,6% the size of global TV subscription revenue and the figure is projected to increase to 35,4% by 2023. (Chow, 2018) The global OTT market has been dominated by the US with 170 million users in 2018, which is predicted to further increase to 198 million users in 2022. (Sutton,
2019) In 2018, the US claimed almost 40% of the total global revenues and the
figure is expected to reach $61 billion in 2024. (Digital TV Research, 2019) (Figure
23) Netflix viewers accounted for 87% of the total OTT video service users in the
US in 2019, dominating the market along with YouTube, Amazon Prime Video and Hulu. (Sutton, 2019)
Streaming Video on Demand
A raising adoption of subscription video on demand (SVoD) will be the main driver of the OTT market growth. In 2019, SVoD had 1 billion users worldwide and reached an estimated $24,3 billion in revenues. The number of global streaming users is projected to grow at CAGR 4% to 1,3 billion by 2024. Together with the growing annual revenue per user, the total global SVoD revenue is set to increase to $30,4 billion in 2024. (Statista, 2019) (Figure 24)
The industry will grow at different rates across the world. While the North American market is already highly penetrated with 119,5 million users in 2019 and it is forecasted to grow at only CAGR 1,3% until 2024, Asia-Pacific subscriber base is expected to increase at CAGR 6,5%. The projection for EMEA SVoD subscribers over the respective period is CAGR 5,91%, with Africa leading the growth at CAGR 11,26% to 171,4 million African users in 2024. Lastly, SVoD market in Latin America is projected to increase at CAGR 4,2% to 104,6 million subscribers.
(Statista, 2019) (Figure 25)
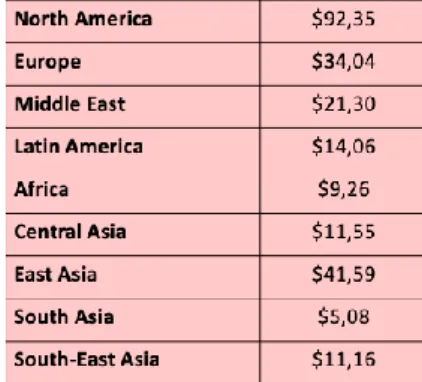
An average revenue per user also varies significantly across the regions. North American ARPU was roughly $92,35 in 2019, followed by $34,04 in Europe, $21,30 in Middle East, $14,06 in Latin America and $9,26 in Africa, while in Asia ARPU ranged between $5,08 (South Asia) to $41,59 (East Asia). All the figures are projected to slightly increase by 2024. (Statista, 2019) (Figure 26)
Figure 23. Number of OTT Video Service
Users in the US 2017- 2022
Source: Statista, 2019
Figure 24. Worldwide Revenue in
SVoD Segment 2017 - 2023
Source: Statista, 2019
Figure 26. ARPU by Region in 2019 Source: Statista, 2019
NETFLIX COMPANY REPORT
PAGE 11/32
DVD
Contrary to digital media, a sharp drop-off of physical media sales has been observed over the past years. The global sales of video disc formats, which in this context means DVD, Blu-ray, and UltraHD Blu-ray, were $25,2 billion in 2014 and only $13,1 billion in 2018. In the US the respective sales were $10,3 billion in 2014 and $5,8 billion in 2018. (Axon, 2018) The figures are expected to perpetually decrease at the similar pace to historical trends. (PWC, 2018) (Figure 27)
Internet Trends and Digital Video
Easier access to computers, higher utilization of smartphones, the modernization of countries and increasing affordability and accessibility of internet access has given people the opportunity to use internet more frequently and with more convenience. In mid-year 2019, there were 4,5 billion internet users, representing the global population penetration of 58,8%. (Internet World Stats, 2019) The figure is forecasted to increase to 6 billion internet users by 2022 and more than 7,5 billion by 2030 or 90% of the projected world population of 8,5 billion, 6 years of age and older. (Freeze, 2019) The US growth rate is significantly lower since the market is already highly penetrated, forecasting 317 million of internet users in 2023. (Statista, 2017) However, broadband internet usage is not equally present in many countries and due to infrastructure reasons, developing online markets rely strongly on mobile connections. Subsequently, global mobile data traffic is set to surpass 77 exabytes per month in 2022, up from 11,5 exabytes per month as of 2017. (Cisco, 2017) Following this mobile internet trend, Netflix already launched the lower cost, mobile-only plan in India and Malaysia in 2019. (Netflix, 2019)
Subscription TV and Cord Cutting
Another trend driving major changes across the US media landscape is the cord cutting. The number of households dropping traditional pay TV subscriptions continues to increase at a rapid pace. In 2019, nearly 21,9 million US households are expected to have given up the pay TV services. The figure is projected to reach 34,9 million in 2023, accounting for approximately 27% of all US households.
(Sutton, 2019) Subscription TV revenue in the US will experience a 2,9% annual
compound decrease from $94,6 billion in 2018 to $81,8 billion in 2023. (PWC,
2019) Video cord cutters come in all ages and are mainly driven by the high cost
of multichannel TV service. However, the cord-cutting is not an international trend up to this date. (Gray, 2019)
Figure 27. Global Home Entertainment
Consumer Spending 2014 - 2018
Source: IHS Markit and Digital Entertainment Group, 2019
NETFLIX COMPANY REPORT
PAGE 12/32
Competitive Landscape
Streaming Wars
In 2019, some of the biggest media conglomerates launched their own streaming services in effort to remain relevant by selling movies and TV programming directly to viewers. The introduction of Disney+ and Apple TV+ in November 2019 ushered in a completely new era of streaming, one where established market leaders like Netflix, Hulu, HBO Go, and Amazon Prime Video are facing growing competition from major new players in the industry. AT&T WarnerMedia's HBO Max and Comcast's Peacock are also getting ready to enter the fray with the release dates in the spring 2020. The streaming wars could have a negative impact on Netflix’s subscriber growth and its market share. (Figure 28)
PEACOCK
Comcast’s new streaming service Peacock will debut in April 2020 with a slate of original programming in addition to exclusive streaming rights to popular NBC staples. The corporation has been spending heavily to reacquire streaming rights to its shows. It will pull some of its existing content from Netflix once licensing agreements expire, including two of the most watched streaming series “The Office” and “Parks and Rec”. The pricing details will be announced later, but it is already known that Peacock will be supported by ads and it will additionally offer a commercial-free version at a higher price. (Adalian, 2019) However, since Comcast is the nation’s largest cable operator, Peacock is expected to be available free to more than 21 million Comcast’s cable subscribers in the US. In addition, Comcast and NBCUniversal are also looking to strike deals with other American pay-TV providers that would allow them to offer Peacock to their subscribers free as well.
APPLE TV+
Apple TV+ has launched in November 2019 in 100 countries. The streaming service is priced at $4,99 a month, undercutting rival Netflix with the basic plan of $8,99. The one-year free trial is included in every purchase of an Apple device. To better understand the scale of it, in 2018 Apple sold globally more than 217 million phone devices alone. For now, the content slate looks slim with just nine titles, but it anticipates to grow through several acquisitions. Apple has been recently spending heavily for deals with big brand names that are supposed to connote quality, including Steven Spielberg among others. The Apple’s budget for new shows has reportedly increased to $6 billion, while Netflix will shell out approximately $15 billion solely in 2019. (Nicolaou, 2019)
Figure 28. Netflix Competitor Table Source: Statista, 2019
NETFLIX COMPANY REPORT
PAGE 13/32 HBO MAX
Through the $80 billion takeover of Time Warner, AT&T now controls HBO, the Warner Bros film studios, and a trove of TV channels. It plans to leverage this catalogue with the new streaming service HBO Max to increase the company’s probability of winning the streaming wars. HBO Max is set to launch in May 2020 and it will offer the exclusive rights to HBO’s full library, Time Warner’s television classics such as “Friends” as well as new original movies. AT&T has committed to increase HBO's original productions budget by 50% to about $1.5 billion exclusively for HBO Max. (Sperling, 2019) The new streaming service will have 10,000 hours of programming and it will cost $15 a month, the same as the already existing HBO Now and $2 more than the Netflix’s most popular tier. HBO Max will start out as an ad-free, Netflix-like subscription-video service and only in 2021 introduce a tier with advertising-supported option at a lower price. Afterwards also add live programming will be added. A long-term goal for HBO Max is to help AT&T retain wireless subscriber and allow the company to pair wireless and DirecTV satellite data to learn more about consumers to charge higher rates to advertisers. AMAZON PRIME VIDEO
Amazon Prime Video is already present on the market for 13 years and it offers an annual membership for $119, which includes ad-free access to the full Amazon Prime Video catalog and several shopping-related benefits. (Levenson, 2019) It offers more than 12.000 movies and TV Shows, having much larger total library than Netflix and Hulu. However, its most recognizable Hollywood films tend to be older and plenty of the titles are mediocre with “a-la-carte” content costing extra. Amazon has been also making investments in its own original content, spending up to $6 billion on original content in 2019, which is still $9 billion less compared to its Netflix.
DISNEY+
Disney+ is priced at $6,99 a month, well below the Netflix’s most popular plan for $12,99. The new streaming service includes Disney’s entire library of films and TV shows. Within a year of the launch, the company plans to add 500 movies and another 2,500 TV episodes to its archives, spending $1 billion on the original content, a figure that it expects to rise to $2,4 billion by 2024. Disney+ expects to have 60 million to 90 million subscribers worldwide by the end of 2024.(Berman,
2019) Through the $52.4 billion acquisition of 21st Century Fox, the entertainment
giant also now owns Fox’s movies and TV studios, which includes the “Avatar” franchise, its regional sports networks, international businesses and the 30 percent
NETFLIX COMPANY REPORT
PAGE 14/32 stake in Hulu, giving Disney a majority of the streaming service. Disney+, ESPN+, and Hulu will be bundled for $12.99.
Who Will Win Streaming Wars?
The likely outcome of streaming wars will be the acceleration of shift from pay TV to video-on-demand services and the increased consumption of the latter, creating major opportunities for all video streaming providers.As the pay TV is lagging with its catch-up services, the global SVoD industry is set to rapidly increase by 2024. However, we expect Netflix domestic market to behave differently than the international one.
In North America, there is a place for more than one streaming service in each household, considering an increasing user expenditure on streaming video and a high current average monthly cost of pay TV bill of roughly $95. (Gray, 2019) In 2019, 70% of households in the US had a subscription to at least one streaming video service. Besides, the average US subscriber watched 3,4 services. (Vindicia,
2019) According to eMarketer, the larger part of US internet users plan to use the
same number of subscription services within two years as of November 2018 and a third is planning to increase the respective figure.3 (Sutton, 2019) (Figure 29) For the international markets, it is hard to estimate those numbers as the SVoD industry is still rapidly evolving. If the US ARPU of pay TV is used as a benchmark and the cord cutting trend as well as the varying SVoD ARPU across regions are taken into account, we come to an estimation between 1 and 2 streaming video subscription per user. We believe that in regions with a higher income and a higher penetration of SVoD services this number will be on average higher than in emergening markets. However, despite the lower number of subscriptions compared to North America, we believe there is still a place for any streaming provider as the international markets are not as highly penetrated and saturated. In 2024, we envision the market to settle as following. Assuming that AT&T, Disney+ and Hulu meet its goals, HBO Max will reach about 80 million subscribers, with 50 million coming from the US, followed by Disney+ with the 75 million subcribers worldwide and one-third of those coming from the domestic market.
(Brooks, 2019) Hulu anticipates to increase its US subscribers base to about 50
million subscribers by 2024 and has currently no plans to expand internationally.
(Barnes, 2019) We estimate that Amazon Prime Video subscriber base will
increase correspondingly with the SVoD industry to over 120 million users worldwide and 55 million domestically, placed second after Netflix with 288 million
3 The survey didn’t define subscription services, but the majority of the US consumers were interested in TV and VoD.
Figure 29. Pay TV ARPU in US Compared
to the Rest of the World
Source: IHS Markit, 2019
Figure 30. Number of Subscribers of Netflix
Competitors
Source: IHS Markit, 2019
Figure 31. Percentage of Subscribers Who
Would Cancel Netflix if Particular Content was Removed
NETFLIX COMPANY REPORT
PAGE 15/32 subscribers. The future of Peacock and Apple TV+ remains unclear due to a lack of data on its medium to long term strategy. (Figure 30)
Impact of Streaming Wars on Netflix
Netflix could lose approximately 20% of its total content library in terms of programming hours as it is owned by the rival companies participating in the streaming wars. (Ampere Analysis, 2019) Soon-to-be-removed content constitutes of more than half of the 50 most popular shows on Netflix. In 2019, WarnerMedia inked the streaming rights to “Friends”, while NBCUniversal secured the rights to “The Office” and “Parks and Recreation”, which will detach three most-watched shows from the platform in 2020 and 2021. (Molla, 2018) (Figure 31)
The content removal could negatively affect Netflix in terms of a subscriber growth. According to a survey conducted by Morning Consult and the Hollywood Reporter in 2019, 22% of the US Netflix subscribers would consider cancelling their subscription if “Marvel movies” were removed. The respective figure for “Disney movies” is 20%, “The Office” 14% and “Friends” 11%. (Shevenock, 2019)
While the library watching is indeed a part of the customer experience, we believe that with the increasing popularity of original content the streaming giant users are more likely to additionally subscribe to the rival streaming service rather than cancel Netflix subscription. The Fortune’s study suggest that only 11% of US Netflix users are likely to cancel their subscription for new streaming service and 41% are likely to additionaly subscribe to Apple TV+, Disney+ or Peacock.
(Lambert, 2019) Besides, the reduction of content did not influence the number of
subscribers in the past despite the existing competition such as Hulu, HBO Now, CBS All Access and Amazon Prime Video. (McAlone, 2016) In fact, the streaming giant has the highest customer retention rate among its competitors. (Rieck, 2019)
(Figure 32)
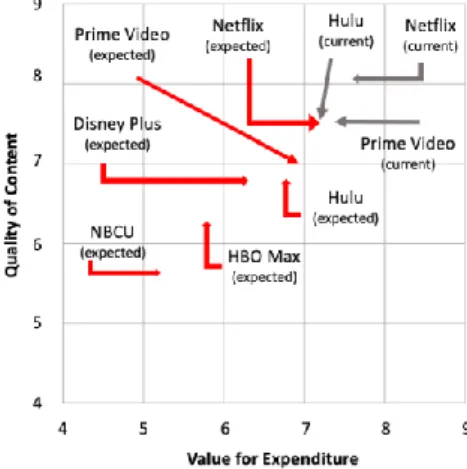
During its rise in the SVoD industry, Netflix has established strong brand recognition, an important advantage helping the company to remain the market leader. Netflix was in 2019 the fastest-growing brand in the US as its value grew 105% over the past year to $21,2 billion. (Spangler, 2019) Its perceived value for expenditure remains the highest even among the new competition. (Langston,
2019) (Figure 33) Thus, we believe that the competitive pressure will not impact
on Netflix prices. According to ING Economics Department, expensive subscriptions can succeed if added value is high enough. (ING, 2018) In our opinion, Netflix is on the right track to keep providing high perceived value considering it has the highest investment in the entertainment content among its rivals. (Barker, 2019) (Figure 34)
Figure 33. Current and Expected Value for
Expenditure of Streaming Platforms
Source: The Langston Co, 2019
Figure 32. Customer Retention Rate in the
US
Source: Second Measure, 2019
Figure 34. How Much Companies Spend
on Content
NETFLIX COMPANY REPORT
PAGE 16/32 The streaming wars will assumbly have less vigorous impact on the Netflix’s international markets due to the current lower SVoD industry penetration and saturation compared to North America. Besides, the majority of new streaming providers is expected to have a large part of its subscriber base within the US. With the strong brand image, focus on international content and adaptation of the prices across different countries, we believe that the streaming wars will not have a significant impact on Netflix international markets in terms of its subscriber base as well as the average revenue per user.
Forecasting
Content Strategy, Assets and Liabilities Forecast
Netflix has been ramping up its content spend for several years and will likely continue to do so in a bid to hold on to its position as the market leader. In November 2019, CEO Reed Hasting said at the New York Times‘ DealBook conference the company was planning on “taking spending up quite a bit”. (Smith,
2019) With the intensfying streaming wars, Netflix increased its content
expenditure to $15 billion for 2019 to produce more exclusive content and strengthen its foothold. On average, the inflation adjusted incremental content investment increased annually by $2,6 billion since 2015. We expect the incremental spend to continue growing at the same pace until 2024, when the SVoD market will assumably stabilize. The content expenditure will additionaly increase at the global inflation rate of 3,4% as the titles are expected to become more global rather than the US focused. (IMF, 2019) Afterwards, the content investment is expected to remain at the similar level of pre-streaming wars in 2019, increased by the respective global inflation of 3,4%. (Figure 35)
We expect the content assets to increase proportionally to the cash spent on content with the coefficient of 1,76, which was calculated based on the period of 2016 to 2018. (Figure 36) Total streaming content assets are estimated at $48,8 billion in 2023, $30 billion in 2024 and thenceforth increase 3,4% per annum in nominal terms. The content liabilities are forecasted to increase correspondingly to content assets with the coefficient of 0,21, which was calculated based on the period of 2016 to 2018. (Figure 37) Total content liabilities are estimated at 14,4 billion in 2023,10,5 billion in 2024 and thenceforth increase on average 2,2% per year in nominal terms. (Figure 38)
Figure 35. Projected Content Investment
2020 - 2030
Source: Netflix Annual Report, 2018
Figure 38. Projected Content Assets
vs. Projected Content Liabilities, 2020 - 2030
Source: Netflix Annual Report, 2018 Figure 36. Content Assets Regression
Output
Figure 37. Content Liabilities Regression
NETFLIX COMPANY REPORT
PAGE 17/32
Cost of Revenues Forecast
Amortization of streaming content assets makes up the majority of cost of revenues. Content assets are amortized on accelerated basis over the shorter of the title’s window of availability or estimated period of use or 10 years. (Netflix,
2019) One way to monitor the amortization is the ratio of cash spend on content
and content amortization, which indicates the timing differences between cash payment terms on content and the content expense recognition. The respective ratio was estimated to 1,60 in 2018, increased by 0,16 from the previous year, as cash payments are more front end loaded, especially for a produced content. There is no reason to assume any changes to this ratio in the near future since the content strategy is expected to remain the same. Thus, amortization is projected to increase to $17,7 billion in 2023, $11 billion in 2024 and it will stabilize afterwards, consistently with the content expenditure. (Figure 39)
Other costs of revenues include content personnel costs, portions of the overall deals with certain content creators, music rights, miscellaneous expenses related to production, streaming delivery expenses and other operating costs like payment processing and customer service and other costs involved in making our content available to members. (Netflix, 2018) Over the last three years, those costs were consistently proportionate as 20% to the total streaming revenues and are expected to change accordingly. Thus, we expect that the total streaming cost of revenues will be roughly $24,7 billion in 2023, $18,6 billion in 2024 and steadily increase annually on average at 4,2% thereafter. (Figure 40)
Marketing Forecast
The tech-centric company is known to handle most media in-house, developing its own marketing model and processing internal data on its own. The company’s less traditional marketing strategy is not expected to change in the near future. As a performance marketer, Netflix will continue to develop innovative marketing strategy through a broad mix of marketing and public relation programs to reach a broader audience. We expect most of it to go to digital, especially programmatic, with the goal of improving its ability to do individualized marketing.
The marketing expenditure, which consist primarily of advertising expenses and certain payments made to the marketing partners, was over the past years aligned with the company’s content strategy. In 2018, Netflix spent $2,37 billion on marketing activities, compared to $1,44 billion in 2017, and further boosted the annual budget to estimated $2,57 billion in 2019. (Figure 41) We expect that this spend will continue increasing correspondingly to the investment in streaming
Figure 39. Projected Amortization of
Streaming Content Assets 2020 - 2030
Source: Statista, 2019
Figure 40. Projected Total Costs of
Revenue 2020 - 2030
Source: Netflix Annual Report, 2018
Figure 41. Projected Marketing Costs 2015
- 2030
Source: Netflix Annual Report, 2018
NETFLIX COMPANY REPORT
PAGE 18/32 content with the coefficient of 0,19, calculated based on the period between 2016 and 2019. (Figure 42) Over the next ten years, an annual average marketing budget is forecasted at roughly $3,7 billion.
Technology and G&A Forecast
Technology and development costs consist of payroll and related expenses for all technology personnel, as well as other costs incurred in making improvements to the service offerings, including testing, maintaining and modifying user interface.
(Netflix,2018) Since 2015 the technology and development costs have been slowly
decreasing as the percentage of revenues and we expect this trend to continue due to the further economies of scale. (Figure 43) From 2023 onwards, these costs are forecasted to remain at 4,5% of revenues, which is the average technology spend in a media industry. (Deloitte, 2018)
General and administrative expenses consist of payroll and related expenses for corporate personnel, professional fees and other general corporate expenses. The costs have been on average 4% of the total revenues over the past five years (2015-2019) and there is no reason to assume this ratio will change. (Figure 45)
DVD Revenues Forecast
As the overall physical media industry is declining, we anticipate that the revenues generated by the DVDs-by-mail segment will continue to decrease. However, there will likely be some persistent level of demand for DVDs, particularly in rural areas where broadband is not easily available or affordable. (Netflix, 2019) We assume that the streaming giant will go out of the DVDs business by latest in 2023. Its subscribers base is going to decline at the average annual rate of negative 19,8% in nominal terms, calculations based on the historical trends of segment. The average monthly revenue per paid membership is going to remain roughly $10,05. Thus, the revenues are expected to decline from estimated $0,29 billion in 2019 to $0,12 billion in 2023. (Figure 45)
Domestic Streaming Revenues Forecast
SubscribersWe expect the number of subscribers in North America to change in the period between 2020 and 2024 correspondingly to the SVoD industry at the same pace as it did in the period between 2017 and 2019. To obtain the respective coefficient, the regression analysis was performed. Netflix total paid domestic memberships at the end of period was treated as dependent variable, meanwhile the total number of SVoD users in Canada and the US, data obtained on Statista, was taken
Figure 44. Projected G&A Costs 2020 -
2023
Source: Netflix Annual Report, 2018
Figure 45. DVD Forecast
Source: Netflix Annual Report, 2018 Figure 43. Projected T&D Costs 2020 -
2023
NETFLIX COMPANY REPORT
PAGE 19/32 as an independent variable. An important remark is that the regression model lacks an adequate sample size and its P- value of 0,142 suggest that it is non-significant considering a 95% significance level. However, as the model explains 95,1% of the Netflix paid domestic subscribers’ changes and we find the coefficient coherent, we proceeded with the analysis. The regression coefficient indicates that in the period between 2017 and 2019 Netflix subscriber base grew 1,79 times faster than the total SVoD industry in North America. However, the coefficient was further corrected for the forecasting purposes by negative 11%, representing the number of Netflix subscribers expected to cancel their subscriptions as a result of the streaming wars. (Figure 46)
The streaming giant’s subscriber base in North America is projected to grow at CAGR 4,2% until 2024, reaching 83,4 million users. We believe that this growth will be partially driven by the termination of DVDs segment as well as the cord cutting trend. Afterwards, we anticipate the growth to slow to the region’s projected population growth of 0,38% due to a high market penetration and saturation.
(Worldometers, 2019) (Figure 47)
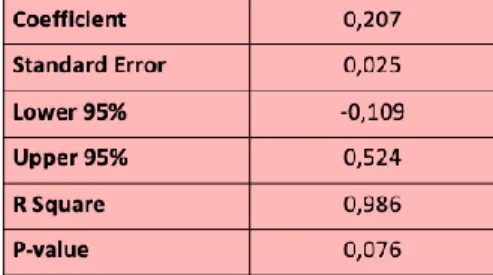
Average Revenue per User
We anticipate the revenue per user in North America to change in the period between 2020 and 2024 correspondingly to the SVoD industry at the same pace as it did in the period between 2017 and 2019. For the projection of real price growth over the next four years, we used a regression modelling. The inflation adjusted average annual revenue per paying domestic membership of Netflix was regressed against the average revenue per user in the industry in North America. An important remark is that the regression model lacks an adequate sample size and its P-value of 0,067 suggest that it is non-significant considering a 95% significance level. However, as the model explains 98,9% of the Netflix domestic ARPU changes and we find the coefficient coherent, we proceeded with the analysis. (Figure 48)
The company’s ARPU in North America is projected to increase at the IMF suggested future inflation rate of 2,3% and at the SVoD ARPU with the coefficient of 2,04. (IMF, 2019) In 2024, the Netflix ARPU will increase to 15,21 and its growth will afterwards drop to the respective North American inflation rate, considering that the streaming service provider is not expected to significantly increase its annual content budget any longer and that the industry is expected to stabilize.
(Figure 49) Figure 49. Projected Average Revenue
per User in North America 2020 - 2030
Source: Netflix Annual Report, 2018 Figure 47. Projected Domestic Subscribers
2020 - 2030
Source: Netflix Annual Report, 2018 Figure 46. Subscribers in North America
Region Regression Output
Figure 48. ARPU in North America Region
NETFLIX COMPANY REPORT
PAGE 20/32 Revenues
The total revenues of domestic streaming segment will increase to roughly $14,7 billion in 2024. Afterwards, the annual nominal revenue growth will stabilize at 2,7% as the subscriber’s growth and the real price growth will slow.
International Streaming Revenues Forecast
Subscribers4
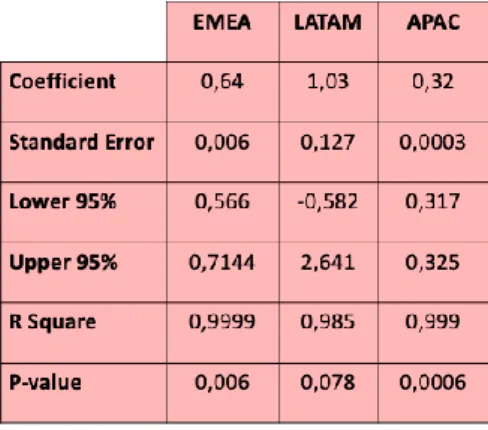
We expect the number of international streaming subscribers to change in the period between 2020 and 2024 correspondingly to the SVoD industry at the same pace as it did in the period between 2017 and 2019. For the forecasting purposes, we have divided the international markets into three regions - APAC, EMEA and LATAM. To obtain the respective coefficients, the regression analysis was performed for each region. Netflix total paid memberships at the end of period was treated as the dependent variable, meanwhile the total number of SVoD users in the respective market was taken as the independent variable. An important remark is that all regression models lack an adequate sample size and their P-values suggest that EMEA and APAC models are significant, while LATAM is not significant considering a 95% significance level. Moreover, as all the models explain over 97% of the number of Netflix subscriber changes and we find the obtained coefficients coherent, we proceeded with the analysis. (Figure 50) The number of Netflix subscribers in EMEA is projected to grow at CAGR 16,8% until 2024 with the regression coefficient of 0,64. It will reach 113,1 million users in 2024, becoming the largest company’s subscriber base. In the period between 2024 and 2030, we anticipate the subscriber growth to drop to the weighted average of internet penetration growth as of 2024 in Africa (8,5%) and Middle East (1,98%) as well as Europe’s growth of population (-0,12%), where the internet penetration was already 87,7% in 2019. In 2030, when presumablymore than 7,5 billion by will have an internet access, the growth in all regions will stabilize to the weighted average of the regions’ population growth of 0,84%. (Figure 51)
LATAM subscriber base is forecasted to grow at CAGR 12,47% in the period between in 2019 and 2024 with the regression coefficient of 1,029, reaching 55,6 million subscribers in 2024. Afterwards, we anticipate the growth to drop to the average of internet penetration growth as of 2024 of 3,5% until 2029 and beyond that stabilize at the population growth of 0,32%. (Figure 51)
4 The internet penetration in 2019 data was obtained from Internet World Statistics, meanwhile the internet penetration growth as of 2024 was obtained from Statista. For the population growth, the numbers from Worldometeres are used.
Figure 51. Projected International
Subscribers by Region 2020 - 2030
Source: Netflix Annual Report, 2018 Figure 50. Subscribers in EMEA, LATAM,
NETFLIX COMPANY REPORT
PAGE 21/32 In APAC markets, the number of subscribers will increase at CAGR 19% in the period between 2019 and 2024 with the regression coefficient of 0,321, reaching roughly 36,3 million subscribers in 2024. Afterwards, we anticipate the growth to drop to the average of internet penetration growth as of 2024 of 3,6% until 2029 and afterwards to stabilize at the population growth of 0,25%. China was excluded from the projections as there are no signs of Netflix entering the market in the foreseeable future. (Figure 53)
Average Revenue per User
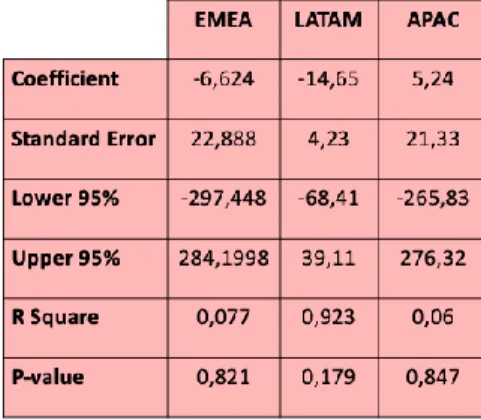
We expect the average revenue per user in Netflix international markets to change in the period between 2020 and 2024 correspondingly to the SVoD industry at the same pace as it did in the period between 2017 and 2019. For the projection of real price growth over the next four years, we used a regression modelling. The inflation adjusted average annual revenue per paying membership of Netflix was regressed against the average revenue per user in the respective region. An important remark is that the fluctuation of exchange rates of Netflix ARPU and a significant dispersion of industry’s prices in certain region significantly reduced the accuracy of the regressions and that all the models are non-significant. However, as we find the coefficients coherent, we proceeded with the analysis.
The company’s ARPU in EMEA is projected to increase at the weighted average inflation rate in Europe, Middle East and Africa of 5,2% and at the SVoD ARPU with the coefficient of -6,62. In 2024, the Netflix EMEA ARPU will increase to $13 and will afterwards stabilize at the growth of the respective inflation rate. For the projection of LATAM ARPU, the coefficient of -14,65 and inflation rate of 3,50% was used and for APAC 5,24 and 3,40%, respectively. (Figure 52) Thus, we expect the monthly revenue per LATAM subscriber to decrease to $7,69 in 2024, meanwhile the APAC figure will increase to $10,95. Beyond 2024, the average monthly revenue per paying international membership is going to increase correspondingly to the regions’ inflation rates. (Figure 53) The figures are calculated under assumption that the exchange rates will not change significantly in the foreseeable future. (Figure 54)
Revenues
The consolidated revenues of Netflix international streaming segment are projected at $23,3 billion in 2024 with EMEA contributing $14,9 billion, followed by $4,5 billion revenues generated in LATAM and $3,9 billion in APAC. In 2029, before the subscriber growth stabilizes in all regions at the average population growth, the revenues are set to reach $23,2 billion in EMEA, $6,4 billion in LATAM and $5,6 billion in LATAM.
Figure 54. Projected International
Average Revenue per User by Region 2020 - 2030
Source: Netflix Annual Report, 2018 Figure 52. ARPU in EMEA, LATAM and
APAC Region Regression Output
Figure 53. EMEA, LATAM, APAC Inflation
Rates
NETFLIX COMPANY REPORT
PAGE 22/32
Valuation
Weighted Average Cost of Capital
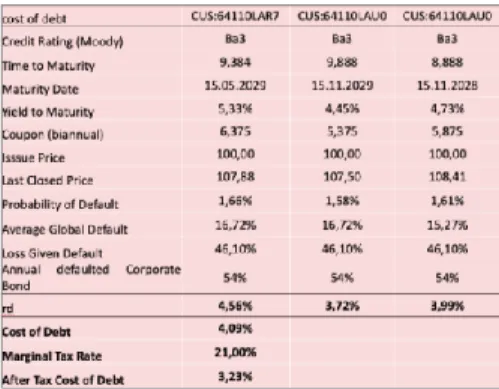
The 4,09% cost of debt was derived from the average cost of debt of the three recently issued Netflix bonds in US dollars with the maturity date of 15th November 2028, 15th May and 15th November 2029. The calculations were based on the yield to maturity of the respective bonds, probability of default and loss given default. The cost of debt is similar to the yield of government bonds of the same Moody’s rating Ba3. (Figure 55)
The 9,80% cost of equity was derived using the Capital Asset Pricing Model (CAPM). The raw beta was calculated with the regression model of the company stock returns against market portfolio S&P500 with the measurement period of three years of weekly returns. The model explains 27,7% of the changes in Netflix returns and its P-value of 2.86*10^(-13) suggests that the coefficient is significant, considering 95% significance level. The raw beta of 1,61, with confidence intervals ranging between 1,21 and 2,0, indicates that the stock's movements were about 161% of the index's movements in the respective period. However, for the CAPM model the forward-looking adjusted beta of 1,4 was used, assuming that the security's beta will move toward the market average over time. (Figure 56) The calculated weighted average cost of capital is 9,71%. The forward-looking debt-to-equity ratio used is 0,03, the average of media and entertainment industry. Although the respective ratio of Netflix is currently 0,07, we believe that with the increasing profitability and stabilizing investments into content the amount of debt is going to significantly decrease after 2024.
Free Cash Flows
Free cash flows will remain negative until 2024 as a result of the company’s presumable content strategy. The free cash flows are projected to be on average - $3 billion per annum in the respective period. After reaching the peak of the streaming content spend growth in 2023, the cashflows are expected to be positive thenceforth. (Figure 57)
Growth, Reinvestment Rate and ROIC
Netflix nominal perpetual growth of 4,16% was derived from its reinvestment rate and return on invested capital (ROIC) as of 2030, when the company’s growth will assumable stabilize. Netflix reinvestment rate is projected to be on average over 285% until 2024 and afterwards decrease to 6% in 2030, a result of the projected
Figure 55. Cost of Debt for Netflix Source: Moody’s, 2019; Bloomberg, 2019
Figure 57. Netflix Free Cash Flow 2019 -
2023
Source: Netflix Annual Report,2018 Figure 56. CAPM Regression Output Source: Bloomberg, 2019
NETFLIX COMPANY REPORT
PAGE 23/32 content strategy. The return on invested capital is forecasted to be on average 8% over the next four years and it will thereafter increase year-over-year to 67% in 2030. This suggest that with the subscription business model the investment in original content, particularly in the in-house produced titles, is profitable on the long term and the company will continue providing value for its shareholders.
Scenario Analysis
As the main risk of Netflix we identify its subscribers growth. If the company’s efforts to attract and retain subscribers are not successful, particularly with the new fierce competition, the business will be adversely affected. Considering that the content costs are largely fixed and contracted over several years, the company may not be able to adjust its expenditures or increase its revenues per user. Therefore, we conducted a scenario analysis of the different growth rates of streaming subscribers and its impact on Netflix enterprise value.
In the original model, the annual North American SVoD subscriber growth until 2024 is on average 1,4% and for the domestic DVDs segment -22,7%. In the international markets the growth ranges from 4,3% in LATAM region to 5,9% and 6,5% in EMEA and APAC, respectively. The share price in this scenario is $359,6 and therefore investor decision is to BUY.
In the optimistic scenario, we assume that the annual North American SVoD subscriber growth is on average 2,5%, meanwhile the DVDs-by-mail subscribers’ decrease remains the same. In international markets growth ranges from 5,4% in LATAM region to 7% and 7,6% in EMEA and APAC, respectively. The share price in this scenario is $466,5 and therefore investor decision is to BUY.
In the pessimistic scenario, we assume that the annual North American SVoD subscriber growth is on average 0,8%, meanwhile the DVDs-by-mail subscribers’ decrease remains the same. In the international markets the growth ranges from 3,7% in LATAM region to 5,3% and 5,9% in EMEA and APAC, respectively. The share price in this scenario is 298,5 and therefore investor decision is to SELL. This scenario could occur if Netflix does not perform well in Streaming wars, and would lose its subscribers to Disney or any other competitor.
Sensitivity Analysis
We have conducted sensitivity analysis for each of the 3 scenarios to examine how the discount rate and the perpetual growth rate impact on Netflix market capitalization. In the analysis’, the growth rate ranges from 1% to 6%, whilst the discount rate span from 8% to 15%.