T
HE
E
UROPEAN
U
NION
E
MISSIONS
T
RADING
S
YSTEM AND ITS
I
MPACT ON
E
CO
-I
NNOVATION
M
ASTER
T
HESIS
BY
L
ENNART
D.
O
SSES
The European Union Emissions Trading System and its
Impact on Eco-Innovation
Empirical evidence for the weak Porter Hypothesis from the
world’s most extensive cap-and-trade system
Master Thesis at
Maastricht University School of Business and Economics
& NOVA School of Business and Economics
Submitted by Lennart D. Osses
Student ID UM: 6095088
Student ID NOVA: 38749
Thesis supervised by Michael Grätz and Leid Zejnilovic
Second read by Martin Carree and Jolien Huybrechts
A
BSTRACTThe European Union Emissions Trading System (EU ETS) is the world’s most extensive emissions cap-and-trade system. The Porter Hypothesis states that a policy like the EU ETS can induce eco-innovation and ultimately alter the financial performance of regulated firms. Nevertheless, previous research has not yet comprehensively confirmed the validity of the Porter Hypothesis in cap-and-trade systems in general, and in the EU ETS specifically. Exploiting installation-level inclusion criteria, the paper assesses the causal impact of the EU ETS on firm’s eco-patent output and return on assets by following a matched difference-in-difference approach. In line with the weak Porter Hypothesis, it is found that the second phase of EU ETS altered the eco-patent output of regulated firms in the sample by 1.8%, mainly inducing innovations in German companies. Reasons for the rather low policy effect entail the innovation-impeding impact of the Financial Crisis, an oversupply of allowances, and the subsidized deployment of renewable energy sources to electricity, which resulted in low permit prices. Contrary to the strong Porter Hypothesis, the policy did not enhance financial performance of regulated companies, which can be further expounded by the time lag associated with the profitability of eco-innovations. Deriving from the findings, policy makers should enact EU ETS reforms focused on decreasing the emission cap, introducing means to stabilize the allowance price, carefully assessing if the scheme can be extended to other sectors, and launching other eco-innovation enhancing instruments.
Keywords:
cap-and-trade system, difference-in-difference estimation, eco-innovation, EU ETS, induced innovation, patent analysis, policy analysis, Porter Hypothesis, propensity score matching
T
ABLE OFC
ONTENTSABSTRACT ... I TABLE OF CONTENTS ... II
LIST OF TABLES AND FIGURES ... IV
LIST OF ABBREVIATIONS ... V
1.INTRODUCTION... 1
2.THE EUROPEAN UNION EMISSIONS TRADING SYSTEM ... 4
2.1. Design: market-based pollution control via a cap-and-trade system ... 4
2.2. Implementation: increasing the stringency of the EU ETS via four phases ... 7
3.THEORETICAL FRAMEWORK ... 9
3.1. Theoretical foundation: from Induced Innovation Hypothesis to Porter Hypothesis ... 9
3.2. Literature review and hypotheses: the EU ETS and eco-innovation ... 10
3.2.1. The EU ETS and the weak Porter Hypothesis ... 11
3.2.2. The role of increasing stringency and certainty in the EU ETS ... 14
3.2.3. The EU ETS and the strong Porter Hypothesis ... 15
4.METHODOLOGY ... 19
4.1. Data description... 19
4.1.1. Identification of regulated companies in the EU ETS ... 19
4.1.2. Identification of comparable non-regulated companies and matching via PSM . 20 4.1.3. Composition and description of the final dataset ... 23
4.2. Empirical specification ... 24
4.2.1. Regression models ... 24
4.2.2. Dependent variables ... 27
4.2.3. Independent and control variables ... 28
4.2.4. Estimation approach ... 29
5.RESULTS ... 31
5.1. Empirical results ... 31
5.1.1. Model one: the EU ETS - eco-innovation relationship ... 32
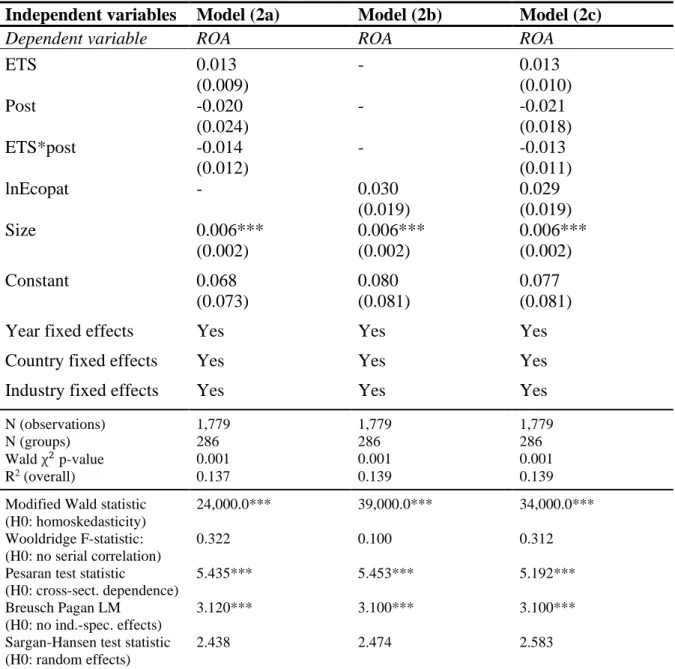
5.1.2. Model two: the EU ETS - financial performance relationship ... 33
5.2. Robustness checks ... 35
6.DISCUSSION ... 38
6.1. The Porter Hypothesis in the EU ETS ... 38
6.1.1. The EU ETS and the weak Porter Hypothesis ... 38
6.2. Contributions and implications ... 44
6.2.1. Theoretical contributions ... 44
6.2.2. Policy implications ... 45
6.3. Limitations and future research ... 46
6.3.1. Sample construction and composition ... 47
6.3.2. Methodological approach ... 47
6.3.3. Further research opportunities ... 49
7.CONCLUSION ... 50
8.LIST OF REFERENCES ... V
9.APPENDICES ... XVII Appendix A – Firm demographics ... XVII Appendix B – Dataset descriptive statistics ... XVIII Appendix C – Hypotheses and results... XIX Appendix D – Robustness checks ... XX 10.DECLARATION OF ORIGINALITY ... XXIII
L
IST OFT
ABLES ANDF
IGURESTable 1. Implementation phases of the EU ETS ………..6
Table 2. Adjusted descriptive statistics ………...24
Table 3. Estimation results for model one ………..……… 33
Table 4. Estimation results for model two ………...34
Figure 1. Price development of EUAs between 2004 and 2015 ... 14
Figure 2. Identification strategy to obtain sample ... 19
Figure 3. Sample propensity score distribution ... 22
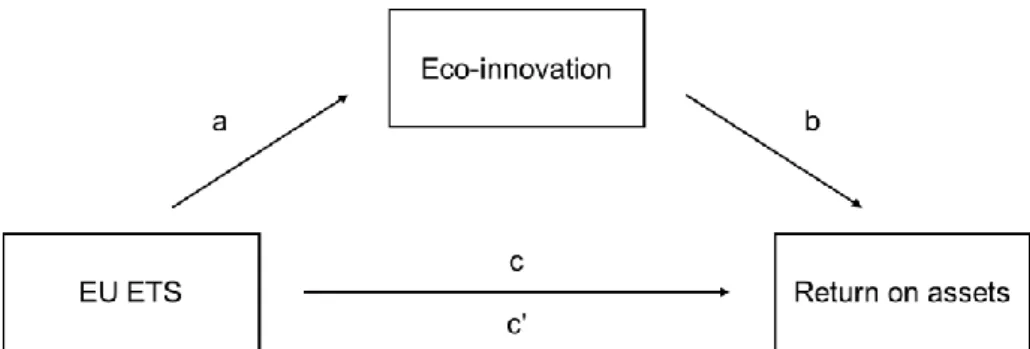
Figure 4. Conceptual mediation model ... 26
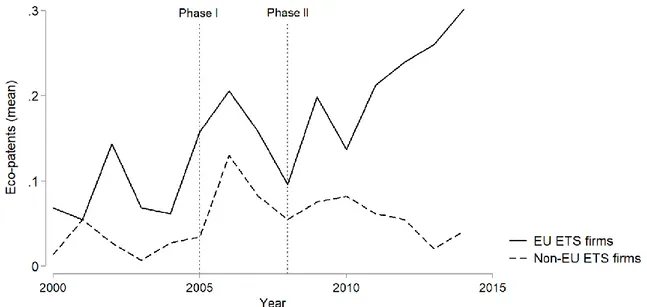
Figure 5. Mean eco-patent output from 2000-2014 ... 31
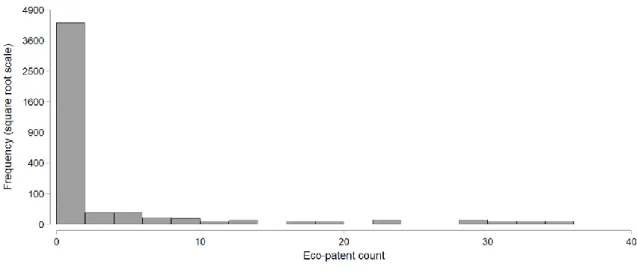
Figure 6. Frequency diagram of eco-patent counts ... 37
Figure 7. Summary of interactions between EU ETS and RES-E policies ... 42
L
IST OFA
BBREVIATIONSATT Average treatment effect on the treated CER Certified Emission Reduction
CPC Cooperative patent classification DID Difference-in-difference
EPO European Patent Office ERU Emission Reduction Unit
EU European Union
EUA European Union Allowance
EUC European University Center
EU ETS European Union Emissions Trading System GLS General least squares regression
GHG Greenhouse gas
LM Lagrangian Multiplier
NACE Classification of Economic Activities in the European Community NAP National Allocation Plan
NIM National Implementation Measure NIS National Innovation System
OECD Organization for Economic Co-operation and Development PATSTAT Worldwide Statistical Patent Database (EPO)
POLS Pooled Ordinal Least Squares regression PSM Propensity score matching
R&D Research and development
ROA Return on assets
RES-E Renewable energy sources to electricity VIF Variance Inflation Factor
1.
I
NTRODUCTIONOne of the most salient issues of today’s global society is anthropogenic climate change (United Nations, 2019). The first supranational attempts to mitigate the impact of humankind on global warming are manifested in the Kyoto Protocol, which stipulates target values for greenhouse gas (GHG) emissions in industrialized countries (United Nations, 1998). In 2005, the European Union (EU) established the EU Emissions Trading System (EU ETS) to achieve its Kyoto Protocol target of 20% GHG emissions reduction, compared to 1990 levels, by 2020 (European Commission, 2004). The EU ETS is the world’s most extensive cap-and-trade program for carbon dioxide (CO2), nitrous oxide, and perfluorocarbons, covering
approximately 48% of GHG emissions in the EU (Dechezleprêtre, Nachtigall, & Venmans, 2018). Divided into three implementation phases, the EU ETS is primarily focusing on reducing emissions and has been successful in doing so (Venmans, 2012; European Commission, 2015; Borghesi & Montini, 2016; Dechezleprêtre et al., 2018).
However, the EU ETS also impacts firm-level determinants. In particular, the ability of the EU ETS to incentivize eco-innovation is crucial to accomplishing the EU’s long-term GHG emission targets (Calel & Dechezleprêtre, 2016; Dechezleprêtre et al., 2018; Joltreau & Sommerfeld, 2019). The EU ETS administers carbon pricing through the issuance of EU Allowances (EUAs), which are permits to emit one equivalent ton of CO2 (tCO2). Thereby,
emissions become valued, and firms’ emission costs increase (Greenstone, List, & Syverson, 2012; Joltreau & Sommerfeld, 2019). If relative prices of input factors change, Hick's (1932) Induced Innovation Hypothesis suggests that companies will deploy investments that target the cost reduction of these input factors. Porter (1991) is credited with making this principle accessible in the context of environmental policy. He argues that strict environmental regulations can induce innovation, which ultimately improves firms’ competitiveness by increasing efficiency. Under the Porter Hypothesis, firms can be expected to deploy capital targeting the development and commercialization of technologies that reduce emissions and costs associated with it (Porter & Van der Linde, 1995). The Organization for Economic Co-operation and Development (2009b, p. 8), OECD in short, labels this type of innovation “eco-innovation”, which covers process and product innovations (Rennings, 2000).
A higher level of eco-innovation is a central assumption of the EU ETS, but ex-post research in the field has not yet provided comprehensive insights on whether the policy has induced
eco-innovation. This is because the use of unrepresentative samples and the confinement on the first phase of the regulation (2005-2007) restrict existing insights.
Considering the first limitation, a skein of scientists studies the impact of the EU ETS on innovation in a specific country or industry context and thus fails to provide EU-wide insights. For instance, Anderson, Convery, and Di Maria (2011), survey Irish EU ETS firms1 and find that 48% of organizations employed new, less carbon-intensive machinery and equipment, and 78% made process changes. Borghesi et al. (2012) use the Community Innovation Survey to study Italian manufacturing firms and find that the effect of the policy on environmental innovation is weak expect for energy efficiency innovations. Löfgren, Wrake, Hagberg, and Roth (2013) assess the technology adoption of EU ETS and non-EU ETS firms2 in Sweden. They find no significant effect of the EU ETS on large or small investments into green technologies. Although these studies do not shed light on the EU-wide impact of the policy, it appears that there is limited evidence for an eco-innovation stimulating effect of the EU ETS in specific countries or industries. To date, only one study is known that presents robust and representative evidence (Marcantonini, Teixido-Figueras, Verde, & Labandeira-Villot, 2017; Joltreau & Sommerfeld, 2019). Calel and Dechezleprêtre (2016) investigate the direct impact of the EU ETS by comparing patent applications for low-carbon eco-innovations across regulated and non-regulated firms. In their sample, the authors find that the EU ETS was responsible for a 36.2% increase in low-carbon patent applications.
However, Calel & Dechezleprêtre (2016) primarily analyze data from the first phase of the policy, which constitutes the second major limitation. In the initial setup of the regulation, the EU devised the first phase as the pilot phase, focusing principally on developing the regulatory infrastructure (European Commission, 2004, 2015). From phase two (2008-2012) onwards, the stringency of the policy has been increasing. Under the Porter Hypothesis, a stricter policy leads to a higher level of innovation outputs because emission costs increase. Furthermore, firms intend to increase their level of efficiency, thereby cutting costs and maintaining competitiveness. In addition to that, clarity about the regulatory framework makes investments in the development of innovations more likely (Jalonen, 2012). Hence, assessing more recent data is imperative to provide insights into whether the second phase of the EU ETS had a (different) impact on the eco-innovativeness of regulated firms.
1 In the EU ETS, installations, not firms, are regulated. The thesis considers firms that possess at least one
regulated installation as EU ETS firms.
Consequently, the central purpose of the thesis is to give forth new insights into the effect of the EU ETS on eco-innovation by assessing firm-level eco-patent output in the first two implementation phases of the policy. To do so, firstly, the thesis intends to create generalizable new insights that close the research gap outlined above. The study uses a quasi-experimental study design by constructing a sample of regulated and comparable non-regulated firms via propensity score matching (PSM). Subsequently, applying a difference-in-difference (DID) approach, the study compares the eco-patent output of the two company groups. Patent data is considered a reliable proxy for measuring eco-innovation because it is quantitative, output-oriented, and can be disaggregated (Acs & Audretsch, 1989; Johnstone, Haščič, & Popp, 2010; Haščič & Migotto, 2015). Secondly, the study extends the existing body of research on the Porter Hypothesis. An extensive collection of literature has assessed the impact of environmental policies on innovation (Goulder & Schneider, 1999; Van Der Zwaan, Gerlagh, Klaassen, & Schrattenholzer, 2002; Gerlagh, 2008; Acemoglu, Aghion, Bursztyn, & Hemous, 2012). However, evidence for the validity of the Porter Hypothesis in cap-and-trade systems is limited and contradictory (Tietenberg, 2010; Ambec, Cohen, Elgie, & Lanoie, 2013). As the EU ETS is the first supranational cap-and-trade system, comprehension of its impact on eco-innovation can provide essential novel insights. Thirdly, the thesis gives a practical rationale for the possible extension of the policy to currently exempted sectors (e.g., road logistics3) and
development of other emission trading markets (e.g., in China4).
The remainder of the thesis is structured as follows. In section two, the study provides a more detailed introduction to the EU ETS. The theoretical foundation for the paper is articulated in section three by introducing the Induced Innovation and Porter Hypotheses. Based on this, the paper develops a conceptual framework to infer relevant research hypotheses. In section four, the sample and regression models used to analyze the hypotheses are delineated. Section five comprises the description of the results accompanied by robustness checks. In section six, the results are thoroughly discussed to deduce relevant theoretical and political implications as well as limitations and future research opportunities. Finally, section seven concludes the thesis with a comprised summary of the advancements found.
3 The road transport sector is among the highest emitting sectors not regulated by the EU ETS, which has sparked
discussion on whether it should be regulated by the policy as well (Nader & Reichert, 2015).
4 China, the country with highest CO
2 emissions worldwide, is currently testing a regional ETS in the Shenzhen
2.
T
HEE
UROPEANU
NIONE
MISSIONST
RADINGS
YSTEMThis section introduces the EU ETS and two of its mechanisms, namely the cap-and-trade design and the sequential implementation structure. The EU ETS is a sophisticated EU directive, and providing a detailed description of the policy extends the scope of the thesis5. Nevertheless, the two mechanisms outlined above are of particular importance for the research hypotheses developed in section three. Thus, this section firstly explains the underlying economic theory of the EU ETS by unveiling the mechanisms of cap-and-trade systems. Secondly, the four phases of policy implementation are briefly summarized.
2.1. Design: market-based pollution control via a cap-and-trade system
The EU ETS is designed as a cap-and-trade system to “effectively reduce GHG emissions while producing the least overall costs to participants and the economy as a whole” (European Commission, 2015, p. 5). The theoretical foundation of cap-and-trade systems was introduced by Coase (1960), who argued that by making property rights explicit and transferable, the market instead of the government can ensure that these rights are valued adequately and brought to their best use. Crocker (1968) was the first to apply the Coase Theorem in the field of air pollution control. Here, the government sets a cap on the overall level of emissions allowed for a specific timeframe. Then, permits, which are allowances to emit a certain amount of pollutant, are allocated based on historical emissions, a procedure called “grandfathering” (Clò, 2010), or are auctioned off to participants.
One specific advantage of a cap-and-trade system when compared to a command-and-control system is that, in theory, it stimulates eco-innovation. In a command-and-command-and-control system, which regulates pollution, e.g., via taxation, introducing eco-innovations that yield emissions below the required level does not offer any additional benefit to the innovator. That is because there is no reward for exceeding the regulated pollution standard (Popp, 2003). In contrast, in a cap-and-trade system, innovations that lead to lower emissions reduce the financial burden of the polluter because fewer pollution permits must be purchased (Tietenberg, 2010). The innovator will continue to innovate until (marginal) abatement costs equal the (marginal) benefit of pollution (Coase, 1960; Crocker, 1968). Because (marginal) abatement
5 See Ellerman, Convery, and de Perthuis (2010) for a comprehensive assessment of the design and
costs differ between firms, permits are traded until an efficient equilibrium is reached (Crocker, 1968; Montgomery, 1972). On a firm-level, this provides participants with a degree of flexibility not given under command-and-control systems because they can either innovate to reduce the number of permits required or purchase additional allowances. The decision depends on the individual participant’s innovation capabilities and its (marginal) abatement costs. Consequently, the price of permits, which is a function of its demand and supply, plays a vital role in this bilateral decision.
The supply of permits is, amongst others6, influenced by the use of offsets and the initial allocation of allowances. Offsets are permits from other sources than that specific cap-and-trade system. In the EU ETS, Emission Reduction Units (ERU) from Joint Implementation Projects and Certified Emission Reductions (CER) from Clean Development Mechanisms, as defined in the Kyoto Protocol (United Nations, 1998), can be used as offsets (European Commission, 2015). In theory, the use of offsets allows emission mitigation to be done at least cost because firms that operate in different geographical locations can decide where to abate (Tietenberg, 2010). However, offsets also yield to an influx of permit supply (Perman, Ma, McGilvray, & Common, 2008), which lowers its price. A low permit price provides fewer incentives for eco-innovation because the option to purchase allowances becomes financially more attractive. Furthermore, opposing the assumptions of the Coase Theorem, the initial allocation of allowances must be considered (Abrell, Zachmann, & Ndoye, 2011). One reason why free allocations matter is carbon leakage. Carbon leakage describes the situation that occurs if businesses transfer production to other countries with less stringent emission constraints (Babiker, 2005; European Commission, 2015). The potential for carbon leakage is considered as one of the main threats to the investment stimulus that is induced by carbon pricing (European Commission, 2004). To counteract carbon leakage, the EU exempts certain sectors from the system or allocates free permits to firms (European Commission, 2015). Nevertheless, freely awarded permits reduce the (marginal) abatement cost of firms because neither do they have to purchase allowances, nor are they incentivized to abate (Hahn & Stavins, 2011). Thus, free allocation in a cap-and-trade system bears the danger of creating windfall profits (Sijm, Neuhoff, & Chen, 2006). The use of offsets and the initial allocation of allowances had a particular influence on the design and adjustments in the different phases of the EU ETS (Ellerman, Convery, & De Perthuis, 2010), which are introduced below.
6 See Joltreau and Sommerfeld (2019) for a summary of factors that impact the supply and demand of allowances
Table 1. Implementation phases of the EU ETS Phase 1 (2005-2007) Phase 2 (2008-2012) Phase 3 (2013-2020) Phase 4 (2021-2030)
Geography EU27 Same as phase 1
and: Norway Iceland Lichtenstein Same as phase 2 and: Croatia Same as phase 3 Regulated installation types Power stations and combustion plants with thermal input of ≥ 20 MW p.a. Oil refineries Coke ovens Iron and steel plants with production capacity of > 2.5 t per hour Cement clinker Glass with melt-ing capacity of > 20 t per day Lime
Bricks Pulp
Paper and board
Same as phase 1 and: Aviation (from 2012) Same as phase 2 and: Aluminum Petrochemicals Ammonia Nitric, adipic, and glyoxylic acid production CO2 capture, transport in pipelines, and geological storage of CO2 Same as phase 3 GHGs CO2 CO2, N2O (via opt-in) CO2, N2O, PFC (perfluorocarbon) Same as phase 3 Cap 2,058 mtCO2 1,859 mtCO2 2,084 mtCO2
in 2013, decreasing linearly by 1.74% per year 1,858 mtCO2 in 2018, decreasing linearly by 2.20% per year Trading units
EUAs EUAs, CERs,
ERUs
All units must be converted into EUAs first
Same as phase 3
Non-com-pliance fine
€40 per tCO2 €100 per tCO2 Same as phase 2 Same as phase 3
2.2. Implementation: increasing the stringency of the EU ETS via four phases
The EU ETS is divided into four implementation phases to leave sufficient room for policy adjustments and gradually increase the regulatory stringency (European Commission, 2004, 2015). Table 1 summarizes the regulation criteria for each phase. One must note that regulation happens at the installation, not the firm level. This detail of the EU ETS allows to compare firms with similar characteristics but different regulatory status with each other. For example, one can consider the hypothetical case in which two firms (firm A and firm B) each emit a similar amount of CO2 and require 50 MW thermal input per annum to operate their power
stations. However, firm A possesses only one large power station,while Firm B possesses five power stations. Firm A qualifies for the EU ETS because its installation with a thermal input of 50 MW exceeds the regulatory limit of 20 MW per annum. In contrast, firm B is not regulated because each of the five power stations requires a thermal input of 10 MW, which is below the threshold. In the example, firm A, the account holder of a regulated installation, must submit an annual emission report validating that it holds enough permits for its emission output. To present a balance, firm A can reduce emissions or acquire additional permits from other firms directly or from the auction market. In the following, the regulatory specifics of the four implementation phases are summarized based on the elaboration provided by the European Commission (2015).
The first phase of the EU ETS lasted from 2005-2007 and was established as a pilot phase to test price formation and develop the required regulatory framework for the carbon market. In 2005, more than 12,000 power stations and other industrial installations were categorized according to their primary activity, such as cement, paper and pulp, or coke ovens and received a regulatory status. The account balances of all individual account holders in a country were documented in National Allocation Plans (NAPs). These were used to set the overall emission cap to 2,058 million tCO2 per year in the first phase. Account-holders who
failed to provide a balance for emissions and permits were obliged to pay a penalty of €40 per tCO2. As elaborated on above, EUAs were allocated freely in phase one to prevent carbon
leakage. Nevertheless, offset units could not yet be used. The first phase further clarified unanswered regulatory questions. For example, at the end of the phase, it was communicated that banking of permits from phase one was not allowed and that a progressively decreasing cap would be introduced in phase three.
The second phase of the EU ETS lasted from 2008-2012, which was the first commitment period of the Kyoto Protocol. Here, the cap decreased to 1,859 million tCO2 per
year. Still, 90% of EUAs were allocated freely, but CERs and ERUs could be submitted in addition to EUAs. Moreover, Norway, Iceland, and Lichtenstein joined the EU ETS, and since 2012 also aviation operators must present allowance balances. Besides, the penalty for surrendering emissions without permits was increased to €100 per tCO2. Furthermore, at the
end of phase two, it was decided to move from NAPs to National Implementation Measures (NIPs) to harmonize the administrative processes of permit surrendering among member states.
The third phase began in 2013 and will last until 2020. One significant adjustment comprised the reduction of free allocations, shifting the core of the system towards permit auctioning. In phase three, auctions are expected to make up 50% of allowances allocated (Wråke, Burtraw, Löfgren, & Zetterberg, 2012). Furthermore, a decreasing cap of -1.74% annual linear reduction (equivalent to 38 megatons of CO2) entered force. In addition to that, Croatia joined the EU ETS, and policymakers introduced installation caps for N2O as well as
perfluorocarbon from aluminum production. The EU also launched a best-practice fund, called NER3000, to showcase environmentally safe carbon capture and innovative renewable energy technologies. In 2018, the EU agreed upon a fourth implementation phase, lasting from 2021 until 2028 (European Parliament & European Council, 2018). The primary modification will entail a further reduction of the emission cap. The rate of linear decline is set to change from -1.74% to -2.20%. Besides, the EU will explore options to link the EU ETS to other carbon trading systems (e.g., Switzerland and Australia).
3.
T
HEORETICALF
RAMEWORKBased on the brief introduction to the EU ETS, this section lays the theoretical foundation for the thesis and derives research hypotheses. Firstly, the Induced Innovation Hypothesis and the Porter Hypothesis are introduced. Secondly, empirical evidence for the hypotheses in the context of cap-and-trade systems and the EU ETS, specifically, is assessed to develop relevant research hypotheses.
3.1. Theoretical foundation: from Induced Innovation Hypothesis to Porter Hypothesis
The thesis draws from two economic hypotheses, the Induced Innovation Hypothesis and the Porter Hypothesis. In the early 20th century, John Hicks (1932) proposed an economic theory, labeled the Induced Invention (Innovation) Hypothesis. According to Hicks (1932), increasing real wages induce innovations that cut labor costs and thereby foster operational cost-effectiveness. If, ceteris paribus, the price of a factor of production increases sharply relative to the price of others, firms will innovate by developing technologies that economize on that factor of production. Induced innovation, akin to the role of innovation in general, is a critical determinant of technological change, which in turn is a decisive factor for economic growth considering the Schumpeterian school of thought (Ruttan, 1959, 1997; Scherer, 1986). Even though widely accepted, the Induced Innovation Hypothesis was criticized for relying on exogenous changes in the economic environment. It has thus been replaced by theories that focus on endogenous factors, e.g., path dependency, as the primary driver for innovation and technological change (Ruttan, 1997).
Nevertheless, Porter (1991) and Porter and Van der Linde (1995), pick up Hicks’ (1932) focus on exogenous factors and argue that environmental regulation can spur (eco-)innovation. In what is today known as the Porter Hypothesis, the authors state that well-designed, strict environmental regulations induce innovation, which in turn can result in a better competitive performance of firms. Following Porter and Van der Linde (1995), pollution is considered a waste of resources, and a reduction in emissions can lead to an improvement in productivity. Hence, regulation can “trigger innovation that may partially or more than fully offset the costs of complying with them” (Porter & Van der Linde, 1995, p. 98). The Porter Hypothesis can be classified into three forms (Jaffe & Palmer, 1997). Firstly, the “weak” Porter Hypothesis assumes a positive impact of environmental regulation on innovation. Secondly, the “strong” Porter Hypothesis expands the weak Porter Hypothesis by adding a positive influence of
policy-induced innovation on competitive performance. Thirdly, the “narrow” Porter Hypothesis considers that flexible regulations give firms more significant incentives than prescriptive forms of regulation. Akin to the Induced Innovation Hypothesis, the Porter Hypothesis has received some criticism. The major neo-classical argument against the Porter Hypothesis is that it is incompatible with the assumption that firms aim at maximizing profits. Palmer, Oates, and Portney (1995) state that the cases brought forward are exemptions and offsets are minuscule relative to control costs. Nevertheless, empirical assessment of the Porter Hypothesis from past decades has partly rescinded this argument, as an examination of the existing evidence on the different specifications of the Porter Hypothesis elucidates.
3.2. Literature review and hypotheses: the EU ETS and eco-innovation
In general, empirical evidence supports the Porter Hypothesis. In an environmental context, Goulder and Schneider (1999), Van Der Zwaan et al. (2002), Popp (2004), Gerlagh (2008), and Acemoglu et al. (2012) find evidence for an increased level of innovation induced by the increase of relative price factors. Explicitly investigating the weak Porter Hypothesis, Lanjouw and Mody (1996), Brunnermeier and Cohen (2003), Popp (2006), Johnstone, Haščič, and Popp (2010), Lanoie et al. (2011), and Lee, Veloso, and Hounshell, (2011), find that environmental policies positively influence innovation. In contrast, evidence for the strong Porter Hypothesis is incongruent. Cohen and Tubb (2018) review 103 studies on the impact of environmental regulation on business performance and find that approximately half of the studies report a significant positive effect, while the other half fails to detect significant results. The authors further specify that most studies focus on the national or industry-level as the subject of interest, not the firm-level. Considering the narrow Porter Hypothesis, existing evidence is also inconsistent (Ambec et al., 2013). One difficulty acknowledged in the research field on the narrow Porter Hypothesis is the requirement to either develop complex counterfactual scenarios or compare different policies with each other (Ambec et al., 2013). That limits both supporting (e.g., Burtraw, 2000) and opposing findings (e.g., Driesen, 2005; Lanoie et al., 2011) on the narrow Porter Hypothesis (Lanoie et al., 2011; Ambec et al., 2013). As a consequence, the thesis considers only the weak and strong Porter Hypothesis.
Albeit the evidence above suggests that the (weak) Porter Hypothesis holds in general, previous research has not yet comprehensively validated the Porter Hypothesis in the context of cap-and-trade systems (Tietenberg, 2010). The next sections summarize, for both weak and strong Porter Hypotheses, the empirical evidence from existing cap-and-trade systems, the
theoretical arguments for the validity of the hypothesis in the EU ETS, and empirical evidence from the first implementation phase to develop four research hypotheses.
3.2.1. The EU ETS and the weak Porter Hypothesis
Evidence for the weak Porter Hypothesis in existing cap-and-trade systems, other than the EU ETS, is limited. The most scrutinized cap-and-trade systems are the US endeavors to reduce sulfur dioxide emissions, which were introduced with the Clean Air Act in 1990 and continued with the Acid Rain Program in 1995 (Calel & Dechezleprêtre, 2016). However, evidence for an innovation-inducing effect of these environmental regulations is low. Popp (2003) investigates whether a command-and-control policy, as it was in place before 1990, or a cap-and-trade system, which was introduced in 1990, spurred more patent applications. The author finds that, contrary to the Porter Hypothesis, patent counts in the command-and-control period were higher than under the more flexible cap-and-trade system. However, Popp (2003) shows that the introduction of the cap-and-trade system led to more patent applications that regard environmental innovations compared to the command-and-control period. Nevertheless, the phenomenon remained to be a one-time event rather than a consistent pattern induced by the regulation (Lange & Bellas, 2005; Taylor, Rubin, & Hounshell, 2005).
One explanation for the lack of evidence from the US is the increased use of fuel switching strategies (Schmalensee, Joskow, Ellerman, Montero, & Bailey, 1998; Gagelmann & Frondel, 2005; Calel & Dechezleprêtre, 2016). Fuel switching considers the strategic decision to bring less polluting gas-fired plants online before coal-fired plants when power demand increases, which changes the fuel mix in favor of less carbon-intensive natural gases (Gagelmann & Frondel, 2005; Calel & Dechezleprêtre, 2016). This strategy does neither require research and development (R&D) nor capital investment to reach emission targets and therefore provides a cheap alternative to innovation. In the US case, fuel switching is considered to be responsible for nearly half the emission reductions achieved (Schmalensee et al., 1998). The US policy design allowed participants to apply fuel switching strategies and thus reduced incentives to innovate, leading to the conclusion that the weak Porter Hypothesis did not hold in in the US case.
Comparing the design of the US policy with the EU ETS, economic theory suggests that the EU ETS can induce eco-innovation, which gives reason to believe that the weak Porter Hypothesis holds. From a theoretical standpoint, the EU ETS can be rated as a strict but flexible policy, which is a critical underlying assumption of the Porter Hypothesis. The EU ETS fulfills
the three principles proposed by Porter and Van der Linde (1995): providing flexibility, fostering continuous improvement, and providing regulatory certainty. Regarding the first two principles, the EU ETS offers room for innovation and fosters continuous improvement through its cap-and-trade design. As outlined above, a cap-and-trade system allows for market-based pollution control and provides incentives to innovate further than under command-and-control policies. That is, as long as marginal abatement costs differ between firms, participants in the system can economically decide whether to abate emissions or purchase permits (Coase, 1960; Crocker, 1968; Montgomery, 1972). Since the cap is set and decreasing in the EU ETS, the latter option will become more costly, incentivizing firms to innovate (Porter & Van der Linde, 1995; Mohr, 2002; Ambec et al., 2013). Furthermore, the cap-and-trade system leaves the technology decision to the participants in the EU ETS, thus fostering continuous improvement rather than locking into one specific technology (Tietenberg, 2010).
Regarding the third principle, the EU ETS provides participants with security about the implementation scope and timing, which is the main differentiator compared to the US systems. Since the introduction of the policy, the EU has communicated that the ETS is and will be its main instrument to tackle climate change, ultimately regulating installations in all member states and adjacent countries willing to opt-in (European Commission, 2015). That gives participants security in two ways. Firstly, it ensures that there is only one market for emission trading, in which regulated firms from all over Europe can trade. That is important, because in the US case, the trading systems remained regional initiatives, providing little incentives for (inter-) national players to adjust the entirety of their business operations to the policies (Borghesi & Montini, 2016). Secondly, the EU communicated that the level of stringency increases over time, which further reduces uncertainty and makes short-term strategies such as fuel switching not viable. Early evidence from the EU ETS implies that a majority of the emission reductions in the period from 2005-2007 stem from fuel switching strategies (Delarue, Ellerman, & D’haeseleer, 2010; Koch, Fuss, Grosjean, & Edenhofer, 2014). However, contrary to the US case, fuel switching strategies in the EU ETS are not sustainable in the long-term. Delarue, Voorspools, and D’haeseleer (2008) estimate that fuel switching can achieve a maximum reduction of 300 million tCO2 annually. That is approximately 10% of the cuts
required to achieve the EU 2050 goals of 80%-95% emission reduction compared to 1990 (European Commission, 2018). Since companies can anticipate that fuel switching strategies are not economically sustainable, they are expected to engage in activities that ensure the long-term reduction of emission costs such as eco-innovation. Although certainty in the EU ETS is higher arguably than it was in the US case, the EU ETS pilot phase was subject to regulatory
adjustments (European Commission, 2015). That could, in theory, delay the policy impact (see section 3.2.2.).
Empirical evidence from the first phase of the EU ETS further indicates that the policy has induced eco-innovation. Qualitative studies show that managers in the EU expect the stringency of the EU ETS to increase and intend to make adequate investments (Martin, Muûls, & Wagner, 2012); Irish EU ETS firms pursue operational innovations like investing into the development of new machinery (Anderson et al., 2011); and German experts in the power sector expect the direction of technological change to shift towards more sustainable methods of power generation (Rogge, Schneider, & Hoffmann, 2011). Although the evidence is only indicative, and quantitative country-specific studies fail to report a significant impact of the EU ETS on eco-innovation (Löfgren et al., 2013; Borghesi, Cainelli, & Mazzanti, 2015), Calel and Dechezleprêtre (2016) find that the EU ETS had a substantial impact on the patenting behavior of regulated firms. They show that EU ETS was responsible for a 36.2% increase in low-carbon patent applications when comparing the patent output of EU ETS firms and non-EU ETS firms. In contrast to other studies, Calel and Dechezleprêtre (2016) follow a robust methodological approach, which is essential for three reasons. Firstly, the study does not fall short to the limitation of an unrepresentative sample size. The authors include firms from all over Europe, and thus, their sample is more representative than that of country or sector studies (Joltreau & Sommerfeld, 2019). Secondly, they estimate the impact of the EU ETS on regulated firms by matching each EU ETS firm to a similar non-regulated firm based on observable company characteristics. In doing so, the authors elude the impact of sector-level shocks on innovation output that was unrelated to the EU ETS. Thirdly, Calel and Dechezleprêtre (2016) use patent counts as a measure for innovativeness. Patents are considered the most robust measure of innovation activity because they are quantitative, output-oriented, and can be disaggregated (Acs & Audretsch, 1989; Johnstone, Haščič, & Kalamova, 2010; Haščič & Migotto, 2015). Consequently, their study is considered the most comprehensive in the literature on innovation in the EU ETS (Marcantonini et al., 2017; Joltreau & Sommerfeld, 2019).
Considering the more stringent and far-reaching policy design of the EU ETS, the underlying innovation-inducing mechanism of a cap-and-trade system and the aforementioned empirical findings from the first phase of the EU ETS, the following hypothesis is postulated:
3.2.2. The role of increasing stringency and certainty in the EU ETS
The Porter Hypothesis states that the degree of stringency in the outline of the policy is influencing participants’ incentivizes to innovate. Porter and Van der Linde (1995) suggest that an effective policy is stringent enough to affect the cost of emitting significantly. However, assessing the stringency level of policies provides a methodological challenge because there is little agreement on objective comparison criteria (Johnstone, Haščič, & Kalamova, 2010; Botta & Koźluk, 2014). Yet, in the case of the EU ETS, Joltreau and Sommerfeld (2019) suggest that the emission reduction target and the penalty fees for non-compliance are appropriate stringency estimates. Firstly, considering the emission target, the second phase of the EU ETS introduced a more stringent emission cap compared to phase one. That makes intuitive sense because the first phase was intended to function as a pilot phase. Studies that do not find an innovation-inducing effect of the EU ETS in the first implementation phase consider the rather low emission cap as one possible explanation (Anger & Oberndorfer, 2008; Rogge et al., 2011; Joltreau & Sommerfeld, 2019). For phase two, the overall cap was reduced by approximately 10% (see Table 1), which makes it more stringent than phase one. Secondly, the fines for non-compliance were increased significantly in phase two. The penalty charge for each tCO2 rose
from €40 to €100.
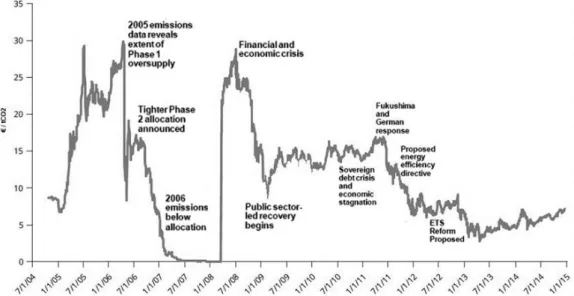
Figure 1. Price development of EUAs between 2004 and 2015. Reprinted from “The best (and
worst) of GHG Emission Trading Schemes: Comparing the EU ETS with its followers” by S. Borghesi and M. Montini, 2016, Frontiers in Energy Research, 4(83), 27.
Furthermore, the price of EUAs indicates that phase one entailed a high level of uncertainty regarding the future administration of the policy. Figure 1 depicts the daily rates of
EUAs from 2005-2015. One can see that the prices of the first-phase EUAs were highly volatile. Marin et al. (2018) suggest that a major factor of influence was uncertainty about whether allowances from the first phase could be banked for the second phase. The latter was not the case, which is why the EUA price dropped to €0 in 2007. Also, the decreasing cap for the third phase was only communicated at the start of the second phase (European Commission, 2015). The enhanced certainty could have motivated regulated companies to reduce their emissions with a long-term focus, which ultimately encourages eco-innovation.
With a more stringent design and more certainty, one can expect that the second phase of the EU ETS increased the eco-innovativeness of regulated firms more than the first phase. Thus, the study postulates hypothesis two as follows:
H2: The second phase of the EU ETS increased the eco-innovativeness of regulated firms
more than the first phase of the EU ETS.
3.2.3. The EU ETS and the strong Porter Hypothesis
There is little evidence on firm-level performance indicators from the US cap-and-trade systems. One reason is that the specification of the different Porter Hypothesis forms followed only after the programs’ enacting. While the weak Porter Hypothesis has received considerable coverage in academic literature, the debate on the strong Porter Hypothesis has only recently shifted towards assessing cap-and-trade systems in detail (Ellerman et al., 2010). However, the few existing ex-post analyses of the US cap-and-trade systems do not support the strong Porter Hypothesis. For instance, Popp (2003) finds that the introduction of the Clean Air Act of 1990 increased the costs for firms without affecting revenues. Although there appears to be no evidence for the strong Porter Hypothesis, it must be considered that the outline of the EU policy differs significantly from the US policy design.
Comparing the EU ETS to the US policy, the more far-reaching implementation scope suggests that the strong Porter Hypothesis holds in the EU ETS. Porter and Van der Linde (1995) argue that innovation leads to enhanced firm performance via two mechanisms. Firstly, eco-innovation can offset the costs of regulation by efficiency gains. That is, if firms use new equipment that requires fewer resources, they can produce the same output with lower input costs. However, the authors admit that the productivity gains “cannot always completely offset
the cost of compliance, especially in the short term before learning can reduce the cost of innovation-based solutions” (Porter & Van der Linde, 1995, p. 100).
Secondly, firms can alter their financial performance by either selling eco-innovations to other players in the market or passing through the costs of investing in new eco-innovations to customers, resulting in windfall profits. The US policy was limited in terms of geographical implementation scope, possibly reducing the revenue potential from selling newly developed technologies directly (Popp, 2003; Ellerman et al., 2010). In contrast, companies in the EU ETS have access to a bigger market, providing them with a stronger business case since eco-innovations can become a new source of revenue (Bocken, Farracho, Bosworth, & Kemp, 2014). Furthermore, EU ETS firms might pass through additional regulatory costs to customers by raising prices. Cost pass-through occurs if firms change the prices of their products due to an increase in the expenses that arise during the production process. Most of the regulated sectors in the EU ETS consider the manufacture of mineral products and the production of utilities (European Commission, 2015). In these sectors, price elasticity has historically been low, which makes cost pass-through to customers likely (Joltreau & Sommerfeld, 2019). In combination with the free allocation of EUAs, this presents a profit opportunity for firms (Sijm et al., 2006). For example, one can consider the case in which a company, which operates differently sized power stations, becomes regulated, and receives a certain number of EUAs via grandfathering. The increase in marginal costs is added to its energy bids since it is considered an opportunity cost for the company (Sijm et al., 2006). If energy prices are high and demand decreases, the company can switch from expensive to cheaper power stations, decreasing their real marginal costs. However, price bids do not fall, offering the potential for windfall profits. Sijm et al. (2006) estimate that, at a CO2 price of €20 per tCO2, policy-induced
profits range from €3-5 per MWh. Thus, considering potential new revenue streams as well as potential windfall profits, regulated companies can be expected to perform better financially.
Empirical research indicates that the introduction of the EU ETS enhanced financial performance. Multiple researchers find no effect of the EU ETS on firm performance. Anger and Oberndorfer (2008) investigate a German sample of regulated firms and discover no policy impact on neither revenues nor employment. The results are confirmed by Petrick and Wagner (2014), who find no statistically significant effect of the EU ETS on employment, turnover, profits, or exports in Germany. One issue with the findings above is that other stringent national environmental policies have been introduced even before the EU ETS. In Germany, the Renewable Energy Act entered into force in 2000 (Bundesministerium für Wirtschaft und
Energie, 2019), which set the target of doubling the share of renewable energies in electricity consumption in Germany by 2010. Nevertheless, also in Lithuania, the EU ETS has not impacted the profitability of regulated firms (Jaraite & Di Maria, 2016).
In contrast, other country studies find a significant positive impact of the EU ETS on business performance indicators. Examining a Norwegian sample of regulated plants, Klemetsen, Rosendahl, and Jakobsen (2016) find that the policy had positive effects on value-added and productivity. According to the authors, one reason were the massive amounts of free allowances and that firms could pass on marginal costs to customers. Furthermore, Calligaris, Arcangelo, and Pavan (2019) find a positive policy impact on total factor productivity. However, the findings above fail to provide comprehensive insights into the overall EU impact of the EU ETS on economic performance.
Research that focuses on firms from multiple EU countries finds evidence for a positive effect of the EU ETS on firm performance indicators. Dechezleprêtre et al. (2018) investigate a sample of 1,728 ETS firms and find a positive impact on fixed assets and revenues. The former increased by 17%, while the latter increased by 8%, indicating that the EU ETS firms reacted to the policy by EU ETS by adopting costly emissions-reduction technologies while they were further able to increase their revenues. Also, Chan, Li, and Zhang (2013) empirically investigate the impact of the EU ETS on material costs, employment, and revenues in the European power, cement, iron, and steel sectors. Their results reveal positive effects on material costs and revenues in the power sector. They demonstrate that the impact on material costs stems from additional costs to comply with emission constraints while the effect on revenue bears upon cost pass-through to consumers. Furthermore, Marin, Marino, and Pellegrin (2018) confirm a positive influence of the EU ETS on multiple measures of economic performance at the firm level. They report that the EU ETS increased employment among regulated firms by 8%, investment by 26%, turnover by 15%, and value-added by 6%. Their insights illustrate that the EU ETS, while driving up sales, increased material and other variable costs, indicating that cost pass-through happened, which led to windfall profits. Summarizing, the evidence suggests a positive impact of the EU ETS on business performance indicators.
Conjointly, theory and empirical findings suggest that the EU ETS had a positive impact on a firm’s performance. In particular, the financial performance of regulated firms can be expected to increase. Thus, the thesis postulates hypothesis three as follows:
The underlying argument of the strong Porter Hypothesis is that innovation mediates the relationship between environmental policy and increased firm performance. Mohr (2002) elaborates on this causal chain. He suggests that environmental regulations can induce companies to become a first-mover in developing and investing in new environmental technology, which then increases business performance. That occurs since the productivity of a firm in using a specific type of technology depends on the market participants’ use of it. Even if a certain technology used can be considered as “old”, it can still be reasonably productive due to collective learning. Thus, companies become hesitant to invest in research and development of new technologies because they want to avoid incurring the learning costs for other players. That implies that it is profitable for a firm to wait until other firms innovate and then benefit from their experience. Nevertheless, environmental regulation can overcome this market failure (Porter & Van der Linde, 1995). Reducing the burden of becoming a first-mover regarding both development and investment in new technologies, creates an incentive to innovate (Mohr, 2002). As first-movers, companies can sell their innovations to other firms, enhancing their financial performance (Bocken et al., 2014).
Following this line of argumentation, one can expect that eco-innovation mediates the potential positive impact of the EU ETS on financial performance. Thus, the paper postulates hypothesis four as follows:
H4: The eco-innovativeness of regulated firms mediates the relationship between the introduction of the EU ETS and enhanced financial performance.
In summary, a gap in the literature on the Porter Hypothesis exists. Its validity in cap-and-trade systems has not yet been comprehensively assessed since evidence from both US and EU ETS is contradicting. The design of the EU ETS, however, suggests that one can expect innovation and financial performance of regulated firms to increase. By incentivizing participants to eco-innovate, they can increase efficiency and derive new streams of revenue. Especially implementation phase two is expected to spur eco-innovation due to an enhanced level of regulatory stringency and certainty.
4.
M
ETHODOLOGYThis section aims at delivering insight into the empirical design chosen to answer the previously developed hypotheses. The section firstly describes the construction of the sample. Since the thesis applies a quasi-experimental study design, it explains the matching procedure in detail. Secondly, the paper elaborates on the empirical specification by describing regression models, variables, and the estimation approach.
4.1. Data description
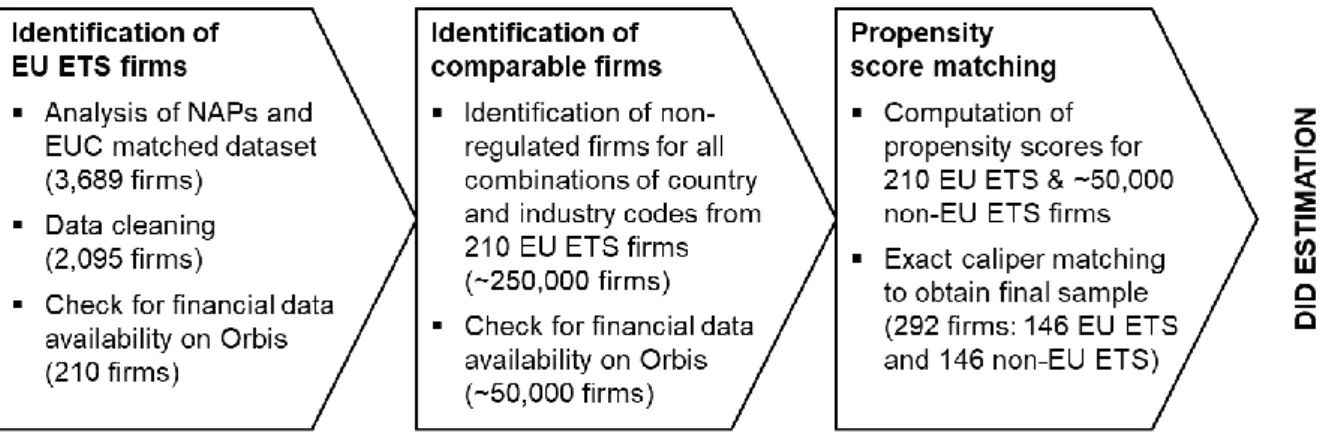
In the EU ETS, regulation occurs at the installation level, which allows comparing account holders of regulated installations with account holders of non-regulated installations based on similar firm characteristics. Nevertheless, identifying regulated companies and appropriate non-regulated counterparts provides a challenge due to the lack of harmonization and data availability in the first phases of the EU ETS (Jaraité, Jong, Kažukauskas, Zaklan, & Zeitlberger, 2014). The following paragraphs elaborate on the identification strategy applied, which is also depicted in Figure 2.
Figure 2. Identification strategy to obtain sample
4.1.1. Identification of regulated companies in the EU ETS
The European Commission (2012) publishes the NAPs and, since 2013, NIPs for each year and each participating country in the EU ETS. That permits identifying account holders of regulated installations. The entries of the NAPs are, however, not harmonized, which makes matching firms to account holders difficult (Jaraité et al., 2014). For example, names of account holders are reported in national languages, and the ownership structure of internationally acting companies is not considered. Nevertheless, researchers who investigate the EU ETS have made
matched datasets available. The data set of the European University Center (EUC) developed by Jaraité et al. (2014) forms the base for the thesis. The authors attempt to match the entries of 8,466 account holders at the end of the second implementation phase with firm data from Bureau van Dijk’s Orbis database and identify 3,689 regulated companies. The study only considers companies that were regulated in both phases one and two of the EU ETS to investigate the differential policy effect of the implementation phases. Thus, companies from countries that entered the EU ETS in the first phase but after 2005 (i.e. Bulgaria, Romania, Croatia) and non-EU countries that joined in the second phase are excluded (i.e. Norway, Liechtenstein, Iceland), reducing the sample to 2,095 firms.
Since the thesis makes use of PSM (see section 4.2.2.), restrictions regarding the availability of firm data further reduce the sample size. Matching in PSM should occur based on variables before treatment (Caliendo & Kopeinig, 2008). The EU ETS became active in 2005, which is why the thesis only considers regulated companies with firm data entries that go back until 2004. This reduces the sample size of regulated firms to 412 companies. Of the 412 firms, approximately half provide sufficient information concerning the matching criteria. Thus, 210 regulated companies enter the sample used for the following PSM. For these companies, Orbis firm and financial data, as well as patent data from PATSTAT, the European Patent Office’s (EPO) worldwide patent database, is retrieved.
4.1.2. Identification of comparable non-regulated companies and matching via PSM
PSM is a statistical matching technique that is frequently used in observational studies to control for treatment selection bias and thus mimic randomized allocation (Rosenbaum & Rubin, 1983; Caliendo & Kopeinig, 2008). In PSM, the probability of assignment to treatment (regulation), conditional on pre-intervention variables, is condensed to a single score: the propensity score (Rosenbaum & Rubin, 1983). The PSM algorithm allocates one non-treated individual (non-regulated firm) to each treated individual (regulated firm) based on the similarity of their propensity scores, forming a statistically similar pair. In theory, this allows estimating the average treatment effect on the treated (ATT), which is the difference between expected outcome values for treated compared to non-treated individuals. Assessing the ATT implies that all factors that influence the probability of an individual to be treated are observable (Caliendo & Kopeinig, 2008). That is, however, problematic in the case of the EU ETS because the level of regulation and the level of analysis differ (Calel & Dechezleprêtre, 2016; Jaraite & Di Maria, 2016; Marin et al., 2018). As described in section 2.2., for an individual installation of a particular size (in terms of capacity), any other plant of the same
size should be regulated as well. Nevertheless, if the unit of analysis is the firm, then there might be the case in which one firm owns regulated installations, and a firm of comparable size does not own regulated installations. To account for unobservable but temporally invariant differences in outcomes, the study combines PSM with a DID estimation, as proposed by Abadie (2005). That is, the sample is constructed using PSM and, subsequently, assessed through a DID estimation. To build the sample, companies are matched on a set of covariates following the guideline of Caliendo and Kopeinig (2008).
The selection of appropriate covariates is case-specific, and little consensus regarding the applicable threshold for a minimum number of covariates exists (Caliendo & Kopeinig, 2008). Therefore, the thesis follows approaches taken by comparable matching efforts in the setting of the EU ETS (e.g., Calel & Dechezleprêtre, 2016; Jaraite & Di Maria, 2016; Dechezleprêtre et al., 2018; Marin et al., 2018). The propensity scores are determined based on fixed assets and turnover in the pre-treatment year 2004. Fixed asset size is the most used matching determinant in EU ETS research since it proxies the installation capacity, although at an aggregated level (Joltreau & Sommerfeld, 2019). Turnover is further used to assess firms with a comparable level of gross income. Thereby, the study compares companies that are in a similar financial situation and have comparable resources available to innovate. To account for unobserved shocks that had a differential impact on countries and sectors, the matching procedure applied requires that each EU ETS firm is matched to a firm in the same country and the same industry. The sector matching criterium is the two-digit NACE Rev. 2 code as defined by the European Commission (2013).
Using the Stata package “psmatch2”, propensity scores for the 210 EU ETS and more than 50,000 firms from the same countries and industries are computed. Caliper matching is used to impose a maximum tolerance level on the propensity score distance. Caliper matching enforces the common support condition of PSM and thus provides better quality matches than other matching algorithms (Caliendo & Kopeinig, 2008). The caliper is set to 0.2, which is considered an optimal level for PSM in observational studies (Austin, 2011). Although caliper matching increases the quality of matches, it reduces the number of matches and thus increases the variance of the covariates (King & Nielsen, 2019). This becomes evident when applying the matching algorithm. The algorithm finds an appropriate match for only 146 of the 210 identified EU ETS companies. Investigating the excluded companies, the assessment shows that predominantly large companies are excluded. For instance, there is no other German company in the size of Siemens that operates in the same sector and is not regulated.
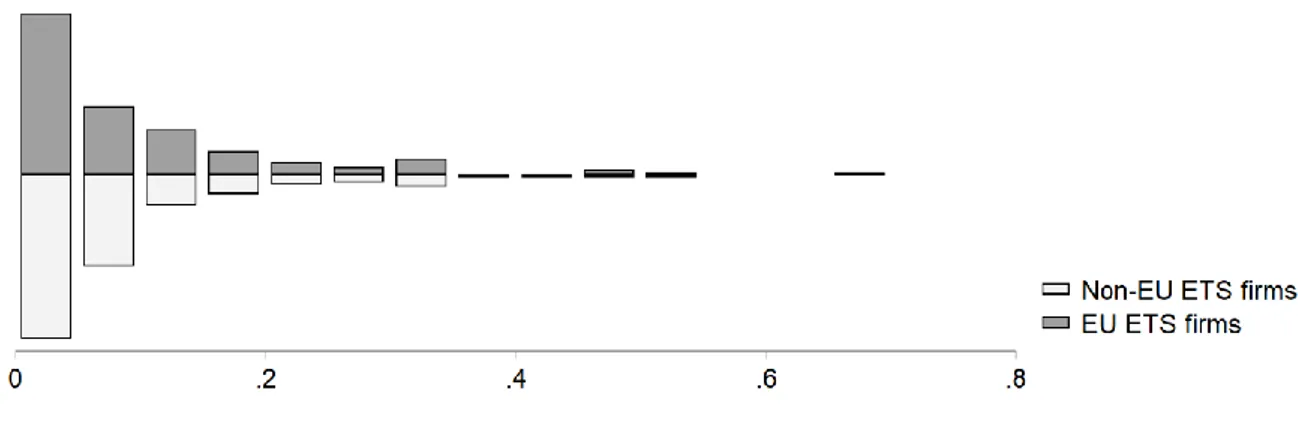
To assess the quality of the matches, Caliendo and Kopeinig (2008) suggest visual inspection of the propensity score distribution. Figure 3 displays the propensity score distribution of the 146 EU ETS and 146 non-EU ETS firms. The dispersion graph suggests that a sufficient level of overlap and common support are achieved. However, there are a few outliers on the right-hand side of the graph. To decide whether one can include the outliers, Caliendo and Kopeinig (2008) propose assessing the difference in means of the covariates between treated and non-treated individuals. The outcomes of a t-test suggest that there is no statistically significant difference between the means of fixed assets (t = .710, p = .476) and turnover (t = .610, p = .539) among the two groups. Furthermore, investigation of the standardized percentage bias shows that the sample is balanced. The standardized bias percentage is the percentage difference of the sample means in the treated and non-treated sub-samples, expressed as a percentage of the square root of the average of the sample variances in the treated and non-treated group bias (Rosenbaum & Rubin, 1985). For both fixed assets (8.3%) and turnover (7.2%), it is below the commonly used threshold of 10% (Zhang, Kim, Lonjon, & Zhu, 2019).
Consequently, 292 firms, 146 regulated and 146 unregulated firms, make up the dataset for the study. This represents a significant reduction from the 3,689 firms identified by Jaraité et al. (2014). Nevertheless, Dehejia and Wahba (1999) show that what is lost in sample size in PSM is regained in robustness and accuracy. Furthermore, researchers applying PSM in the setting of the EU ETS report sample size reduction of similar magnitude (see, e.g., Calel & Dechezleprêtre, 2016; Dechezleprêtre et al., 2018; Marin et al., 2018).
4.1.3. Composition and description of the final dataset
For the 292 companies, financial and patent data is retrieved for the time frame from 2000-2014. Patent data is retrieved from PATSTAT. The European Patent Office (2013) categorizes patents according to cooperative patent classification (CPC) codes, which classify the application area of the patent. The CPC entails a sub-category (Y02) of inventions that patent technologies or applications for the mitigation or adaptation against climate change. These are considered as a proxy for eco-innovations (Martin et al., 2012; Calel & Dechezleprêtre, 2016). The study contemplates only EPO-granted patents with an application date between 2000-2014. That is because patents take on average four years from application date to publication date in databases (OECD, 2009a), which makes 2014 the last reliable selection year. Furthermore, financial data for each firm is obtained. In addition to the covariates used for matching (i.e., fixed assets and turnover), data on firms’ R&D expenditure and return on assets (ROA) is retrieved from Orbis (see section 4.2.2. for reasoning). One limitation of combining the databases is the shortage of unique firm identifiers. Although Orbis offers a link to PATSTAT, it only provides entries for 169 of the 292 firms. For the remaining companies, string matching on company name and country is used to identify the number of eco-patents filed. In this effort, the entries reported in the Orbis patent database are cross-validated.
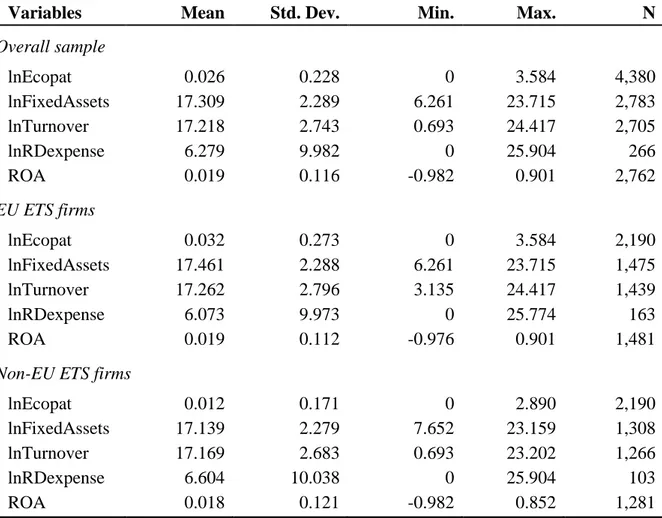
The final panel dataset comprises 4,380 observations, one for each year and each of the 292 firms. Countries from 19 of the EU27 countries are represented in the sample. Most companies in the dataset are from Spain (35%), followed by Poland (14%), and Germany (12%). For Austria, Greece, Hungary, Luxembourg, and Slovakia, respectively, only two companies are included in the sample. Regarding industries, the majority of companies are active in the sectors of manufacture of non-metallic mineral products (33%) and electricity, gas, and air conditioning supply (29%). Overall, the sample is representative of the actual installation allocation in the EU ETS considering country and industry dispersion (see, e.g., Calel & Dechezleprêtre, 2016). Only Spanish companies are overrepresented due to dataset construction. Appendix A reports the firm demographics of the sample. In the sample, only companies from Belgium, Germany, France, and Spain filed eco-patents in the period from 2000-2014. Although patent data is available for each year from 2000-2014, financial data entries are limited. Table 2 provides an overview of the number of observations for the eco-patent counts, fixed assets, turnover, R&D expenditures, and ROA in the panel. In addition to that, measures of central tendency (means), dispersion (standard deviations) as well as minimum and maximum values are displayed for the overall dataset, EU ETS firms, and non-EU ETS firms, respectively. The variables are presented in the form of natural logarithms duet
to skewness of raw data entries (see Appendix B). One must note that the number of observations varies for the variables. For fixed assets, turnover, and return on assets, approximately 60% of the panels have entries, while R&D expenditures data is available for only 6% of the panels.
Table 2. Adjusted descriptive statistics
Variables Mean Std. Dev. Min. Max. N
Overall sample lnEcopat 0.026 0.228 0 3.584 4,380 lnFixedAssets 17.309 2.289 6.261 23.715 2,783 lnTurnover 17.218 2.743 0.693 24.417 2,705 lnRDexpense 6.279 9.982 0 25.904 266 ROA 0.019 0.116 -0.982 0.901 2,762 EU ETS firms lnEcopat 0.032 0.273 0 3.584 2,190 lnFixedAssets 17.461 2.288 6.261 23.715 1,475 lnTurnover 17.262 2.796 3.135 24.417 1,439 lnRDexpense 6.073 9.973 0 25.774 163 ROA 0.019 0.112 -0.976 0.901 1,481
Non-EU ETS firms
lnEcopat 0.012 0.171 0 2.890 2,190
lnFixedAssets 17.139 2.279 7.652 23.159 1,308
lnTurnover 17.169 2.683 0.693 23.202 1,266
lnRDexpense 6.604 10.038 0 25.904 103
ROA 0.018 0.121 -0.982 0.852 1,281
Note. Natural logarithm is computed by lnX = ln(x+1) to account for zeros.
4.2. Empirical specification
The thesis formulates two general models to analyze the dataset regarding the weak and strong Porter Hypothesis. In the following, regression models are constructed, variables are described, and the approach followed to estimate the two models is laid out.
4.2.1. Regression models
The first general model assesses the weak Porter Hypothesis in the EU ETS. To determine the causal impact of the EU ETS on eco-innovation, the thesis makes use of a DID estimation. DID
assessments have become widely spread since the seminal work of Ashenfelter and Card (1985). They are frequently used in policy analysis because they provide unbiased effect estimates of a policy intervention using a non-experimental design (Stuart et al., 2014). To estimate a policy effect, DID estimations compare changes over time in a group unaffected by the policy to changes in a group affected by the policy, and attributes the DID to the effect of the policy (Ashenfelter & Card, 1985; Stuart et al., 2014). The selection of the pre-treatment and treatment period is vital for the interpretation of the treatment effect. De Chaisemartin & D’haultfoeuille (2019), as well as Wing, Simon, and Bello-Gomez (2018) show that DID with multiple periods can be estimated by comparing different linear models. The applicability of a linear model to assess panel data and patents, in particular, is debated in academia due to the data’s tendency to suffer from overdispersion7 (Hausman, Hall, & Griliches, 1984; Blundell,
Griffith, & Van Reenen, 1995; Allison & Waterman, 2002). However, the ease of interpretation justifies the use of linear models (Williams, 2008), and various studies have assessed patent data in this way (Jaffe & Palmer, 1997; Sanyal & Vancauteren, 2013; Yoshikane, Suzuki, Arakawa, Ikeuchi, & Tsuji, 2013).
Firstly, the thesis formulates model (1a)8 to analyze the impact of the EU ETS on a firm’s eco-innovativeness comparing the entire post-EU ETS period to the pre-EU ETS period:
𝑙𝑛𝐸𝑐𝑜𝑝𝑎𝑡𝑖𝑡 = 𝛽0+ 𝛽1𝐸𝑇𝑆𝑖+ 𝛽2𝑝𝑜𝑠𝑡 + 𝛽3𝐸𝑇𝑆𝑖 ∗ 𝑝𝑜𝑠𝑡 + 𝛽4𝑠𝑖𝑧𝑒𝑖,𝑡−2+ 𝛿𝑗 + 𝜇𝑐
+𝜃𝑡+ 𝜀𝑖𝑡, (1a)
where 𝑙𝑛𝐸𝑐𝑜𝑝𝑎𝑡𝑖𝑡 is the natural logarithm of the number of granted patents for firm i with an application date at time t. 𝐸𝑇𝑆𝑖 is a dummy variable equal to one if a firm i became regulated by the EU ETS in 2005; 𝑝𝑜𝑠𝑡 is a dummy variable taking on value one for the time period from 2005-2012; 𝐸𝑇𝑆𝑖 ∗ 𝑝𝑜𝑠𝑡 is the interaction between the these variables. In a DID study, the
estimator of the interaction effect is of interest, in this case 𝛽3, which es expected to carry a positive sign. 𝑆𝑖𝑧𝑒𝑖𝑡 is a control variable for the fixed assets size (as natural logarithm) of each
firm i in year t-2. The lag to eco-patent output is considered because Hall, Griliches, and Hausman (1986) suggest that the average time from R&D to patent application is two years, which is also an appropriate estimate for eco-innovations (Hall & Helmers, 2013). 𝛿𝑗 is a set
7 In section 5.2. a non-binomial model is assessed in addition to the linear models posed.
8 The thesis uses the terms “model one” and “model two” when referring to the general models, while using the