F
ACULDADE DEE
NGENHARIA DAU
NIVERSIDADE DOP
ORTODriver drowsiness detection using
non-intrusive eletrocardiogram and
steering wheel angle signals
Margarida Fernandes
Mestrado Integrado em Bioengenharia Supervisor: Professor Dr. Jaime S. Cardoso Co-Supervisor: Professor Dr. André Lourenço
c
Driver drowsiness detection using non-intrusive
eletrocardiogram and steering wheel angle signals
Margarida Fernandes
Mestrado Integrado em Bioengenharia
Resumo
De acordo com a Administração Nacional de Segurança de Tráfego nas Rodovias dos EUA, alega que um total de 100.000 acidentes de veículos a cada ano é consequência da fadiga do condu-tor. Deste modo, tendo em conta estes números, embora a automatização dos veículos seja uma realidade emergente e uma grande ajuda na resolução desta questão, é uma realidade que ainda está longe de ser uma tecnologia do dia-a-dia. De facto, atualmente, grande parte da indústria automóvel ainda baseia a sua tecnologia nos níveis 0 e 1 de automação, níveis estes que se carac-terizam por serem totalmente dependentes da intervenção humana. Com base nesta informação, é correto concluir que é ainda uma necessidade emergente encontrar soluções rápidas para este prob-lema, mesmo que sejam soluções aparentemente temporárias. Ora, na literatura pode verificar-se a exploração de várias abordagens para detecção de fadiga. Os métodos subjetivos são os mais uti-lizados apesar de não serem os mais eficazes. Deste modo, métodos baseados no comportamento, baseados em sinais fisiológicos, baseados em características retiradas da utilização do veículo em si ou mesmo métodos multimodais são comumente utilizados na literatura.
Desta forma, numa primeira abordagem, esta dissertação irá apresentar o estado da arte rela-tivamente à utilização das técnicas acima descritas. Para além disso, é apresentada também uma revisão de possíveis ambientes de aquisição de medições para o estudo da fadiga e soluções atuais no mercado.
Assim, esta dissertação teve como objetivo a utilização multimodal de métodos de natureza diferente para a previsão do estado fatigado do condutor, nomeadamente o ângulo associado à manipulação do volante do condutor e o ECG do mesmo. Para o efeito, a base de dados SleepEYE foi utilizada , incluindo as medições dos sinais em estudo de 18 condutores durante o dia e a noite. Uma estrutura típica de um problema de machine learning foi utilizada. Assim, de modo a prever o estado de fadiga, utilizando a escala KSS resultado da autoavaliação de cada condutor como base, foram seguidas duas abordagens: avaliação de fadiga com base no valor absoluto da escala e avaliação da fadiga com base na comparação com o estado anterior. Deste modo, 16 e 17 características foram extraídas dos sinais de ECG e steering wheel angle, respectivamente. A utilização dos dois sinais de forma conjunta foi efetuada concatenando as características dos dois sinais e utilizando combinação de classificadores.
A título de conclusão, verificou-se que a avaliação comparativa ao estado anterior do estado de fadiga demonstrou ser mais eficiente que a avaliação baseada na avaliação absoluta do condutor, verificando-se um aumento de 7% na accuracy final: na primeira abordagem verificou-se uma
accuracyde 82% utilizando SVM, enquando que na segunda abordagem foi obtida uma accuracy
de apenas 94% concatenando as características dos dois sinais. Contudo, ao utilizar a técnica de combinação de classificadores conjugando os modelos SVM treinados com o ECG e o SWA previamente treinados em separado, é possível obter uma performance de 94%. Todavia, este resultado não é melhor que os obtidos anteriormente. Deste modo, verificou-se que a utilização da concatenação dos dois sinais foi benéfica apenas na abordagem relativa de previsão de fadiga. Para além disso, a utilização das características do sinal SWA revelou ser mais eficiente na tarefa
ii
de previsão do estado de fadiga quando comparado com o ECG.
Este trabalho está integrado no projeto AUTOMOTIVE (detecção automática de sonolência multiMOdal para veículos inteligentes) e foi proposto pela empresa textit CardioID Technologies e pelo INESC-TEC.
Abstract
This dissertation focused on the non-intrusive multimodal detection of drowsiness on vehicle drivers. In fact, according to the US National HighwayTraffic Safety Administration (NHTSA), a total of 100,000 vehicles crashes each year are a consequence of driver drowsiness. Consider-ing these numbers, although fully automated vehicles will probably be a great help on this issue, this is a reality that is still far from being a day-by-day technology used. Actually, the level 0 and level 1 of automation, which are fully dependent on human intervention, are still the most used by vehicles nowadays. Following this, it is important to find solutions for this problem, even if temporary. There are various approaches for drowsiness detection presented in the literature. Subjective methods are the natural ones used, however, they can not be the most efficient for the purpose. This way, behavior methods, physiological, vehicle-based methods and even multimodal approaches are being explored all around the world.
Regarding this, as a first approach, this dissertation presents a study of the state of art of the drowsiness detection techniques previously mentioned, a review on the possible environments on which drowsiness measurements can be acquired and possible solutions for the problem currently in the market.
Specifically, on this dissertation, vehicle and physiological methods are going to be explored, in particular, ECG and steering wheel angle (SWA). For the effect, SleepEYE database was used and includes the measurements of the two signals in study 18 drivers during day and night. Fol-lowing this, a typical framework of a machine learning problem was followed. In addition, by making use of the Karolinska Sleepiness Scale, used for self-evaluation by each driver to evalu-ate the stevalu-ate of drowsiness, two approaches were followed: drowsiness evaluation based on the absolute scale value and drowsiness evaluation based on the comparison with the previous state. This way, 16 and 17 features were extracted from the ECG and SWA signals, respectively. Then, a machine learning model was constructed for drowsiness classification, concatenating the two signals features for multimodal and using classifier combinations.
Finally, regarding the conclusions of this work, it was verified that the relative evaluation of the driver state in comparison to the previous state demonstrated to have a better performance when compared to the absolute evaluation, having an increase of performance of 12%. In fact, the first approach mentioned obtained an accuracy of 82% using SVM and the second approach got an accuracy of 94% with SVM, by concatenating the features of the two signals. Also in this second approach, by classifier combination of the SVMs using ECG and SWA individually obtained a score of 94%, although it was not greater that the scores previously obtained. Thus, one can conclude that the concatenation approach benefits the prediction of the drowsiness state only on the relative approach. On the other hand, SWA obtained a higher overall performance for both of the approaches in study.
This work is integrated on the project AUTOMOTIVE (AUTOmatic multiMOdal drowsiness detection for smart VEhicles) and was proposed by the company CardioID Technologies and INESC-TEC.
Agradecimentos
Esta dissertação de certo que não poderia chegar a bom porto sem o precioso apoio de muitas pessoas. Queria agradecer aos meus orientadores Professor Dr. Jaime Cardoso, à Professora Ana Rebelo e ao Professor André Lourenço pela disponibilidade e ajuda ao longo de toda a tese.
Queria agradecer também aos meus pais e à irmã por todo o apoio incondicional sempre, na vitória e na derrota. São o pilar principal e sem a sua estabilidade nada seria possível. A seguir, gostaria de agradecer às grandes pessoas que conheci na faculdade, que estão lá para mim incondicionalmente. Um grande obrigada ao Paulo Maia, porque está sempre lá para ser um ombro amigo e para partilhar a sua grande sabedoria com todos sem sequer hesitar. Um obrigada ao João Carlos Monteiro (Orquídea) por me ajudar sempre que tenho uma dúvida existencial de machine learning emergente. Um obrigada ao Walker, à Mérida, à Fátima por apoiarem os meus breakdowns mesmo não estando sempre fisicamente à minha beira e me fazerem rir. Um obrigada ao Bruno Santos e à Mónica que mesmo nas Holandas me aturam a reclamar da tese. Um obrigada à Marina, à Varejão por me alegrarem sempre o dia com a sua presença, apoio e sobretudo videos/memes random da internet. Um obrigada à Mariana Campos e à Leonor pela amizade, pelo apoio, pelas risotas e por me fazerem descontrair nestes momentos de stress tão intenso. Um obrigada ao Alex e ao Nuno Costa por me ajudar sempre que eu preciso e pela amizade. Um obrigada à Piu, pelo seu apoio e alegria, partilha de dúvidas da vida e pela amizade. Um obrigada muito grande à Rajah, à Cris e à Ju porque por mais dolorosa que a queda seja e por mais vontade que tenha de desistir, nunca me deixam largar os meus sonhos e nunca me deixam sozinha. Um obrigada também à Ju e ao Bruno por serem a minha companhia constante de jardim, constante fonte de galhofa e principalmente apoio e compreensão, sempre.
Margarida Fernandes
"If you are not failing every now and again, it’s a sign you are not doing anything very innovative."
Woody Allen
Contents
1 Introduction 1 1.1 Goals . . . 2 1.2 Contributions . . . 3 1.3 Structure of Dissertation . . . 3 2 Literature Review 5 2.1 Drowsiness on driving task . . . 52.1.1 Methods of drowsiness detection . . . 6
2.2 Drowsiness detection products on the Market . . . 19
2.3 Experimental setups . . . 20
2.3.1 Driving simulators . . . 20
2.3.2 Test tracks . . . 22
2.3.3 Road Studies . . . 22
2.3.4 Naturalistic driving studies . . . 22
2.3.5 Application of experimental setups . . . 22
3 A framework for driver drowsiness monitoring 25 3.1 Generalized Framework for Drowsiness Detection . . . 25
3.2 SleepEye Database description . . . 26
3.2.1 Participants . . . 26
3.2.2 Procedure . . . 26
3.2.3 Test Route . . . 27
3.2.4 Data acquisition . . . 27
3.3 Data preparation and Labeling . . . 28
3.4 Steering wheel angle - based (SWA) . . . 29
3.4.1 Pre-processing . . . 29
3.4.2 Feature extraction . . . 30
3.5 Eletrocardiogram-based (ECG) . . . 34
3.5.1 Poincaré plot . . . 34
3.5.2 R peaks of ECG detection . . . 35
3.5.3 Feature Extraction . . . 37 3.5.4 Feature Selection . . . 37 3.6 Classification . . . 38 3.6.1 Supervised methods . . . 38 3.6.2 Ensemble Classifiers . . . 40 3.6.3 Classifier Combination . . . 41 3.6.4 Balance of Classes . . . 41
3.6.5 Cross validation strategy . . . 43 ix
x CONTENTS
3.6.6 Performance assessment . . . 45
4 Results and discussion 49 4.0.1 Classifiers and Feature Comparison . . . 49
4.0.2 Comparison between KSS scale absolute and relative evaluation . . . 55
4.0.3 Classifier Combination . . . 55
4.0.4 Discussion . . . 56
5 Conclusions and Future Work 57 5.1 Conclusions . . . 57
List of Figures
1.1 Cardio-wheel sensor [1] . . . 2
2.1 Fatigue possible causes. Source: [2] . . . 6
2.2 KSS scale [3] . . . 7
2.3 Scheme of behavioral measures . . . 8
2.4 Heart-beat representation [4] . . . 14
2.5 Classification of experimental setups in degree of control and setup validity . . . 23
3.1 Framework of Drowsiness detection based on Vehicle and ECG-based . . . 25
3.2 Teste route: Motorway E4. The test route started at exit 111 in Linköping and the turning point was at exit 128 in Gammelsta. Source: [5] . . . 27
3.3 Kss-based labeling division . . . 28
3.4 Kss-based labeling division . . . 28
3.5 SWA signal acquisition representation: y and x represent the referential; the streak line represents the axis that indicates the direction of the movement; "+" and "-" represent the positive and negative angle values . . . 29
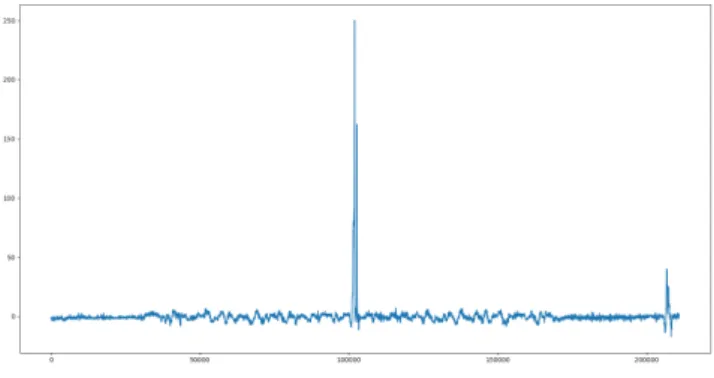
3.6 Original steering wheel signal wave form . . . 29
3.7 Comparison between Steering wheel angle signal before (in blue) and after pre-processing (in orange) . . . 30
3.8 An example Poincaré plot, also detailing the ellipse fitting process and the his-tograms derived from the plot . . . 35
3.9 R peak detection framework . . . 36
3.10 R peak detection visualization step by step . . . 36
3.11 Random Forest example . . . 40
3.12 Balance between Classes "Alert" and "Drowsy" . . . 42
3.13 Balance between Classes "Stable", "More Drowsy" and "Less Drowsy" . . . 42
3.14 GroupKFold CV . . . 43
3.15 StratifiedKFold visual representation [6] . . . 44
List of Tables
2.1 State-of-art of behavioral methods for drowsiness detection . . . 10
2.2 Features of steering wheel movement . . . 11
2.3 State-of-art of vehicle-based methods for drowsiness detection . . . 12
2.4 State-of-art for Physiological methods of Drowsiness Detection . . . 16
2.5 State-of-art of hybrid methods for drowsiness detection . . . 18
3.1 Start and end times for the driving sessions . . . 26
3.2 Features extracted from steering wheel angle signal . . . 31
3.3 Table of HRV-based feature extraction . . . 37
3.4 Table of ECG Frequency domain features . . . 37
3.5 Table of ECG Frequency domain features . . . 37
3.6 Hyperparameters and defined range for GridSearchCV . . . 45
3.7 Confusion matrix . . . 46
4.1 Cross Validation accuracy results (average and standard deviation) for different classifiers using ECG, SWA and their combination - KSS scale absolute evaluation 49 4.2 Features selected for ECG feature matrix after Feature selection methods being applied for KSS absolute scale evaluation . . . 50
4.3 Testing phase accuracy results (average and standard deviation) for different clas-sifiers using ECG, SWA and their combination - KSS scale absolute evaluation . 50 4.4 Support Vector Machine f1-scores for "Alert" and "Drowsy" . . . 51
4.5 Random Forest f1-scores for "Alert" and "Drowsy" . . . 51
4.6 K nearest neighbours f1-scores for "Alert" and "Drowsy" . . . 51
4.7 Bagging Classifier f1-scores for "Alert" and "Drowsy" . . . 52
4.8 Cross validation accuracy results (average) for different classifiers using ECG, SWA and their combination - KSS scale relative evaluation . . . 53
4.9 Testing phase accuracy results (average) for different classifiers using ECG, SWA and their combination - KSS relative evaluation . . . 53
4.10 Support Vector Machine f1-scores for "Stable" and "More Drowsy" . . . 53
4.11 Random Forest f1-scores for "Stable" and "More Drowsy" . . . 54
4.12 K nearest neighbours f1-scores for "Stable" and "More Drowsy" . . . 54
4.13 Bagging Classifier f1-scores for "Stable" and "More Drowsy" . . . 54
4.14 Accuracy on the test phase using the Voting classifier for classifier combination, being SVMconcat, RFconcat and KNNconcat the SVM, RF and KNN classifiers trained with concatenation of ECG and SWA. . . 55
4.15 Accuracy on the test phase using the Voting classifier for classifier combination of SVMekg and SVMswa. . . 56
xvi Abbreviations and symbols
Abbreviations and symbols
ADAS Advanced Driver Assistance Systems
ADS Automated Driving Systems
AECS Average Eye Closure Speed
ANN Artificial Neural Network
ANS Autonomic Nervous System
ApEn Aproximated Entropy
AR Autoregressive Model
BAG Bagging
BN Bayesian Network
CGF Center of Gravity of Frequency
CV Cross Validation
DT Decision Tree
DWT Discrete Wavelet Transform
ECG Electrocardiogram
EDA Electrodermal activity
EEG Electroencephalogram
EMG Electromyography
EOG Electrooculography
ESS Epworth Sleepiness Scale
FEUP Faculty of Engineering of Oporto University
FFT Fast Fourier Transform
HF High Frequency
HOG Histogram of Oriented Gradients
HRV Heart Rate Variability
KNN K-Nearest Neighbour
KFD Kats Fractal Dimension
KSS Karolinska Sleepiness Scale
LBP Local Binary Patterns
LDA Linear Discriminant Analysis
LF Low Frequency
LR Logistic Regression
MOL Multilevel ordered Logit
MSLT Multiple Sleep Latency Test
MWT Maintenance of wakefulness test
NADS National Advanced Driving Simulator
NHTSA US National Highway Traffic Safety Administration
NN Neural Network
Abbreviations and symbols xvii
PERCLOS Percentage of eyelid Closure Over the pupil over time
PPG Photoplethysmography
PSD Power Spectral Density
Q1 First Quartile
Q2 Second Quartile
Q3 Third Quartile
RBF Radial basis function kernel
REM Rapid eye movement
RF Random Forest
RRI R-R peaks intervals
SAE Society of Automotive Engineers
SamEn Sample Entropy
SCR Skin Conductance Response
SD1 Short-term variability
SD2 Long-term variability
SDLP Standard Deviation of Lane Position
ShEn Shannon Entropy
SMOTE Synthetic Minority Oversampling Technique
SpEn Spectral Entropy
SPS Samn-Perelli Seven-point Fatigue Scale
SR Sleep-related
SSS Stanford Sleepiness Scale
SVM Support Vector Machine
SWA Steering Wheel Angle
SWM Steering Wheel Movement
TR Task-related
VAS Visual Analogues Scale
VLF Very Low Frequency
VTI Swedish National Road and Transport Research Institute
Chapter 1
Introduction
Nowadays, driving a car is an everyday complex task for many people and requires a lot of physi-ological and cognitive skills. This way, the development of motorization has a direct impact on the number of driving accidents. Driving accidents can have many causes, such as alcohol drinking, distractions, and others. However, one of the major causes is driver drowsiness due to sleep depri-vation and can provoke bad physical injuries and deaths. According to the US National Highway Traffic Safety Administration (NHTSA) [? ], the statistics show that a total of 100,000 vehicle crashes each year are a consequence of driver drowsiness. Also, the National Sleep Foundation has reported that 60% of adult drivers drive while feeling drowsy and 37% have ever actually fallen asleep during driving. As described, this is a big problem and needs a solution. The devel-opment of fully self-driving, with no human intervention, would possibly completely solve this problem, however, it is far from being a day-by-day used technology. There are five automation
levels, according to SAE (Society of Automotive Engineers) [7]:
• Level 0: Fully manual vehicle - most cars are in this level. They are fully manual vehicles, so the driver controls every aspect of the driving;
• Level 1: One single automated aspect - is the first level to be considered as an autonomous car because already has Advanced Driver Assistance Systems, ADAS, including steering, speed, or braking control;
• Level 2: Automated steering and acceleration capabilities - the car has some automation capabilities such as stay in lanes and self-parking due to the control of both the steering and acceleration/deceleration ADAS capabilities;
• Level 3: Environment detection - the vehicle is able to detect the environment around and make decisions according to it, for example, overtaking slower vehicles (Automated Driving Systems (ADS)). However, still requires human intervention when the car is unable to do or fails a task.
2 Introduction
• Level 4: No human interaction required - has the same capabilities of level 3, however, the vehicle is able to correct itself in case of error. On this level, human interaction is not required although it has the manual mode if needed.
• Level 5: fully self-driving automation - vehicles don’t need human intervention just like level 4. However, it is capable of being more responsive and has a better driving quality than manual driving.
Nowadays, normal cars can be inserted in level two, however, level 3 and 4 will slowly be inserted in the market in the next years. On these levels (2,3 and 4) human intervention is still present and so fatigue is still an issue. Also, level 5 is expected to be introduced from 2025 on. This way, it still makes sense to try to solve this problem.
Facing this problem, many researchers (Table2.1; Table2.3; Table2.4) have tried to correlate
driver behaviors with drowsiness state with a different machine and deep learning methods in order to predict the driver’s state and alert the driver if it is wise to drive.
1.1
Goals
The thesis was proposed by CardioID Technologies, a Portuguese company, that developed
Car-dioWheel[8] (Figure1.1) an Advanced Driver Assistance System that acquires the
electrocardio-gram (ECG) from the driver’s hands to continuously detect drowsiness, cardiac health problems, and biometric identity recognition.
Figure 1.1: Cardio-wheel sensor [1]
The project AUTOMOTIVE, AUTOmatic multiMOdal drowsiness detection for smart VE-hicles, initiated in 2018 by INESC-TEC and CardioID Technologies was the starting point for creating a system to detect automatically the driver’s fatigue. The objectives of this project is to use ECG-based biometric recognition of the driver’s identity to achieve a personalized and more efficient monitoring. Moreover, since it is really difficult to access real data, the project will create an automobile driving simulator and implement transfer learning techniques.
The work of this thesis, as carried out in this project, aims to develop computational models specifically focusing on non-intrusive algorithm’s of drowsiness detection, in particular, physio-logical and vehicle-based methods. More precisely:
1.2 Contributions 3
• Apply pre-processing techniques that can possibly enhance the final results. • Identify main features that help differentiating "drowsy" and "alert" state;
• Develop and compare computational model of classification and fatigue prediction;
A database, SleepEYE [9], with real-driving conditions (with the controlled environment) will
be used.
1.2
Contributions
The thesis presented here is innovative by several reasons:
• Multimodal approach of drowsiness detection, focusing on steering wheel angle (SWA) and ECG signals;
• Using several strategies of machines learning and classifier combination; • Comparison between drowsiness state detection approaches.
1.3
Structure of Dissertation
Apart from the introduction, this document contains 4 chapters. On chapter2, the drowsiness
fun-damentals, state-of-art, are discussed methodologies and experimental-setups related to
drowsi-ness detection. On chapter 3, is described the methodologies that integrate the workflow for
drowsiness detection and prediction. The following chapter, Chapter 4 describe the results
ob-tained and respective discussion. Finally, in chapter5, conclusions regarding the developed work
Chapter 2
Literature Review
In this chapter, the condition of drowsiness, sleep, and fatigue associated with the driving task will be discussed. Also, the state of art for drowsiness detection will be explored. Moreover, experimental setups and products already in the market will be described.
2.1
Drowsiness on driving task
Sleep is a deterministically evolving, self-limiting, period of reduced activity also characterized by a reduction of consciousness. Sleep is a very important process to restore responsiveness to stimulation, the skill needed for every task on every individual in life. Sleep cycles last 90 minutes and each cycle is divided into two modes: rapid eye movement (REM) sleep and non-REM sleep,
which includes three separate stages [3]:
• Stage I: transition from awake to asleep; • Stage II: light sleep;
• Stage III: deep sleep
Sleep stages and cycles can be distinguished by analyzing changes in physiological signals, such as brain activity (analyzed using EEG), body temperature, respiratory changes and cardio-vascular and even muscle activity (analyzed using ECG and EMG, respectively).
The state between being awake and stage I is designed drowsiness. This state can easily evolve to an actual sleep state. It is characterized by a reduction of alertness, decay of the level of attention and environmental sensory response. In addition, sleepiness can be defined as the inability to stay awake and also situations when full attention was required. Although sleepiness and drowsiness are usually used for the same meaning, drowsiness can be described by objective measures in contrast with the term sleepiness, which refers to a more subjective patient state. This way, sleepiness is usually rated qualitatively and quantitatively by scales.
On the context of drowsiness on the driving task, it makes sense to address fatigue. Fatigue is related to a reduction of the capacity to execute task and reduced efficiency of accomplishment,
6 Literature Review
usually accompanied by a feeling of weariness and tiredness. Although a patient can have symp-toms of fatigue unrelated to being sleepy or drowsy, the opposite is not true, a person cannot be sleepy/drowsy without being fatigued. So, fatigue detection is a way of detecting drowsiness in
this context. There are various causes for fatigue: sleep-related and task-related (Figure2.1).
Figure 2.1: Fatigue possible causes. Source: [2]
Sleep-related (SR) fatigue type relates to circadian rhythm, sleep disorders or sleep depriva-tion. In fact, the body’s natural circadian rhythm (24 hour cycle) is responsible for sleep/wake alternation during the day, is characterized by peaks of sleepiness along the day. A lack of atten-tiveness is common in the early afternoon, for example. Consequently, dysregulation of circadian rhythms results in increased drowsiness states having a direct effect on the driving performance of the person. On another hand, Task-related (TR) fatigue alludes to driving conditions and other demanding activities. This type of fatigue can be distinguished in two types: active and passive. Active TR happens in a situation of high demanding driving, in contrast with passive TR which
relates to underload driving conditions, such as monotonous roads [2], [10].
For all causes of fatigue, regardless of the fact of feeling sleepy or not, the effect on the per-son are always the same. Specifically, in the driving task, drowsiness signs include struggling in focusing, frequent blinking or heavy eyelids. Also, daydreaming, disconnected thoughts are com-mon and trouble remembering events that just occurred or missing exits are also comcom-mon. Other common behaviors include yawning repeatedly or rubbing the eyes. In terms of vehicle handling, drifting the car from the lane, tailgating distracted driving missing the right way, feeling
irritabil-ity or aggressively and also with lower reaction time usually occur [11]. Although sleeping and
caffeine, for example, is considered the best countermeasures for this issue, because automatically
solve the problem, it is important to consider automation as a relevant resolution option [10].
In conclusion, this study will focus on general drowsiness detection without considering causal factors, for the above reasons explained.
2.1.1 Methods of drowsiness detection
Drowsiness can be detected by analyzing changes in the behavior of the driver, affecting bio-signals and vehicle handling. This way, there are four main methods of drowsiness detection:
subjective, behavior, vehicle-based and physiological [3]. However, a multimodal approach
2.1 Drowsiness on driving task 7
2.1.1.1 Subjective detection
Subjective detection is based on the driver’s personal estimation and is usually evaluated resorting to scales.
• The most common one used is the Karolinska Sleepiness Scale (KSS), a nine-point scale
that has state descriptions for each step, as shown in figure2.2. When the KSS was used
with EEG or EOG, the changes observed in this equipment with drowsiness do not usually
appear until KSS scores reach more than seven points [12].
Figure 2.2: KSS scale [3]
• Stanford Sleepiness Scale (SSS) also evaluates the level of alertness. The person should choose the best suitable condition at the time from 7 statements. Usually, the purpose of SSS is to study the effects of sleep deprivation, sleep fragmentation and circadian rhythms
[12].
• Visual Analogues Scale (VAS) is a horizontal line 100 mm long across a page, anchored by word descriptors at each end. The person should choose and mark in the scale its state along
the task. According to [13], VAS is more accurate when compared to SSS [12].
• Epworth Sleepiness Scale (ESS) is used to evaluate the probability of falling asleep during the day. With this scale, the individual must self-evaluate the drowsiness state by answering to an eight-item questionnaire that gives, in the end, an overall score of daytime sleepiness
[12].
• Samn-Perelli Seven-point Fatigue Scale (SPS) evaluates in seven levels from 1, fully alert
and wide awake to 7, complete exhausted [12].
Apart from scales, there are other subjective methods that can be used, for example, Observer rated sleepiness (ORS). The evaluation is made by trained individuals or experts who rate the
condition of the driver by analyzing recorded videos, usually in real-time [14].
Maintenance of Wakefulness Test (MWT) [15] and Multiple Sleep Latency Test (MSLT) [16]
8 Literature Review
2.1.1.2 Behaviour Detection
Behavior methods of drowsiness detection involve non-invasive observation of a driver’s external state. These methods are based on detecting specific behavioral cues exhibited by a driver while
in a drowsy state [17]. This way, by recurring to a video camera for image acquisition, the system
is capable of making a decision whether the driver may be drowsy or not, by extracting specific metrics with computer vision and machine learning techniques. A typical approach relies on extracting metrics related to facial expressions, which can be correlated with a drowsy states, such
as rapid, constant blinking, nodding of the head, or frequent yawning [18].
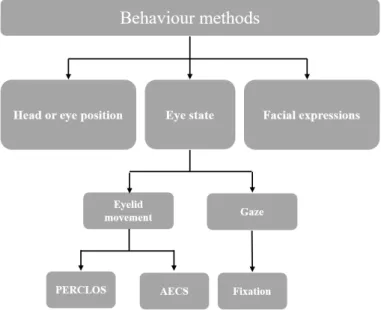
Figure 2.3: Scheme of behavioral measures
Some behavioral methods are presented on Figure 2.3. In fact, in a drowsy state, some of
the muscles in the body begin to relax, which can lead to nodding. This way, algorithms aim to detect this movement of the head, eye position, and facial actions, and require stereoscopic
vision or 3D vision cameras [17]. Nevertheless, as is known, frequent yawning reflects a more
relaxed state which can lead to a drowsy/sleepy state. However, yawning should never be used as stand-alone feature, because it does not always occur before the driver goes into a drowsy-state
[17]. A drowsy state can also be easily detected by analyzing the eye state, more specifically
eye movement and gaze. Addressing the frequency of blinking, there are two possible measures: PERCLOS (PERcentage of eyelid CLOsure over the pupil over time) and Average Eye Closure Speed (AECS). In fact, a drowsy person blinking will be much slower when compared to an awake/alert person. On another hand, the movement of a person’s pupil (gaze) may have the
potential to indicate one’s intention and mental condition [19]. Usually, while driving, the gaze is
mainly in the direction of the road. When drowsy a person tends to look at other directions for a long period of time and also because their visual awareness is reduced, it is difficult to concentrate on one direction.
2.1 Drowsiness on driving task 9
After extracting the different described metrics, some machine learning techniques are used to find patterns in order to predict the state of the driver of pre-classified data. Some articles of the
literature follow these methodologies, as presented on Table2.1.
2.1.1.3 Vehicle-based detection
Vehicle-based detection is made by making a interrelation between the driver’s alertness state and vehicle parameters. The two major measures are the steering wheel movement (SWM) and the standard deviation of lane position (SDLP). These parameters help to identify some driving patterns that are related to many events that lead to accidents.
Many accidents on the road are caused by leaving a designated lane and crossing into a lane of opposing traffic or going off the road. This way, SDLP measurement monitors the car’s relative
position within its lane with an externally-mounted camera [17]. An experiment conducted by
Ingre et al. derived several statistical features based on SDLP, found that when the Karolinska Sleepiness Scale (KSS) ratings increase, SDLP (meters) also increases. However, it does not show consistent results on all subjects. For some subjects, the KSS ratings are very high, while SDLP
do not increase accordingly [38].
There are some disadvantages of SDLP-based method: on one hand, its robustness is not satisfactory. Also, sensing of vehicle lateral position is very expensive in terms of hardware re-quirement and computing, as it requires capturing and processing of road image data. It is highly affected by external factors, such as lane marks, temperature, lighting, etc. In addition, drivers
under the influence of alcohol and drugs will show the same SDLP features [38].
SWM consists of measuring the steering wheel movement data, detecting slightest changes on the steering wheel positions, using an angle sensor mounted on the steering column. Actually, a drowsy person tends to do less of small, smooth corrections on the steering wheel when compared
to a not-fatigued individual and also when it does occur, it is large and sudden [39]. This
micro-corrections can be evaluated by analyzing the steering wheel angle (SWA). In order to eliminate the effect of lane changes, the researchers consider only small steering wheel movements (between 0.5
and 5), which are needed to adjust the lateral position within the lane [19]. Also, some corrections
can be mistaken with curves. A potential problem with this approach is the high number of false positives. SWM-based systems can function reliably only in particular environments as it is very reliant on the geometrical features of the road, so the method can only work in certain situations
[38].
One possible way to avoid unreliable results, although many algorithms are developed using
databases acquired in simulated environments [40] [41] [42], is to use real environment datasets
for drowsiness detection algorithms. In fact, only in real driving experience, it is possible to note
the non-linearity, time-space variation, and instability of the driving task [38].
One important step on the drowsiness detection with SWA signal is a pre-processing proce-dure, due to its dependency on road conditions. Usually, pre-processing includes removing the elimination of the road curvature, as it could be mistaken as being a macro-correction on the steer-ing wheel, as it corresponds to a great angle value. It is considered to be a road curvature when
10 Literature Review
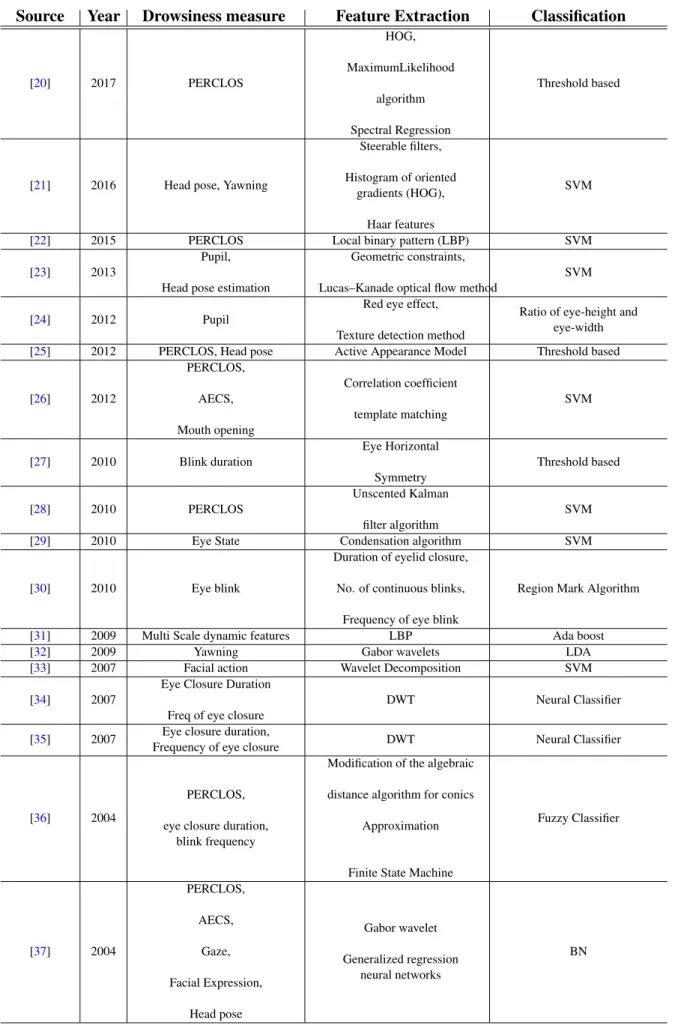
Table 2.1: State-of-art of behavioral methods for drowsiness detection
Source Year Drowsiness measure Feature Extraction Classification
[20] 2017 PERCLOS HOG, MaximumLikelihood algorithm Spectral Regression Threshold based
[21] 2016 Head pose, Yawning
Steerable filters, Histogram of oriented
gradients (HOG), Haar features
SVM
[22] 2015 PERCLOS Local binary pattern (LBP) SVM [23] 2013
Pupil, Head pose estimation
Geometric constraints, Lucas–Kanade optical flow method
SVM
[24] 2012 Pupil
Red eye effect, Texture detection method
Ratio of eye-height and eye-width [25] 2012 PERCLOS, Head pose Active Appearance Model Threshold based [26] 2012 PERCLOS, AECS, Mouth opening Correlation coefficient template matching SVM [27] 2010 Blink duration Eye Horizontal Symmetry Threshold based [28] 2010 PERCLOS Unscented Kalman filter algorithm SVM
[29] 2010 Eye State Condensation algorithm SVM
[30] 2010 Eye blink
Duration of eyelid closure, No. of continuous blinks, Frequency of eye blink
Region Mark Algorithm
[31] 2009 Multi Scale dynamic features LBP Ada boost
[32] 2009 Yawning Gabor wavelets LDA
[33] 2007 Facial action Wavelet Decomposition SVM [34] 2007
Eye Closure Duration Freq of eye closure
DWT Neural Classifier
[35] 2007 Eye closure duration,
Frequency of eye closure DWT Neural Classifier
[36] 2004
PERCLOS, eye closure duration,
blink frequency
Modification of the algebraic distance algorithm for conics
Approximation
Finite State Machine
Fuzzy Classifier [37] 2004 PERCLOS, AECS, Gaze, Facial Expression, Head pose Gabor wavelet Generalized regression neural networks BN
2.1 Drowsiness on driving task 11
there are many consecutive SWA value of the same signal. After being detected, road curvatures
values are subtracted to SWA signal itself [43] [40].
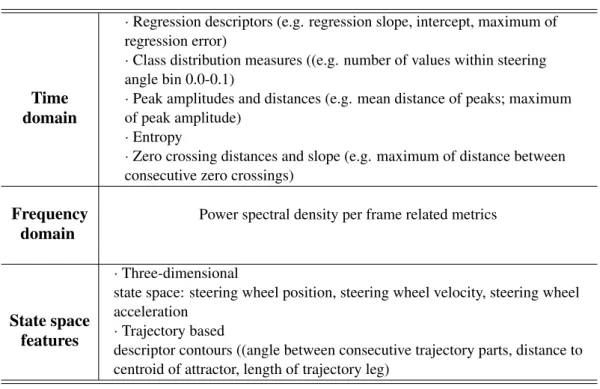
Features of steering wheel movement can be organized in time, frequency and state space
domains. Some of the features are described on the Table2.2[41].
Table 2.2: Features of steering wheel movement
Time domain
· Regression descriptors (e.g. regression slope, intercept, maximum of regression error)
· Class distribution measures ((e.g. number of values within steering angle bin 0.0-0.1)
· Peak amplitudes and distances (e.g. mean distance of peaks; maximum of peak amplitude)
· Entropy
· Zero crossing distances and slope (e.g. maximum of distance between consecutive zero crossings)
Frequency domain
Power spectral density per frame related metrics
State space features
· Three-dimensional
state space: steering wheel position, steering wheel velocity, steering wheel acceleration
· Trajectory based
descriptor contours ((angle between consecutive trajectory parts, distance to centroid of attractor, length of trajectory leg)
For pattern recognition of the features extracted with SWA signals, machine learning, and deep learning approaches are used. More precisely, Support Vector Machine (SVM), fuzzy classifier, Bayesian Networks (BN), neural classifiers (ANN), Logistic Regression (LR), K-Nearest Neigh-bour(KNN), Decision Tree (DT) and Random Forest (RF) algorithm are used in the literature, as
12 Literature Review T able 2.3: State-of-art of v ehicle-based methods for dro wsiness detection Sour ce Y ear Dr o wsiness measur e F eatur e Extraction Classification [ 44 ] 2017 SW A ApEn Decision tree [ 38 ] 2017 SW A Entrop y from SW A time series within fix ed time windo ws. ApEn: approximate entrop y APLA: adapti v e piece wise linear approximation. W arping Distance of Dynamic T ime Series Binary decision model, S stands for the standard linear time series acquired through online unsupervised learning Threshold [ 45 ] 2015 lateral lane position lane heading, and v ehicle heading Standard de viation using: · absolute v alue of lateral position · absolute v alue of lane heading · absolute v alue of v ehicle heading De viation of lateral lane position De viation of v ehicle heading dif ference W ilks’ Lambda [ 46 ] 2012 SW A Steering angle at each second from 60s before a lane departure (or matched case) to 6s before the lane derandom forest algorithm parture Random forest algorithm [ 47 ] 2009 SW A T ime domain Frequenc y domain State space SVM (linear k ernel) SVM (radial k ernel) Nearest neighbour Decision T ree Logistic Re gression [ 41 ] 2009 SW A time domain features frequenc y domain features state space features Ensemble classification (SVM l , SVM r ,DT ,5 − N N ,L R ) [ 40 ] 2007 SW A Sum of v ectors on ev ery 15-second interv al Neural Netw orks [ 43 ] 2001 SW A Steering angle data were discretized and coded into an eight-dimensional v ector Neural Netw orks 89.9 %
2.1 Drowsiness on driving task 13
2.1.1.4 Physiological detection
Physiologic signals can also be an accurate method for drowsiness detection. In fact, on the early stages of sleepiness, these signals suffer notable changes, which means that is it possible to alert the driver with time in case of dangerous case of fatigue, in order to prevent road accidents. The most used electrophysiological signals for this purpose are ECG (Electrocardiogram), EEG (Elec-troencephalogram), EOG (Electrooculogram), PPG (photoplethysmography) and EDA (Electro-dermal Activity). One advantage of this method is eliminating the number of false positives on drowsiness detection.
• EOG: measures the electrical potential difference between the cornea and the retina of a human eye. This difference is correlated with the alertness level of the subject by analyzing the eye behavior. Actually, if the eye movement is slow, chances are that the driver is on a drowsy state. However, this method is really invasive because direct contact with the driver is needed: a disposable electrode is placed on the outer corner of each eye and a third electrode at the center of the forehead for reference. Despite being invasive and not usually
a practical method in the real world, it is a very precise way for drowsiness detection [17].
• EEG: measures the electrical activity of a human brain. It is actually one of the most used methods in the literature and it is highly accurate. It is proved that changes in sleep condition affect the autonomic nervous system (ANS). This way, by nature, EEG signal is complex and has multiple frequency bands and each one of these frequencies is itself correlated with
the state of the drowsiness of an individual [48]:
– delta band (0-4 Hz) : deep sleep and sleep position; – theta band—which (4-7 Hz) : drowsiness;
– alpha band-which (8-13 Hz) : relaxation state and closed eyes ; – beta band—which (13-30 Hz): alertness;
The problem with EEG drowsiness measurements is that the frequencies used are very prone to errors, are really invasive as it requires direct contact with the individual and demands very specific conditions in order to proper measurement. This way, on a real-world driving situation, it is really difficult to use the EEG measure sensors, as having electrodes attached to the driver’s head is not convenient. Also, in this case, it could have the opposite effect of the one proposed: these sensors could disturb the driving task and lead to road accidents
[17].
• ECG: measures the electrical activity of a human heart. By analyzing the ECG signal, it is possible to detect minute changes on heart rate. Usually, the ECG wave that traduces the heart behavior follows a pattern and it is specific for each individual.
The heart rate is controlled by the balance between the two branches of the autonomic
14 Literature Review
system: while drowsy or in a relaxed state, an increase in the parasympathetic activity and/or a decrease in sympathetic activity is noted, awake state the opposite happens.
The variability of the heart rate is described using Heart Rate Variability measure (HRV) and can be used to indirectly measure the ANS activity. HRV is based on the analysis of
consecutive sinus rhythm R-R intervals 2.4, corresponding to a beat-to-beat changes
mea-sure.
Figure 2.4: Heart-beat representation [4]
An increased HRV indicates a higher parasympathetic activity, as the time interval length
between heartbeats variates, indicating more variability [50]. Usually, time and frequency
domain methods are used to analyze HRV. Relating time domain features, RRI (R-R inter-vals) are used. Usually, low heart-rate can induce drowsiness state. In relation to frequency domain features, these ones can be obtained using a power spectral density (PSD) of the RR
intervals. These intervals are can be classified in three frequency bands[49]:
– Very low frequency (VLF) (0-0.04 Hz) – Low frequency (LF) (0.04-0.15 Hz) – High frequency (HF) (0.15-0.4 Hz)
These bands are correlated with the drowsy/awake state: while awake, the heart rate tends to be much closer to the HF, but when the driver enters on a drowsy state, there is a clear decrease on the heart rate and it tends to LF band. Consequently, there is a decrease in the
LF/HF ratio [19].
Before extracting features that will be further used for drowsiness detection, a pre-processing of the ECG signal is needed. For noise and power interference suppression, band-pass
filters are used [51]. Next step consists of detecting R-R peaks, which define an ECG
frame. Tompkins QRS complex detection and Wavelet transform-based algorithm [52] are
two common methods for this purpose with accuracy larger then 99% [51]. This way, time
2.1 Drowsiness on driving task 15
power spectral density (PSD) and it can be calculated by recurring to Fourier analysis or an
autoregressive (AR) model [53].
ECG-based methods can be really accurate however when in an intrusive way. On driving-task, ECG values are extracted with non-intrusive sensors, obtaining noiseless signals, which jeopardizes signal processing for feature extraction. However, usually requires a heavy com-putational load because the sampling rate of ECG is usually more than several hundred Hz,
for an accurate R-R interval peak detection [51].
• PPG: Photoplethysmography (PPG) is a non-invasive technique that detects changes in pe-ripheral blood circulation. The signal extracted by this technique allows the determination of the Pulse Rate Variability, which is related to the ANS activity. PPG signal is extracted making use of a pulse oximeter which considers low-intensity IR light to be proportional to
the quantity of blood flowing through the blood vessels [19][54].
• EDA EDA refers to the phenomena where the change in sweat levels of a human directly reflects the mental state of the person. In fact, skin conductance response (SCR) is one of the parameters to identify sudden physiological changes which also influence the mental state of the individual. In this direction, there are various studies in order to correlate drowsiness
state with SCR [54] [54].
For pattern recognition of drowsiness with the physiological signals discussed, the most com-monly used machine learning and deep learning approaches are NN, LDA, K-means clustering,
Fuzzy logic system, SVM, BN, ANN, Linear Regression Model, see Table2.4, which represents
16 Literature Review T able 2.4: State-of-art for Ph ysiological methods of Dro wsiness Detection Sour ce Y ear Pr e-Pr ocessing F eatur e Extraction Classification [ 55 ] 2018 None SampEn of RR peaks SampEn of R peaks ANO V A T uk ey test [ 56 ] 2018 None HR V time and frequenc y domain features SVM KNN NB LR [ 57 ] 2017 Notch filter (Band Stop filter) HR V time and frequenc y domain features LR [ 58 ] 2017 None Frequenc y domain features: HF , VF , VLF Threshold based [ 51 ] 2016 linear phase lo w-pass filter HR V analysis related features SVM [ 59 ] 2016 Signal qualification block based on standard de viation of ECG amplitude Frequenc y domain HR V features LD A [ 60 ] 2014 Band-pass filter D WT K-means clustering [ 61 ] 2014 None Frequenc y domain HR V features (FFT) BN [ 62 ] 2013 Band-pass filter FFT Fuzzy logic system [ 53 ] 2013 Second order , bidirectional, Butterw orth, band-pass filter T ime analysis, W av elet decomposition, Spectral analysis ANN [ 63 ] 2012 High-pass filter and thresholding Neighborhood search SVM [ 64 ] 2011 Band-pass filter FFT SVM [ 65 ] 2011 BioSigBro wser HR V analysis related features LD A [ 66 ] 2011 A v eraging and lo w-pass filters PSD for frequenc y HR V , skin conducti vity and respiration features LD A, Nai v e Bayes [ 67 ] 2011 Band-pass filter FFT Neural Netw ork [ 68 ] 2010 Band-pass filter ans visual inspection D WT ANN [ 69 ] 2009 Lo w-pass filter and visual inspection D WT ANN [ 70 ] 2009 None Mean po wer frequenc y EEG features and frequenc y domain HR V features (PSD) using FFT Threshold based [ 71 ] 2008 Independent component analysis decomposition Po wer Spectrum Analysis using FFT Self-or g anizing Neural Fuzzy Inference Netw ork [ 72 ] 2008 Lo w-pass filter FFT Mahalanobis distance [ 73 ] 2008 Band-pass filter FFT Linear Re gression Model [ 74 ] 2005 Lo w-pass Butterw orth filter , Smoothing filters PSD using FFT for frequenc y HR V and respiration features SVM, Decision T rees, Nai v e Bayes
2.1 Drowsiness on driving task 17
2.1.1.5 Hybrid detection
In the previous sections, different approaches for drowsiness detection were presented. In fact, each one has its advantages and disadvantages.
Regarding subjective measures, they are not feasible for real-time monitoring systems, so usually are used as a support to other methods or even ground truth. Moreover, in some articles, PERCLOS is used as ground truth too.
Behavior methods are non-intrusive and have great results. However, as they require spe-cialized hardware and cameras, they can be more expensive and also are constrained by external factors such as illumination or unexpected features on persons face, for example, glasses, which can really difficult eye movement analysis, for example.
About vehicle-based methods, provide satisfactory results and are non-intrusive, however, they tend to be too dependent on the geometric characteristics of the road and less dependent on kinetic characteristics of the vehicle. Besides, differences in vehicle-metrics can be caused by other fac-tors different from drowsiness, for example, distractions or alcohol or drugs influence.
Physiological methods are very reliable methods with great accuracy, however in an intrusive way. Although there are non-intrusive methods, on ECG signal acquisition case, the signal quality is lost. EEG and EOG signal still require intrusive sensors on the scalp and on the eyes.
Analyzing all these strengths and weaknesses of the various methods, one approach for drowsi-ness detection and prediction with better accuracy is to combine various methods, developing
18 Literature Review
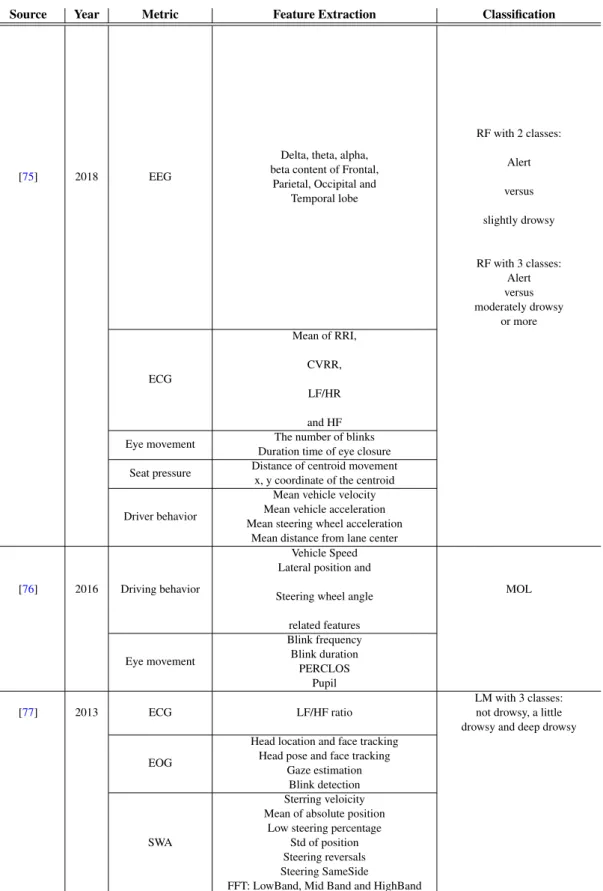
Table 2.5: State-of-art of hybrid methods for drowsiness detection Source Year Metric Feature Extraction Classification
[75] 2018 EEG
Delta, theta, alpha, beta content of Frontal,
Parietal, Occipital and Temporal lobe RF with 2 classes: Alert versus slightly drowsy RF with 3 classes: Alert versus moderately drowsy or more ECG Mean of RRI, CVRR, LF/HR and HF Eye movement The number of blinks
Duration time of eye closure Seat pressure Distance of centroid movement
x, y coordinate of the centroid Driver behavior
Mean vehicle velocity Mean vehicle acceleration Mean steering wheel acceleration
Mean distance from lane center [76] 2016 Driving behavior
Vehicle Speed Lateral position and Steering wheel angle
related features MOL Eye movement Blink frequency Blink duration PERCLOS Pupil [77] 2013 ECG LF/HF ratio LM with 3 classes: not drowsy, a little drowsy and deep drowsy EOG
Head location and face tracking Head pose and face tracking
Gaze estimation Blink detection
SWA
Sterring veloicity Mean of absolute position
Low steering percentage Std of position Steering reversals Steering SameSide
2.2 Drowsiness detection products on the Market 19
2.2
Drowsiness detection products on the Market
Some products of drowsiness detection are already in the market. Most of them integrate behavior and vehicle-based methods. However, there are products that also use physiological signals for this purpose.
Some companies sell sensors and cameras to other companies for drowsiness detection pur-poses. Examples are Bosch and Valeo:
• Bosch already sells self-developed steering-angle sensors to car manufacturers such as
Volk-swagen(Volkswagen’s Passat alltrack [78]). Apart from steering behavior, other
vehicle-based metrics are used: 70 signals are received via the vehicle’s Controller Area Network (CAN) related to the length of a the trip, use of turn signals, and the time of day, predicting
the drowsiness state of the driver [79]. When the individual is considered to be in a drowsy
state, an icon such as a coffee cup flashes on the instrument panel to warn him that he need a rest. Besides, Bosch already started developing a system with a camera for face feature drowsiness detection, a solution that was presented in Consumer Electronics Show (CES)
in 2017 in Las Vegas [80].
• On the same conference, NVidia [81] presented the Co-Pilot, that making use of artifitial
intellence is able to learn the behaviors of individual drivers and realize when they are not operating according to the rules. Drowsiness detection with integrated alarms is made by analyzing driver’ standard posture, head position, eye-blink rate, facial expression and steering style. NVidia sends this solution on a chip and already sells for companies like Audi, Mercedes and Tesla.
• Valeo [82] is also a company that sells cameras for automotive applications that does
real-time monitoring of eye movement, eyelid movement, pupil position, head angle, and other key features. Drowsiness detection with integrated alarms is made combining this informa-tion with vehicle trajectory and tracking informainforma-tion.
• Plessey [83] product, imPulseTM, uses ECG signal, the signal acquired with a capacitive
sensor, WARDENTMsystem that doesn’t require skin contact. Drowsiness detection is made
by extracting HRV-based features. Also, WARDENTMsystem is easily incorporated inside
vehicle seatbacks to access the necessary biometric signals. Alike this last one, Harken, a public-private European consortium, created a system of real-time drowsiness monitoring of cardiac and respiratory rhythms using sensors incorporated in the seat cover and safety belt of a car.
The following companies already have products in the market:
• Mercedes and Volvo also self-developed systems of drowsiness detection. MERCEDES
Attention AssistTM [84] is a solution that integrates 90 indexes related to steering wheel
20 Literature Review
the system considers that the individual is fatigued, it will send an audible and visible alert letting the driver know it’s time to take a break. Volvo developed DAC, Driver Alert Control
[85], which is a camera-based method that determines ideal road trajectory and compares
it to steering wheel movements. When the system determines that the driver is in a drowsy state, it sends an alert. If the driving task is not improved, the alert is repeated.
• StopSleep [86] is a company from the UK that developed an anti-sleep ring, which uses
cuta-neous sensors measures electrodermal activity for fatigue detection, with integrated alarms.
• Wearvigo [87] developed a wearable, a smart headset, that uses over 20 parameters, like
blinks related measures, blink rates, blink durations and drooping eyelids for drowsiness detection. Also, uses an accelerometer and gyroscope for movements of the head measure-ment.
On other hand, other companies already have prototypes, however are still on investigation phase, like SafeCap and CardioID Technologies:
• SafeCap [88] is also another system developed by a Brazilian division of Ford, specifically
for truck drivers. The metric used for drowsiness detection is head movement detected with accelerometers and gyroscopes on a hat. If the driver is considered to be on a drowsy state, light, sound and vibration alarms are activated.
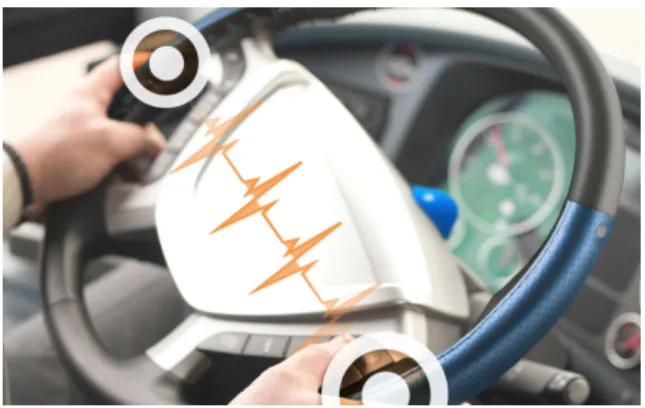
• CardioID Technologies is a Portuguese company that developed a system for drowsiness detection by ECG analysis. Cardiowheel [? ] is an Advanced Driver Assistance System for real-time continuous monitoring that uses sensors embedded in the steering wheel that by hand skin contact acquire the ECG. The steering wheel is customized with a special cover with conductive elements that allow acquisition of electrical impulses generated by the heart. This company also develops algorithms capable of monitoring multiple cardiac pathologies. Driver’s identity can also be extracted from the ECG signal.
2.3
Experimental setups
Datasets are a big key point on this kind of studies because the conditions they have acquired in influence the type of data and the reliability of the results. They are four types of experimen-tal setups for acquiring data related to driving task: driving simulators, test tracks, road studies, naturalistic driving studies.
2.3.1 Driving simulators
Driving simulators are systems that with computer generated gives the driver the feeling of sitting in a real car with real driving experience. Driving simulators have as great advantage allowing a safe environment for driving research, enabling a customization of a range of human factors
2.3 Experimental setups 21
related to driving problems. Furthermore, this simulator, because connected to digital computers,
provides an easier way to acquire and storage data. [89].
One of the biggest driving simulator centers is the Tongji University Advanced Driving behav-ior and Traffic Safety Research Simulator. This simulator, currently the most advanced in China, incorporates a fully instrumented Renault Megane III vehicle cab in a dome mounted on an 8
degree-of-freedom motion system [89].
The National Advanced Driving Simulator (NADS) simulation center developed NADS-1, the largest motion envelope of the US and the 2nd in the world in a driving simulation. The NADS-1 utilizes an actual vehicle cab and projects scenery 360 degrees around the driver on the interior walls of the dome that houses the cab. The vehicle cab is mounted on 4 independent actuators that provide vibration associated with driving on varying road surfaces. The entire dome is mounted on a motion base that can independently provide yaw, roll, pitch, turning, lateral and longitudinal
cues to the driver. All in all, the NADS-1 has a 13 degree-of-freedom motion base [90].
Sim IV is a driving simulator of the Swedish National Road and Transport Research Institute
(VTI). This simulator constitutes a really reliable and realistic simulation which provides a 210-degree forward field of vision driving experience, both longitudinal and lateral acceleration and
can simulate a passenger car and truck compartments [91].
CARRS-Q is the other system of driving simulation operational at the Centre for Accident
Research and Road Safety – Queensland. It operates with eight computers, three projectors and a
six degree of freedom (6DOF) motion platform that can move and twist in three dimensions [92].
Furthermore, CardioID Technologies makes use of a simulator [93] developed by the partners
of the present project at ISEL (Instituto Superior de Engenharia de Lisboa) and ULHT (Universi-dade Lusófona de Humani(Universi-dades e Tecnologias), this task aims at acquiring such data in an intuitive driving simulation environment, acquiring ECG, EEG and as visual information (video streams of the driver) data type. This simulator, in terms of hardware, includes:
• gamer-type personal computer;
• system with steering wheel, pedals and gearbox; • wide screen;
• biological signal acquisition system integrated in the steering wheel;
• sensor for capturing and tracking poses and gestures, such as Leap Motion or Intel Re-alSense;
• camera
Regarding software, it uses Unity3D game engine.
In addition, FEUP also conducted a project, AUTODRIVING, on which was developed a driv-ing simulator. The main goals of the project included studydriv-ing the driver’s activity and behaviour during the autonomous driving, the research of the takeover of vehicle control task under different
22 Literature Review
circumstances and identification of population groups’ understanding of the system functioning
[94].
2.3.2 Test tracks
Test tracks are made with instrumented vehicles in a controlled environment, allowing the adjust-ment of various variables, usually closed to public traffic, to guarantee safety.
2.3.3 Road Studies
On-road studies are controlled tests in a pre-determined road in a controlled time, however, the study goes on real-traffic. Also, there may be an experimenter in the car, someone who already knows the way. SleepEYE dataset was acquired on a study of this type. It is a collaborative project between Smart Eye, Volvo Cars and VTI (the Swedish National Road and Transport Research Institute) within the competence center Virtual Prototyping and Assessment by Simulation (ViP)
[5], database that will be further described in section3.2.
2.3.4 Naturalistic driving studies
These ones refer to tests that are made on real driving conditions, in every aspect: normal traffic and there is no experimenter on the car. To get reliable results, these type of study is conducted usually long-term. Also, the test route is not pre-defined, the driver is free to choose the way. This type of study has as an advantage containing a much larger range of situations and unpredictable events.
100-Car Naturalistic Driving Study is one example of a naturalistic driving study. This database contains information of 2,000,000 vehicle miles, almost 43,000 hours of data, 241 primary and secondary drivers, 12 to 13 months of data collection for each vehicle, and data from a highly
capable instrumentation system including five channels of video and vehicle kinematics[95].
Another study conducted by Australia Naturalistic Driving Study (ANDS) has the goal of understanding what people do when driving their cars in normal and safety-critical situations. This study was conducted with 360 volunteer drivers (180 from New South Wales and 180 from
Victoria) with a private vehicle equipped with a data collection system along 4 months [5].
CardioID Technologies and INESC-TEC also participated on a Naturalistic Driving Research,
acquiring ECG signals of one typical trip (350 km), during several typical workdays [9].
2.3.5 Application of experimental setups
The different types of experimental setups also have different applications and are more or less useful depending on the purpose. There are two main characteristics to be analyzed on each ex-perimental setup type: setup validity and degree of control. In fact, in some applications, it is important to consider if the data acquired will be transportable to the real-world conditions, mean-ing if they can be generalized for more situations rather than the ones from the study. On another
2.3 Experimental setups 23
hand, on more scientific studies, the degree of control of the study is a key aspect. Controlling the experiment reduces the risk of taking wrong conclusions or confounded results. Knowing all the variables, such as road type and participants, leads to a more reliable study because in this way one knows all the variables on which the results are dependent on. This way, control is needed for reliable repeatability within a reasonable time frame. On another hand, controlled environments reduce the risk of accidents during the study, which is important for ethical reasons.
Setup validity and the high degree of control are two parameters that are really difficult to conciliate. Analyzing the 4 types of experimental setups, simulator studies have a high degree of control however their setup validity is low, due to its controlled environment and selection of variables. In contrast, naturalistic driving studies have high setup validity because they are really close from real driving conditions, but due to its variability and unpredictability, has a low degree of control so it is not so reliable in scientific work when c compared to simulators. Road-studies and Test-tracks are in the middle of the last two, as road-study is made in a controlled environment but in real traffic conditions and test-tracks are controlled environment but in real roads without
traffic. Figure2.5illustrates the analysis of these two parameters of the four experimental setups
referred.
Chapter 3
A framework for driver drowsiness
monitoring
In this chapter a framework used for drowsiness detection will be described, including all the methodologies used and database description. Also, two different approaches of drowsiness pre-diction will be performed.
3.1
Generalized Framework for Drowsiness Detection
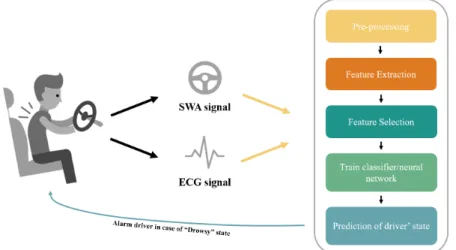
Drowsiness detection and classification problem followed a typical machine learning approach, as
described on Figure3.1. On this dissertation, the main goal was to understand if a multimodal
approach, by using signals of different nature such as ECG and SWA, would improve the general efficiency of a model for drowsiness detection on drivers. A conventional machine learning instead of a deep learning approach was chosen as the amount of data available was limited. Following this, the SleepEYE database was used for this work and it will be described on the following
section3.2.
Figure 3.1: Framework of Drowsiness detection based on Vehicle and ECG-based
26 A framework for driver drowsiness monitoring
Table 3.1: Start and end times for the driving sessions
Driving session Start End
Participant A alert 15:30 17:15
Participant B alert 17:45 19:30
Participant A sleep deprived 00:15 02:00
Participant B sleep deprived 02:45 04:30
3.2
SleepEye Database description
SleepEYE is a collaborative project between Smart Eye, Volvo Cars and VTI (the Swedish Na-tional Road and Transport Research Institute) within the competence center Virtual Prototyping and Assessment by Simulation (ViP). This database was provided by the Swedish National Road
and Transport Research Institute [5].
3.2.1 Participants
Twenty drivers (ten women) participated in the study. The participants were recruited based on a random sample from the Swedish register of vehicle owners. The main inclusion criteria were:
• Between 30 and 60 years old • Healthy
• Normal weight • No shift workers • No professional drivers
3.2.2 Procedure
The procedure is described on the Final Project of the SleepEYE project, "Camera-based
sleepi-ness detection" [5], as it will be presented on this subsection. Sleepiness and wakefulness forms
were sent to the participants before the experiment to be filled in the three nights and two days immediately prior to the experimental day. The participants were instructed to sleep at least 7 hours per night the three nights prior to the test. Two drivers participated each experimental day. The first participant arrived at 2 p.m. and the second at 4 p.m. When the participants arrived they were given written and oral information about the test and were then asked to fill in an informed consent form and a response form. They also had to show their driving license and to do a breath alcohol test. The test leader then applied electrodes for physiological measurements. Each partic-ipant took part in two driving sessions on each test occasion: the first was the alert condition and
the second was the sleep-deprived condition, Table3.1.
Each driving session lasted for about 90 min. The time between the sessions was spent at the laboratory, where the participants could read, watch TV etc. The participants were served dinner
3.2 SleepEye Database description 27
after the first driving session and fruits and sandwiches during the night. They were not allowed to eat or drink caffeine from 1 p.m. on an experimental day. The participants were instructed to drive as they would do in “real life”. However, while driving they were not allowed to speak, listen to the radio or do anything else that would counteract their sleepiness. During each driving session the participants rated their sleepiness level on the 9-grade Karolinska Sleepiness Scale (KSS) every five minute.
During the experiment, a test leader was sitting in the front passenger seat. The car had dual command and there was a small screen in front of the test leader showing the driver’s face so that the test leader could see if the participant closed his/her eyes. The test leader was responsible for the safety and was prepared to take control of the vehicle if the driver became too sleepy. However, the intention was not to let the driver fall asleep but to stop the driving session before the driver fell asleep. The test leader was also supposed to stop the driving session if the driver drove in a non-safe way, either because of sleepiness or of other reasons (e.g. exceeded posted speed limit). The participants were explicitly told not to exceed the posted speed limit. They were also told that they were allowed to stop for a break if they felt that it was necessary for their safety. If the driver chose to take a break, it was prescribed that the test leader would abort the current drive. After the sleep-deprived session, the electrodes were removed and the participants were sent home by taxi.
3.2.3 Test Route
Each driving session took 90 minutes on a road with approximately 2 x 79 km, on the E4 motorway from Linköping (exit 111) to Gammelsta (exit 128) and back. A 110 km/h posted speed limit was taxed during the whole route, except for a road section of 750 meters in Norrköping, where the
posted speed limit was 90 km/h.3.2.
Figure 3.2: Teste route: Motorway E4. The test route started at exit 111 in Linköping and the
turning point was at exit 128 in Gammelsta. Source: [5]
3.2.4 Data acquisition
SleepEYE database signals were acquired using a Volvo XC70 with an automatic gearbox in the described experiment. During the tests, there was a sign on the rear of the car with the text
![Figure 2.4: Heart-beat representation [4]](https://thumb-eu.123doks.com/thumbv2/123dok_br/15839189.1084087/36.892.264.583.313.542/figure-heart-beat-representation.webp)