.
Assessing the emission impacts of autonomous vehicles on
metropolitan freeways
Ricardo F. Tomás
a, Paulo Fernandes
a,*, Eloisa Macedo
a, Jorge M. Bandeira
a, Margarida C.
Coelho
aaDepartment of Mechanical Engineering / Centre for Mechanical Technology and Automation (TEMA), University of Aveiro, Campus Universitário de Santiago, 3810-193 Aveiro, Portugal
Abstract
While recent studies demonstrate the societal and economic benefits of driverless vehicles, little is known about the emission impacts of autonomous vehicles (AVs) in the context of mixed traffic. This paper explores the environmental impacts of AVs along an urban freeway corridor in a metropolitan area using Vehicle Specific Power (VSP) and EMEP/EEA emission methodologies paired with VISSIM traffic model. Three different AV penetration rates were implemented for through traffic along a freeway corridor in the city of Porto (Portugal) by considering long-term market predictions (10%, 20% and 30%). Afterwards, these scenarios were compared to current situation in terms of carbon dioxide, carbon monoxide, nitrogen oxides and hydrocarbon emissions, and travel time and stop-and-go situations. The emissions and traffic performance of each scenario were evaluated on three levels: a) overall study domain; b) corridor; c) impact of AVs on conventional vehicles (CVs). AVs yielded small savings in emissions in the overall study domain for automation levels below 30% (differences in traffic performance and emissions were not statistically significant). Corridor-level analysis showed decreases of 5% in emissions can be expected with AVs technology, but it penalizes travel time up to 13% for both AV and CV, when compared to the existing situation.
© 2020 The Authors. Published by Elsevier B.V.
Peer-review under responsibility of the scientific committee of the 22nd EURO Working Group on Transportation Meeting. Keywords: Autonomous Vehicles; Mixed Traffic; Freeway Corridors; Emissions.
1. Introduction and Research Objectives
In 2016, approximately 33% of energy consumed in European Union (UE-28) was due to the transport sector (EEA, 2019). Road transport accounts for the largest share of energy consumption, with 74% of the total European Environmental Agency member countries (EEA-33) transport demand in 2016 (EEA, 2019). The development of Intelligent Transport Systems (ITS) has been supporting the autonomous vehicles (AV) technology whose progress has been incremental, and it also has been prompting a shift in strategy among automotive industry. AV technology has the potential to reduce congestion costs, allow for more productive use of time spent in vehicles, reduce energy
consumption and land use (Bagloee et al., 2016; van den Berg and Verhoef, 2016), and have a wider societal impact in the long-term, on social equity, public health and safety (Milakis et al., 2017; Nieuwenhuijsen et al., 2018).
The impacts of AVs on the interaction between land use and conventional traffic can be complex (Soteropoulos et al., 2019). Since AVs are not yet available to the public at large, studies in the literature have applied simulation tools to analyse their impacts on travel behaviour and land use (Correia et al., 2016; Friedrich, 2016). Unlike many drivers, AV will not violate speed limits, which could be beneficial for fuel consumption. AV can also influence vehicle operational characteristics through various mechanisms, such as reducing distance between cars, acceleration and deceleration characteristics, longitudinal and lateral behaviour or gap acceptance thresholds, which in turn can reduce emissions levels (Stogios et al., 2018).
However, a deeper analysis of driving behaviour parameters in simulation traffic models is needed in order to represent the potential behaviour of AV operation, particularly those parameters with most impacts on vehicular emissions. The research conducted on energy and emissions has been raising some doubts about the benefits of AV (Eilbert et al., 2018; Igliński and Babiak, 2017; Stogios et al., 2018; Wang et al., 2018; Xie et al., 2017) in the context of mixed traffic. Also, they were mostly focused in limited size study domains. Bichiou and Rakha (2019) developed a model to optimize the movement of AVs at roundabouts, traffic lights and stop-controlled intersections. Despite the
reductions in carbon dioxide (CO2) emissions by 43%, the study discarded AVs impacts on local pollutants. Liu et al.
(2017) quantified the potential emission impacts of replacing human-controlled vehicles by AVs using data from Austin-specific driving habits. They found that average reductions in emissions ranged from 7% to 19% (depending on the pollutant) after AVs implementation.
The review of relevant literature on the research topic of AV covers the potential impact of this advanced technology in terms of traffic congestion, safety or travel behaviour, as well as some potential benefits on energy consumption and emissions. Little is known about the performance and emission impacts of AVs on conventional traffic (CV) both at network-level and corridor-level analyses. If AVs fleet increases, and traffic volumes are significant, then CV travel time and emissions (for some pollutants) may be increased. This can be more evident during peak hours when many drivers simultaneously use the limited supply of road infrastructure.
This research addressed the traffic performance and environmental impacts of AVs along an urban freeway corridor in a metropolitan area using a modelling platform of traffic and emissions methodologies. This explanatory study sought to contribute for a better understanding of future AV share distributions scenarios for both traffic performance
(travel time and stop-and-go situations) and CO2, monoxide carbon (CO), nitrogen oxides (NOX) and hydrocarbon
(HC) emissions on congested freeways. Also, it allows for solid knowledge about the differences in traffic-related impacts between AV and CV, and for incorporation in eco-routing algorithms to govern AV operations. The methodology used here could be used to incorporate realistic driving strategies of AVs into current traffic simulation models in management of traffic and emissions.
2. Methodology
The methodology used a microsimulation framework to assess traffic performance and emissions at a freeway level for implementation of future AV mobility scenarios. It proceeded in three steps. First, the VISSIM (PTV AG, 2016) was used to code and evaluate the case study followed by calibration and validation for the baseline scenario (only CV). Third, different AV market share scenarios (Nieuwenhuijsen et al., 2018) were compared. For each scenario, emissions were estimated using VSP (US EPA, 2002) and EMEP/EEA (EEA, 2013) methodologies.
2.1. Site selection and data collection
The case study is located in the city of Porto (Portugal) which belongs to a metropolitan area with 1.72 million inhabitants (Statistics of Portugal, 2018), as depicted in Fig. 1. According to the TomTom data in 2016, this city had more than 15 hotspot delay locations, being the second city in the national ranking where drivers spent more time in traffic (~31 minutes), namely in the afternoon peak periods (6:00-7:00PM) (TOMTOM, 2018). Considering the above-mentioned facts, this road network is an interesting case for studying environmental impacts of AV selection methods with incorporation of autonomous mobility. The candidate freeway (blue segments in Fig. 1) is a stretch (~9km in length) of the Via de Cintura Interna (VCI), 8 interchanges, 3-4 lanes by travelling direction, posted speed limit of 80
km/h and an average daily traffic (ADT) ranged from 113 680 to 149 520 (IMT, 2019).
Traffic flow data were obtained from Porto Municipality during typical weekdays in April 2016 (24 h period in 5 min-intervals), in 50 monitoring points along the study domain. ADT volumes for the candidate freeway, and A3, A28 and N14 roads (see Fig. 1) were retrieved from the Institute for Mobility and Transport (IMT, 2017). The period between 6:00-7:00PM was selected for the analysis since loop detectors showed this peak period as the one with highest traffic volumes. Travel times were recorded in the baseline site using a probe Light Duty Vehicle equipped with Global Navigation Satellite System (GNSS) which performed different routes along the study domain in evening peak periods. A total 100 km of vehicle dynamic data were collected and extracted for this research.
Fig. 1 Studied Study Domain with the identification of the urban freeway (blue). Background Map Source [Open Street Maps].
2.2. Site selection and data collection
To understand emission and traffic performance impacts of AVs, the VISSIM9.0 tool was used (PTV AG, 2016). This microscopic traffic model allows 1) exporting full disaggregated vehicle trajectory files that can be used to assess emission impacts; 2) modelling different driving behaviour parameters according to the type of road, vehicle type (e.g., AV) [see (Songchitruksa et al., 2016; Zeidler et al., 2019)] and traffic control; and 3) identifying hotspot emission locations at high spatial and temporal resolutions.
The microsimulation model was calibrated and validated for the 1.5-hour period, from 5:7:00PM, with a 30-min warm up time. The maximum speed distributions for CV ranged from 75 km/h to 90 km/h on VCI to ensure a representation of driving behaviour as realistic as possible. VISSIM was calibrated by changing driving behaviour and examining their effect on traffic volumes for each link (Antoniou et al., 2014). VISSIM uses Wiedemann 74 and Wiedemann 99 models to capture the physical and the human components of traffic, which is based on a psychophysical car-following model (PTV AG, 2016). Wiedemann 99 was used for this research as it offers more parameters available to consider in the CV and AV driving behaviours, and it has lane-change parameters (e.g., minimum headway and safety distance) that can be modified to reproduce traffic operations (PTV AG, 2016). The modifiable longitudinal driving behaviour parameters (labelled CC0-CC9) correspond to the driving characteristics of the four driving states: free-flow, approaching, following, and braking (PTV AG, 2016).
Table 1 shows the ten driving behaviour parameters deemed relevant to represent driving characteristics of a potential computer operated system (such as that of an AV). The values, which were based on literature review (Atkins, 2016; Stogios et al., 2018), were previously optimized for AVs maximum speed of 80 km/h and following an emission criterion. CV driving behaviour parameters in Table 1were obtained after model calibration.
Table 1. Summary of the driving behaviour parameters used for CV and AV driving (PTV AG, 2016; Stogios et al., 2018)
Type Parameter CV AV A 3 N 1 4 126 520 149 520 113 680 147 750 103 780 140 830 145 200 A28 N14 A3 1km
Car Following CC0 – Standstill distance [meters] 1.50 1.47
CC1 – Headway Time [seconds] 0.90 0.50
CC3 – Threshold for entering ‘Following’ [seconds] -8.0 -13.54 CC4/CC5 – ‘Following’ thresholds [m/s] -0.35/0.35 -0.13/0.13 CC7 – Oscillation Acceleration [m/s2] 0.25 0.08
CC8 – Standstill Acceleration [m/s2] 3.50 3.72
CC9 – Acceleration at 80 km/hr [m/s2] 1.50 1.60 Lane Changing MinHdwy: Minimum headway (front/rear) [meters] 0.50 0.70 SDRF: Safety Distance Reduction Factor (lane change) 0.60 0.21
The Geoffrey E. Havers (GEH) was used to measure the goodness of fit (Ciuffo et al., 2012). Global origin-destination demands (between centroids) were also adjusted to match field data. Validation compared simulated traffic volumes with loop detectors data (different from the calibration data) using above CV calibrated parameters. Since VISSIM is stochastic in nature, 10 simulation outputs were averaged (Fries et al., 2017).
2.3. Emission methodology
The VSP methodology (US EPA, 2002) was used to estimate the CO2, CO, NOX and HC emissions of light duty
and commercial vehicles, and buses for the following reasons: 1) it accounts with high resolution time (one second) changes in vehicle dynamics; 2) the instantaneous power per unit mass of vehicle takes into account aerodynamic drag, speed, acceleration, road grade, and rolling distance effects; and 3) the vehicle specific power is highly correlated with variability in emissions in passenger gasoline (Anya et al., 2013) and diesel (Coelho et al., 2009) vehicles, light commercial diesel vehicles (Coelho et al., 2009), diesel buses (Zhai et al., 2008) and hybrid passenger vehicles (Zhai et al., 2011). The VSP formula (US EPA, 2002) to specific case of a typical light duty vehicle, i.e., passenger gasoline car (GPC), passenger diesel car (DPC) and light commercial diesel vehicle (LCDV) is given by:
(
)
(
)
3. 1.1. 9.81.sin arctan 0.132 0.000302.
VSP=v a+ grade + + v (1) where v is the vehicle instantaneous speed (m/s), a is the vehicle instantaneous acceleration or deceleration (m/s2)
and the grade is Terrain gradient (decimal fraction).
VSP values are typically grouped in combinations of 1 kW/ton from −50 to +50. Then, these values are categorized in 14 modes so that each mode generates an average CO2, CO, NOX and HC emission rate (US EPA, 2002).
Concerning transit buses, VSP is estimated using typical coefficient values and expressed as follows:
(
)
3. 9.81.sin 0.092 0.00021.
VSP=v a + grade + + v (2) In such cases, VSP combinations are grouped in 8 modes that correspond to values ranging from −30 to 30 kW/ton
(Zhai et al., 2008). To obtain emissions estimates for HDV (CO2, CO, NOX and HC), the EMEP/EEA method was
used (EEA, 2013). It uses emission factors for diesel HDV with different emission standards and engine capacities as a function of the speed range intervals (EEA, 2013). A GUI application in MATLAB was conceived to compute second-by-second vehicle dynamic data and road slope from VISSIM output (~110 million of records), then emissions were computed by vehicle type. LDV emissions were based on the following local car fleet: 39% PGC, 40% PDC and 21% LCDV (EMISIA, 2017). Heavy Duty Vehicles represented near 4% of site-specific traffic.
2.4. Operational Scenarios
Four operational scenarios were applied under the assumption that LDV through traffic (~4 000 vehicles per hour by direction) along the candidate freeway was replaced by different AV penetration rates. The considered scenarios were: baseline (only CV), 10% (AV10), 20% (AV20) and 30% (AV30) of AVs. These rates are based on market share estimates for 2025, as suggested by Nieuwenhuijsen et al. (2018). AV were modelled by creating a distinct vehicle
composition and considering the driver behaviour settings in Table 1. The emissions and traffic performance of each scenario were evaluated in terms: 1) overall study domain; 2) freeway; and 3) AVs impact on CVs.
3. Results and Discussion
3.1. Calibration and Validation
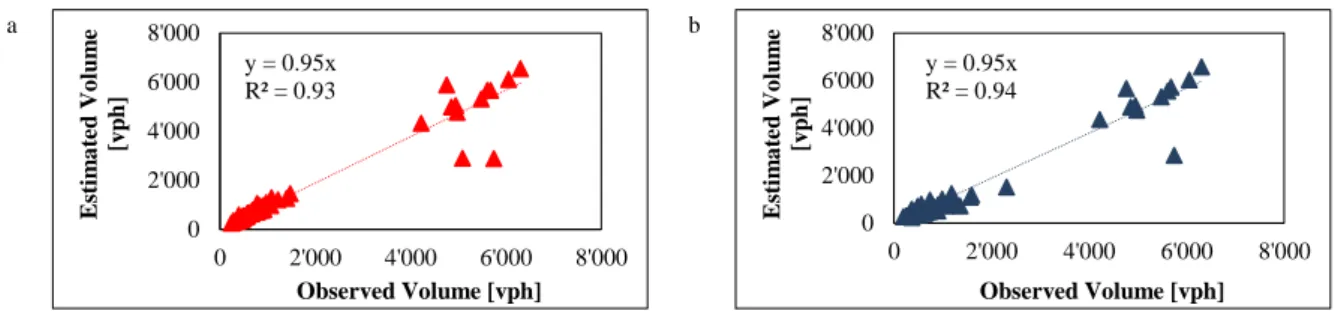
Fig. 2 a-b exhibits the calibration and validation results for the baseline scenario. Results indicated that, under high traffic volumes, VISSIM yielded lower values than field data, particularly in VCI weaving sections with closely spaced ramps. This happened because simulated vehicles tended to change lane from freeway to the exit ramp in the last minute, thus forcing other vehicles to stop. To mitigate these issues, specific driving behaviour parameters such as look ahead and back distances, and CC1 (PTV AG, 2016) were adjusted during calibration, since they showed to be the main parameters impacting driving behavior at those sections. Despite these differences, Fig. 2 a-b shows high coefficient of determination (R2 > 0.90), and proper suggested calibration target for traffic (Yu and Fan, 2017), i.e.,
GEH values lower than 4 in 87% of monitoring points.
a b
Fig. 2. Evaluation of VISSIM model (a) Calibration; (b) Validation.
3.2. Impacts of AV on site-specific emissions and traffic performance
Table 2 compares the energy, pollutant emissions and traffic performance by scenario with baseline scenario. The
findings of the AV10 and AV20 confirmed small improvements in the overall study domain; CO2 per unit distance,
absolute emissions and traffic performance were found to be not statistically significant at the 5% significance level. AV30 showed as the best mobility scenario for the study domain. It had average emissions reductions of about 3%, while the number of stops decreased by more than 15%. The impacts of AV on main traffic outputs were more
significant in VCI than in the overall study domain. Specifically, CO2 per unit distance decreased up to 5% in AV10
while the average decrease in absolute emissions ranged from 3% to 5% between AV10 and AV30. Although travel time increased with AV (10% to 13%, depending on the scenario), the number of stops might be reduced in almost
40% compared to the baseline scenario. It must be also stressed that VCI accounted approximately 25% of CO2, CO
and NOX emissions of the overall study domain.
From the results reported on Table 2, it can be observed that vehicles generated high CO2 per unit distance in all
scenarios. This is mostly explained by moderate HGV and buses traffic volumes (together they represented 8% of traffic composition), as well as some congestion situations at the entrances and exits of VCI. With these concerns in
mind, Fig. 3 a-b exhibits the hotspot CO2 emissions locations in the baseline and AV30 scenarios. It can be noted that
the influence areas of traffic lights and the main interchanges along the study domain presented the highest CO2 per
unit distance (40% higher than the average corridor value) in the baseline scenario. Despite its lower CO2 emissions
per unit distance, AV30 had more links with red colors along the VCI. These areas yielded 35% more CO2 emissions
than the average scenario value. This happened because AVs drive at constant speeds, thereby causing longer waiting times for CV on the left lanes while they are waiting for a gap to leave VCI.
y = 0.95x R² = 0.93 0 2'000 4'000 6'000 8'000 0 2'000 4'000 6'000 8'000 E st im a te d V o lu m e [v p h ] Observed Volume [vph] y = 0.95x R² = 0.94 0 2'000 4'000 6'000 8'000 0 2'000 4'000 6'000 8'000 E st im a te d V o lu m e [v p h ] Observed Volume [vph]
Table 2. Variation of emissions and traffic performance parameters per location in relation to the baseline scenario
Area Scenario Energy Emissions Traffic Performance
CO2 (g/km) CO2 (ton) CO (kg) NOX (kg) HC (kg) Average Travel Time (s) Average Stops Overall Study Domain Baseline 319.7 33.0 49.6 141.3 3.0 352.7 7.4 AV10 0.3% 0.1% -0.2% 1.0% 0.3% -0.3% -3.7% AV20 -1.1% -1.0% -0.1% -1.4% -1.8% -2.5% -16.2% AV30 -0.2% -1.8% -2.9% -2.4% -2.4% -3.2% -22.7% VCI Baseline 246.1 7.6 12.0 33.4 0.4 323.9 6.4 AV10 -5.1% -3.4% -1.9% -1.5% 1.6% 12.9% -11.7% AV20 -2.1% -1.2% -5.8% -5.0% -3.5% 12.5% -9.7% AV30 -2.8% -3.7% -6.1% -5.2% -5.6% 10.3% -37.3%
Average values using 10 random seed runs; shadow cells indicate that the difference between AV and baseline scenario output measure was statistically significant (p-value<0.05)
a b
Fig. 3. Hotspot CO2 emissions location in g per kilometre (a) Baseline (b) AV30. Background Map Source [Bing Maps].
3.3. Impacts of AV on CV
AV impacts on CV outputs are exhibited in Fig. 4a-b. It is important to outline that local emissions per unit distance notably decreased with implementation of AV20 and AV30 scenario (up to 8% and 5%, respectively, depending on
the pollutant). CO2 emissions per unit distance slightly decreased in both AV10 and AV20 but increased in AV30,
thereby confirming the hypotheses of this article. The implementation of AV also resulted in travel time increases up to 4%, while the number of CV stops were predicted to be reduced in more than 25% compared to the existing conditions. These findings allow to conclude that the increase of AV rates in the freeway may result in higher travel times for conventional traffic, even though that the number of stop-and-go situations decreased.
a b
Fig. 4. Variation of CV outputs in relation to the baseline (a) Emissions per unit distance (b) Traffic Performance. -9%
-6% -3% 0% 3%
AV10 AV20 AV30
CO2/km CO/km NOX/km HC/km
-30% -20% -10% 0% 10%
AV10 AV20 AV30
Travel Time Average Stops
CO2<200 200<CO2<400 400<CO2<600 CO2>600 1 km 1 km 200<CO2<400 400<CO2<600 CO2>600 CO2<200
4. Conclusions
This paper explored the impacts of AVs on emissions and traffic performance along a metropolitan road network. A microscopic traffic model was integrated with two emission models to assess the consequences of replacing CVs along an urban freeway corridor by 10%, 20% and 30% of AVs.
Results indicated that the replacement of CVs by 10% and 20% AVs was rather small on the overall study domain (differences in traffic performance and emissions outputs showed to be not statistically significant). Although the findings obtained at the VCI showed moderate emissions reductions (3% to 5%, depending on the scenario), AV resulted in higher travel time for both VCI and CV operations compared to actual conditions.
The knowledge gained from the assessment of AV on a real-world metropolitan freeway is promising since its potential benefits and drawbacks were predicted for a transition phase scenario from traditional vehicles to autonomous vehicles. It is worth noting that the findings of this study are limited to the traffic and emission models for which the comparison is made. Therefore, it included several assumptions that derived in the following limitations, namely: i) AV driving behaviour parameters were static and based on very specific freeway characteristics (i.e., 80 km/h of maximum speed), which restricted its use to other freeways with different maximum speeds or driving habits;
ii) analysis centred on a short time period (one hour), which did not allowed for solid conclusions about AV impacts; iii) driving behaviour parameters of the traffic model that can resulted in underestimated emission values; and iv)
exhaust emission were not validated against field data so that output values may not represent in depth site-specific conditions.
Future studies should address the impacts of the implementation of AV to the overall study domain, and higher penetration rates (>30%). Since platooning has demonstrated benefits on emission performance of transport systems, the incorporation of special conceived algorithms for governing AV behaviour would be desirable.
Acknowledgements
The authors acknowledge IT-Porto, for providing the traffic data, and the financial support of the following projects: TEMA – CENTRO 01-0145-FEDER-022083; Strategical Project UID/EMS/00481/2013 (FCT-Portuguese Science and Technology Foundation); @CRUiSE project (PTDC/EMS-TRA/0383/2014), funded within Project 9471 – Reforçar a Investigação, o Desenvolvimento Tecnológico e a Inovação and supported by European Community Fund FEDER; MobiWise (P2020 SAICTPAC/0011/2015), co-funded by COMPETE2020, Portugal2020 - Operational Program for Competitiveness and Internationalization (POCI), European Union’s ERDF (European Regional Development Fund), and FCT; CISMOB (PGI01611, funded by Interreg Europe Programme); DICA-VE 01-0145-FEDER-029463), Driving2Driverless 01-0145-FEDER-031923) and inFLOWence (POCI-01-0145-FEDER-029679) projects funded by FEDER through COMPETE2020 - Programa Operacional Competitividade e Internacionalização (POCI), and by national funds (OE), through FCT/MCTES.
References
Antoniou, C., Barcelo, J., Brackstone, M., Celikoglu, H.B., Ciuffo, B., Punzo, V., et al., 2014. Traffic Simulation: Case for guidelines, Joint Research Centre, Ispra (VA), Italy, Available from:
http://publications.jrc.ec.europa.eu/repository/bitstream/JRC88526/2014_multitude_guidelines_on-line.pdf.
Anya, A.R., Rouphail, N.M., Frey, H.C., Liu, B., 2013. Method and Case Study for Quantifying Local Emissions Impacts of Transportation Improvement Project Involving Road Realignment and Conversion to Multilane Roundabout. 92nd Annual Meeting, Transportation Research Board, Washington, DC, US, Paper 13-5243.
Atkins, 2016. Research on the Impacts of Connected and Autonomous Vehicles (CAVs) on Traffic Flow - Stage 2: Traffic Modelling and Analysis Technical Report, UK Department for Transport, Available from
https://assets.publishing.service.gov.uk/government/uploads/system/uploads/attachment_data/file/530093/impacts-of-connected-and-autonomous-vehicles-on-traffic-flow-technical-report.pdf.
Bagloee, S.A., Tavana, M., Asadi, M., Oliver, T., 2016. Autonomous vehicles: challenges, opportunities, and future implications for transportation policies. Journal of Modern Transportation, 24(4), 284-303
Bichiou, Y., Rakha, H.A., 2019. Real-time optimal intersection control system for automated/cooperative vehicles. International Journal of Transportation Science and Technology, 8(1), 1-12
Ciuffo, B., Punzo, V., Montaninoc, M., 2012. The calibration of traffic simulation models - Report on the assessment of different goodness of fit measures and optimization algorithms, Joint Research Centre, Ispra (VA), Italy, Available from:
Coelho, M.C., Frey, H.C., Rouphail, N.M., Zhai, H., Pelkmans, L., 2009. Assessing methods for comparing emissions from gasoline and diesel light-duty vehicles based on microscale measurements. Transportation Research Part D: Transport and Environment, 14(2), 91-99. Correia, G.H., Milakis, D., Arem, B.v., Hoogendoorn, R., 2016. Handbook on Transport and Urban Planning in the Developed World,. Vehicle
Automation and Transport System Performance. Edward Elgar Pub, Cheltenham, UK.
EEA, 2013. EMEP/EEA air pollutant emission inventory guidebook: Exhaust emissions from road transport.
EEA, 2019. Final energy consumption by sector and fuel, January, 2019 [cited March 2019], European Environmental Agency, Copenhagen, Denmark, Available from https://www.eea.europa.eu/data-and-maps/indicators/final-energy-consumption-by-sector-9/assessment-4. Eilbert, A., Jackson, L., Noel, G., Smith, S., 2018. A Framework for Evaluating Energy and Emissions Impacts of Connected and Automated
Vehicles Through Traffic Microsimulations. 97th Annual Meeting of the Transportation Research Board, Washington, DC, United States, paper 18-06134.
EMISIA, 2017. COPERT Countries data. from http://emisia.com/products/copert-data. Accessed May 16, 2017.
Friedrich, B. 2016. T The Effect of Autonomous Vehicles on Traffic. In M. Maurer, J. C. Gerdes, B. Lenz & H. Winner (Eds.), Autonomous Driving: Technical, Legal and Social Aspects (pp. 317-334). Berlin, Heidelberg: Springer Berlin Heidelberg.
Fries, R, Qi, Y., Leight. S., 2017. How many times should I run the Model? Performance Measure Specific Findings from VISSIM models in Missouri. 96th Annual Meeting of the Transportation Research Board, Washington, DC, US, paper 17-00470.
Igliński, H., Babiak, M., 2017. Analysis of the Potential of Autonomous Vehicles in Reducing the Emissions of Greenhouse Gases in Road Transport. Procedia Engineering 2017, 192: 353-358.
IMT, 2017. Relatório de Tráfego na Rede Nacional de Auto-Estradas [In Portuguese], Portuguese Institute for Mobility and Transport. Available from
http://www.imt- ip.pt/sites/IMTT/Portugues/InfraestruturasRodoviarias/RedeRodoviaria/Relatrios/Relat%C3%B3rio%20de%20Tr%C3%A1fego%20-%201%C2%BA%20Trimestre%20de%202017.pdf, November 11, 2018.
IMT, 2019. Relatório de Tráfego na Rede Nacional de Auto-Estradas [In Portuguese], Portuguese Institute for Mobility and Transport. Available from
http://www.imt- ip.pt/sites/IMTT/Portugues/InfraestruturasRodoviarias/RedeRodoviaria/Relatrios/Relat%C3%B3rio%20de%20Tr%C3%A1fego%20-%204%C2%BA%20Trimestre%20de%202018.pdf, April 11, 2019
Liu, J., Kockelman, K.M., Nichols, A., 2017. Anticipating the emissions impacts of smoother driving by connected and autonomous vehicles, using the moves model. 96th Annual Meeting of the Transportation Research Board, Washington, DC, US, paper 17-00471
Milakis, D., van Arem, B., van Wee, B., 2017. Policy and society related implications of automated driving: A review of literature and directions for future research. Journal of Intelligent Transportation Systems, 21(4), 324-348.
Nieuwenhuijsen, J., Correia, G.H., Milakis, D., van Arem, B., van Daalen, E., 2018. Towards a quantitative method to analyze the long-term innovation diffusion of automated vehicles technology using system dynamics. Transportation Research Part C: Emerging Technologies, 86, 300-327.
PTV AG, 2016. PTV VISSIM 9 User Manual: Planung Transport Verkehr AG, Karlsruhe, Germany.
Songchitruksa, P., Bibeka, A., Lin, L., Zhang, Y. 2016. Incorporating Driver Behaviors Into Connected and Automated Vehicle Simulation, . Texas A&M Transportation Institute, Center for Advancing Transportation Leadership and Safety, ATLAS-2016-13, Available from: https://rosap.ntl.bts.gov/view/dot/30917.
Soteropoulos, A., Berger, M., Ciari, F., 2019. Impacts of automated vehicles on travel behaviour and land use: an international review of modelling studies. Transport Reviews, 39(1), 29-49.
Statistics of Portugal, 2018. Resident persons (No.) in family nuclei by Place of residence. Available from https://ine.pt. Accessed July 12, 2017 Stogios, C., Saleh, M., Ganji, A., Tu, R., Xu, J., Roorda, M.J., Hatzopoulou, M., 2018. Determining the Effects of Automated Vehicle Driving
Behavior on Vehicle Emissions and Performance of an Urban Corridor. 97th Annual Meeting of the Transportation Research Board , Washington, DC, United States, paper 18-01741.
TOMTOM, 2018. Traffic congestion statistics for Porto based on TomTom's historical database for 2016.Available from: https://www.tomtom.com/en_gb/trafficindex/city/porto
US EPA, 2002. Methodology for developing modal emission rates for EPA’s multi-scale motor vehicle & equipment emission system. (Prepared by North Carolina State University for US Environmental Protection Agency, EPA420, Ann Arbor, MI).
van den Berg, V.A.C., Verhoef, E. T., 2016. Autonomous cars and dynamic bottleneck congestion: The effects on capacity, value of time and preference heterogeneity. Transportation Research Part B: Methodological, 94, 43-60.
Wang, A., Stogios, C., Gai, Y., Vaughan, J., Ozonder, G., Lee, S., Hatzopoulou, M., 2018. A Automated, electric, or both? Investigating the effects of transportation and technology scenarios on metropolitan greenhouse gas emissions. Sustainable Cities and Society, 40, 524-533. Xie, Y., Zhang, H., Gartner, N.H., Arsava, T., 2017. Collaborative merging strategy for freeway ramp operations in a connected and autonomous
vehicles environment. Jounral of Intelligent Transportation Systems, 21, 136-147.
Yu, M., Fan, W., 2017. Calibration of microscopic traffic simulation models using metaheuristic algorithms. International Journal of Transportation Science and Technology, 6(1), 63-77.
Zeidler, V., Buck, H. S., Kautzsch, L., Vortisch, P., Weyland, C. M., 2019. Simulation of Autonomous Vehicles Based on Wiedemann's Car Following Model in PTV Vissim. 98th Annual Meeting of the Transportation Research Board, Washington, DC, US, paper 19-02482. Zhai, H., Frey, H.C, Rouphail, N. M., 2011. Development of a modal emissions model for a hybrid electric vehicle. Transportation Research Part
D: Transport and Environment, 16(6), 444-450.
Zhai, H., Frey, H. C., Rouphail, N. M., 2008. A Vehicle-Specific Power Approach to Speed- and Facility-Specific Emissions Estimates for Diesel Transit Buses. Environmental Science & Technology, 42(21), 7985-7991.
![Fig. 1 Studied Study Domain with the identification of the urban freeway (blue). Background Map Source [Open Street Maps]](https://thumb-eu.123doks.com/thumbv2/123dok_br/15811707.1080559/3.816.121.697.257.534/studied-study-domain-identification-freeway-background-source-street.webp)