Diogo Filipe Monrroy Vilan e Melo
Licenciado em BioquímicaStructure based reaction mechanism
studies on periplasmic nitrate reductase
Dissertação para obtenção do Grau de Mestre em Bioquímica
Orientador: Dra.
Catarina Coelho, UCIBIO, FCT/UNL
Co-orientador: Prof. Maria João Romão, UCIBIO,
FCT/UNL
Júri:
Presidente: Prof. Dr. Ricardo Franco, FCT/UNL Arguente(s): Dr. José Artur Brito, ITQB/UNL
Vogal(ais): Dra. Catarina Coelho,
UCIBIO, FCT/UNL
Sep. 2017Diogo Filipe Monrroy Vilan e Melo
Licenciado em Bioquímica
Structure based reaction mechanism
studies on periplasmic nitrate reductase
Dissertação para obtenção do Grau de Mestre em Bioquímica
Orientador: Dra.
Catarina Coelho, UCIBIO, FCT/UNL
Co-orientador: Prof. Maria João Romão, UCIBIO,
FCT/UNL
Júri:
Presidente: Prof. Dr. Ricardo Franco, FCT/UNL Arguente(s): Dr. José Artur Brito, ITQB/UNL
Vogal(ais): Dra. Catarina Coelho,
UCIBIO, FCT/UNL
Set. 2017“Structure based reaction mechanism studies on periplasmic nitrate reductase”
―Copyright‖ em nome de Diogo Filipe Monrroy Vilan e Melo, da FCT/UNL e da UNL
A Faculdade de Ciências e Tecnologia e a Universidade Nova de Lisboa têm o direito, perpétuo e sem limites geográficos, de arquivar e publicar esta dissertação através de exemplares impressos reproduzidos em papel ou de forma digital, ou por qualquer outro meio conhecido ou que venha a ser inventado, e de a divulgar através de repositórios científicos e de admitir a sua cópia e distribuição com objectivos educacionais ou de investigação, não comerciais, desde que seja dado crédito ao autor e editor.
A
GRADECIMENTOS
Agradeço em primeiro lugar à minha orientadora, Catarina Coelho. Foi ela quem teve mais influência em mim e na minha aprendizagem durante este ano que foi sem dúvida, o período de tempo em que mais aprendi até à data (e agradeço a paciência que teve em alguns dos momentos). Foi também o ano em que eu percebi e decidi, querer ser um cristalógrafo!
Agradeço também à minha co-supervisora, Maria João Romão. Sempre que esteve presente colocou-me questões bastante pertinentes que me ajudaram ao longo do percurso, e teve sempre uma atitude extremamente positiva e motivadora.
Agradeço a todas as pessoas do grupo Xtal, ajudaram-me sempre que eu precisei. Agradeço em especial àqueles que contribuíram diretamente para o meu trabalho: Filipe Freire, Cecília Bonifácio, Márcia Correia e Francisco Leisico.
Agradeço à Rita Fernandes e ao meu irmão Ricardo Melo, foram sem dúvida o maior apoio que eu tive durante este ano, em alguns momentos muito difícil. Agradeço muito à minha família, nomeadamente aos meus pais Raul Melo e Paula Vilan, ao José Boieiro, aos meus avós Helena Vilan, Carlos Vilan, Júlia Melo e Francisco Melo. Contribuíram com apoio emocional incondicional, conselhos sábios e apoio financeiro; sem os quais não me teria sido possível seguir este caminho, e poder viver a aventura que me espera para os próximos anos.
“One should bear in mind that a macromolecular refinement against a high resolution data is never finished, only abandoned.”
I
A
BSTRACT
The Periplasmic Nitrate Reductase (Nap) from Cupriavidus necator (Cn) belongs to the Dimethyl Sulfoxide (DMSO) Reductase family of mononuclear Mo-containing enzymes and catalyzes the reduction of nitrate to nitrite. The protein comprises a large catalytic subunit containing the Mo active site and one [4Fe-4S] cluster (NapA, 91kDa), and a small diheme c-type cytochrome subunit (NapB, 17kDa). In the present dissertation, the reaction mechanism of the Periplasmic Nitrate Reductase from Cupriavidus necator is studied by X-Ray Crystallography and complementary techniques like Thermal Shift Assays (TSA), Isothermal Titration Calorimetry (ITC) and Microscale Thermophoresis (MST).
In the first crystallographic studies of Nap from Desulfovibrio desulfuricans (Dd), it was established that in the active site, the Mo atom was coordinated by two cis-dithioline groups, a sulfur from a cysteine side chain and a water/hydroxo ligand. Recently published crystal structures of Nap, particularly the structure of the heterodimeric Cn NapAB solved at high resolution (1.5 Å) and Dd NapA with bound ligands demonstrated that the sixth ligand is in fact a sulfur atom, contrary to the previous believed water/hydroxo ligand. Also, a partially reduced NapAB Cn crystal structure was obtained, where the coordinating Mo Cys thiolate is partially occupying a new conformation. The sixth sulfur ligand seems to have a partial disulfide bond with the Cys thiolate group, blocking nitrate from interacting directly with the Mo atom unless some rearrangement occurs during catalysis.
Various crystal structures of NapAB from Cn co-crystallized with ligands are presented in this dissertation complemented by TSA, ITC and MST results. The results corroborate the existence of an alternate conformation of the coordinating Mo Cys thiolate and pave the way for more studies about the reaction mechanism of nitrate reductases.
III
R
ESUMO
A nitrato reductase periplasmática (Nap) de Cupriavidus necator (Cn) pertence à família da Dimetil Sulfóxido (DMSO) Redutase de enzimas mononucleares de Mo e catalisa a redução de nitrato a nitrito. A proteína contém uma grande subunidade catalítica que contém o centro ativo de Mo e um centro [4Fe-4S] (NapA, 91kDa) e uma pequena subunidade de citocromo dihémica tipo c (NapB, 17kDa). Na presente dissertação, o mecanismo de reacção da nitrato redutase periplasmática de Cupriavidus necator é estudada por Cristalografia de Raios-X e técnicas complementares como “Thermal Shift Assays” (TSA), “Isothermal Titration Calorimetry” (ITC) and “Microscale Thermophoresis” (MST).
Nos primeiros estudos cristalográficos da Nap de Desulfovibrio desulfuricans (Dd), estabeleceu-se que no centro ativo o átomo de Mo seria coordenado por dois grupos cis-ditiol, um enxofre de uma cadeia lateral de cisteína e um ligando água/hidroxilo. As estruturas cristalinas recentemente publicadas de Nap, particularmente a estrutura do heterodímero NapAB de Cn a alta resolução (1.5 Å) e Dd NapA com ligandos, demonstraram que o sexto ligando de Mo é de fato um átomo de enxofre, ao contrário do ligando de hidroxilo / água anteriormente estabelecido. Além disso, obteve-se uma estrutura da NapAB de Cn parcialmente reduzida, onde o grupo tiolato da cisteína que coordena o Mo Cys está a ocupar parcialmente uma nova posição. O sexto ligando de enxofre parece ter uma ligação parcial de dissulfureto com o grupo tiolato da cisteína, bloqueando o nitrato de interagir diretamente com o átomo de Mo, a menos que ocorra algum rearranjo durante a catálise.
Várias estruturas cristalinas da NapAB de Cn co-cristalizadas com ligandos são apresentadas nesta dissertação complementadas pelos resultados de TSA, ITC e MST. Os resultados comprovam a existência de uma conformação alternativa da cisteína que coordena o Mo e abre caminho para mais estudos sobre o mecanismo de reação das nitrato redutases.
V
T
ABLE OF
C
ONTENTS
Abstract ... I Resumo ... III Table of Contents ... V Table of Figures ... VII List of Tables ... IX Table of Abbreviations ... XI
1 Introduction ... 1
1.1 Molybdenum Enzymes and the Pyranopterin Cofactor ... 3
1.2 Nitrate Reductases ... 5
1.2.1 Biologic and Ecologic Context ... 5
1.2.2 Structure of Periplasmic Nitrate Reductases: State of the Art ... 6
1.2.3 Proposed reaction mechanism and its considerations ... 8
1.3 X-Ray Crystallography ... 10
1.3.1 Protein crystallization ... 11
1.3.1.1 Phase Diagrams and the Crystallization Process... 11
1.3.1.2 Crystallization Methods... 12
1.3.1.3 Co-crystallization, Soakings and Cryoprotectant Solutions ... 13
1.3.2 X-Ray Sources ... 14
1.3.3 Protein crystal diffraction ... 15
1.3.4 The Phase problem ... 16
1.3.5 Model Improvement ... 17
1.3.6 Model analysis and validation ... 18
1.4 Isothermal Titration Calorimetry (ITC) ... 19
1.5 Thermal Shift Assay (TSA) ... 20
1.6 Microscale Thermophoresis (MST) ... 20
1.7 Objectives ... 21
2 Materials and Methods ... 23
2.1 Protein Purification ... 25
2.2 Protein crystallization ... 26
2.2.1 Screening and optimization ... 26
2.2.2 Co-crystallizations and soakings ... 27
2.3 Data collection, processing and structure determination ... 29
2.3.1 Model Building and Refinement... 30
2.4 Thermal Shift Assays (TSA) ... 30
VI
2.6 Microscale Thermophoresis (MST) ... 31
3 Results and Discussion ... 33
3.1 Protein Purification and activity assays ... 35
3.2 Protein Crystallization... 36
3.2.1 Screening and Optimization ... 36
3.2.1.1 Bis-Tris and Succinic Acid ... 36
3.2.1.2 The JCSG+ screen ... 37
3.2.2 Co-crystallization with reducing agents ... 38
3.2.3 Other co-crystallization and soakings ... 41
3.3 Data Diffraction and Model Interpretation ... 42
3.3.1 Oxidized cysteines ... 47
3.4 Thermal Shift Assays ... 51
3.5 Isothermal Titration Calorimetry ... 53
3.6 Microscale Thermophoresis ... 54
4 Conclusions and future perspectives ... 57
VII
T
ABLE OF
F
IGURES
Figure 1.1: Pyranopterin Dependent Enzyme Families and the Moco Biosynthesis. ... 4
Figure 1.2: Structure of NapAB from Cupriavidus necator. ... 7
Figure 1.3: NapAB proposed reaction mechanism... 9
Figure 1.4: A protein crystallization phase diagram. ... 12
Figure 1.5: Representations of the principle vapor diffusion method techniques: hanging drop, sitting drop and microbatch. ... 13
Figure 1.6: Schematic representation of the diffraction experiment and constructive interference. ... 16
Figure 1.7: Typical MST experimental results. ... 21
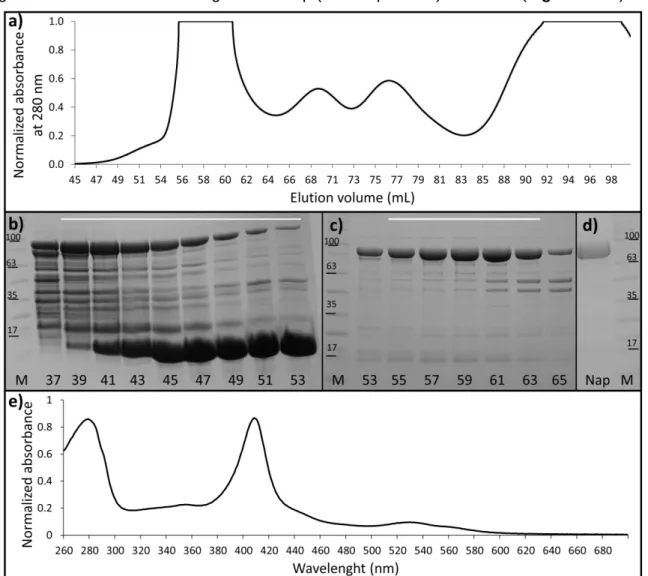
Figure 3.1: Characterization of the NapAB purification. ... 34
Figure 3.2: Results from the crystallization screens. ... 36
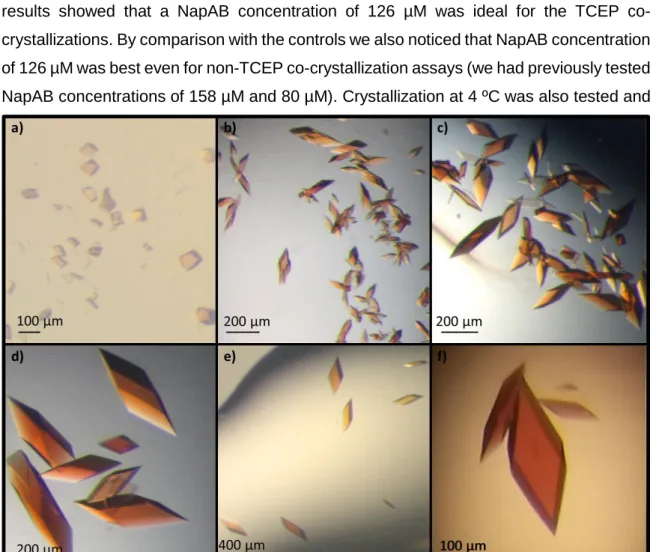
Figure 3.3: Results from crystallization optimization and co-crystallization with DTT, TCEP and potassium nitrate.. ... 38
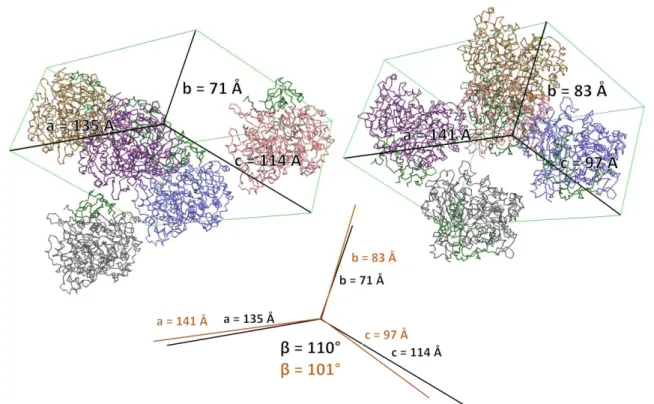
Figure 3.4: Comparison of the different unit cells obtained. ... 42
Figure 3.5: Crystal structure of partially reduced Nap and nitrite in nitrate co-crystallized Nap. ... 45
Figure 3.6: Crystal structure of nitrite in nitrate co-crystallized Nap. ... 46
Figure 3.7: Spectrum of NapAB with sodium dithionite. ... 47
Figure 3.8: Crystal structure of Nap zooming the oxidized cysteines 388 and 784 in the subunit NapA... 48
Figure 3.9: Comparison of various TSA results. ... 51
Figure 3.10: Comparison of an ITC assay to the control. ... 52
IX
L
IST OF
T
ABLES
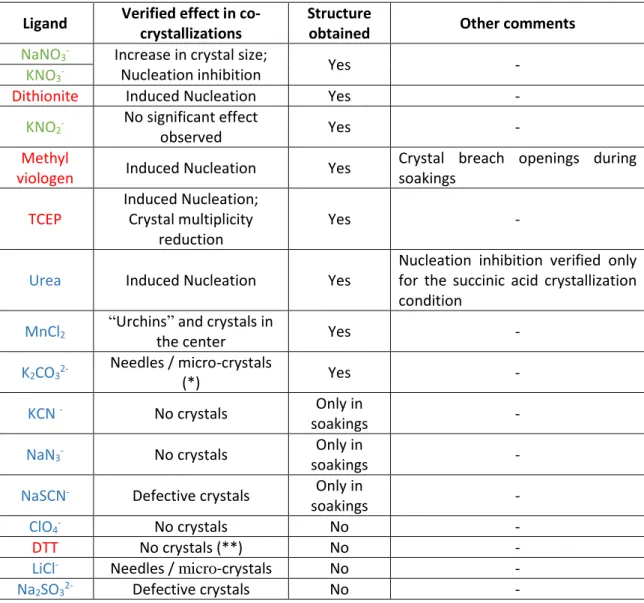
Table 2-1 – Summary of ligands used in the co-crystallization assays: reducing agents, substrates, substrate- analogues and inhibitors. ... 28 Table 2-2 – Summary of different conditions tested for NapAB Cn in TSA. ... 31 Table 2-3 - MST Binding Affinity Assays………...………..…32 Table 3-1 – Summary of the various NapAB ligands and effects in the co-crystallization experiments. ... 41 Table 3-2 – Summary of the results from the Nap crystals obtained in aerobic conditions and tested in the various synchrotron beamlines. ... 44 Table 3-3 – Summary of the results from the NapAB crystals obtained in anaerobic conditions and tested in the various synchrotron beamlines ... 45 Table 3-4 – Statistics on data collection and structure refinement. ... 50
XI
T
ABLE OF
A
BBREVIATIONS
Cn – Cupriavidus necator
CODH – Carbon monoxide Dehydrogenase
Dd – Desulfovibrio desulfuricans
DTT – Dithiothreitol
EBDH – Ethylbenzene Dehydrogenase
ESRF – European Synchrotron Radiation Facility
Fdh – Formate dehydrogenase
FT – Fourier Transform
GTP – Guanosine-5'-triphosphate
HPLC – High Performance Liquid Chromatography
ITC – Isothermal Titration Calorimetry
MGD – Molybdopterin guanosine dinucleotide
Moco – Molybdenum Cofactor
MPT – Metal Containing Pterin
MST – Microscale Thermophoresis
NADPH – Nicotinamide adenine dinucleotide phosphate
Nap – Periplasmic Nitrate Reductase
Nar – Respiratory Nitrate Reductase
Nas – Assimilatory Nitrate Reductase
NR – Nitrate reductase
PEG – Polyethylene Glycol
RT-PCR – Real Time Polymerase Chain Reaction
SAXS – Small-angle X-ray scattering
XII SDS – Sodium dodecyl sulfate
SDS-PAGE – Sodium dodecyl sulfate polyacrylamide gel electrophoresis
SO – Sulfite oxidase
TMAOR – Trimethylamine Oxide
XDH – Xanthine Oxidase/Dehydrogenase
1
3
1.1 M
OLYBDENUME
NZYMES AND THEP
YRANOPTERINC
OFACTORMolybdenum (Mo) is a transition metal incorporated in more than 50 known enzymes and is essential to almost all known forms of life. Organisms that do not dependent on this element use tungsten (W) instead, which has similar chemical characteristics. [1], [2].
Molybdenum is a versatile element that is able to coordinate from 4 up to 8 ligands, varying in oxidation states from -2 to 6, being oxidation states IV to VI the most stable while bonded to biologic macromolecules. This flexibility in oxidation states allows it to act as transducer between obligatory two-electron and one-electron oxidation-reduction systems [1]. Mo is mainly available in seawater as molybdate (MoO42-) and is found either in the multinuclear MoFe7 (bacterial nitrogenases) or mononuclear (bond to one or more pterin cofactor) forms [3], [4].
Mononuclear Mo enzymes possess a tricyclic pterin (or pyranopterin) cofactor, originally named Moco (Molybdenum Cofactor) and it was first discovered in xanthine dehydrogenase (XDH) and nitrate reductase (NR) enzymes. Only later it was found that it also binds tungsten. Mo is found coordinating the dithiolene group of either one (xanthine oxidase and sulfite oxidase families – XO and SO respectively) or two (dimethyl sulfoxide reductase family - DMSO) pyranopterins. Besides binding to the pyranopterin, Mo is also found coordinated to terminal oxo/hydroxo groups, sulfide groups and amino acid residues side chains through different combinations. Based on the Mo ligands, spectroscopic and biochemical data, pyranopterin-dependent enzymes have been divided into three families: the xanthine oxidase (XO), the sulfite oxidase (SO) and the DMSO reductase families (Figure 1.1.a). In the XO and SO families, only one pyranopterin coordinates the Mo atom. Additionally, in the XO family the Mo is found coordinating a hydroxyl group, one oxygen and a sulfur while in the SO family Mo binds to one hydroxyl group, an oxygen and to the side chain of a cysteine. In the DMSO reductase family two pyranopterins coordinate the Mo atom which also coordinates one hydroxyl or thiol groups, oxygen or sulfur atoms and the side chains of: cysteine, selenocysteine, aspartic acid or serine [5]. DMSO is the most diverse family and is further divided into three subfamilies as depicted in Figure 1.1.a. [3], [5], [6].
4 The pyranopterin is expected to be responsible for the correct positioning of the Mo atom in the catalytic center, to control its redox behavior and to participate in the electron transfer to or from the Mo. The cofactor is found deeply buried within the protein and whenever it is released from the enzyme, it undergoes rapid degradation due to oxidation reactions [3], [5], [6].
The pyranopterin biosynthesis is a conserved pathway that can be divided into four steps (Figure 1.1.b) [7]: I – Conversion of GTP (Guanosine Triphosphate) into the Precursor Z, the most stable intermediary; II – Sulfur transfer to precursor Z, catalyzed by MPT (Metal Containing Pterin) synthase; III – MPT adenylation producing the ready to bind Mo (or W) (this process is catalyzed by two proteins in bacteria whereas in higher organisms both were fused into a two-domain protein - Cnx1); IV – Mo insertion
Figure 1.1: Pyranopterin Dependent Enzyme Families and the Moco Biosynthesis.
a) Pyranopterin dependent enzyme families and the DMSO reductase sub-families (adapted from
Romão 2009 and Coelho & Romão 2015). b) Proposal for the eukaryotic Moco biosynthesis (adapted from Mendel 2006). Abbreviations: XO/XDH – Xanthine Oxidase/Dehydrogenase; CODH – CO Dehydrogenase; SO – Sulfite Oxidase; SDH – Sulfite Dehydrogenase; Nas – Assimilatory Nitrate Reductase; Fdh – Formate dehydrogenase; Nar – Membrane bound Respiratory Nitrate Reductase; Nap – Periplasmic Nitrate Reductase; EBDH – Ethylbenzene Dehydrogenase; TMAOR – Trimethylamine Oxide; GTP – Guanosine Triphosphate; MPT – Metal Containing Pterin; AMP – Adenosine Monophosphate.
5 preceded by a copper atom exit which is thought to preserve the pathway intermediaries from unintended oxidation [3].
In prokaryotes, the pyranopterin is found conjugated to nucleosides whereas in eukaryotes it is in the monophosphate form. Lack of the cofactor synthesis may lead to a decrease or loss of the Moco-enzymes functions in the organism. In humans, it leads to mental retardation and attenuated brain growth followed by death, due to deficiency in SO activity [3], [5].
Note that eukaryotic NR are part of the SO family and are not under the scope of this dissertation.
1.2 N
ITRATER
EDUCTASES1.2.1 Biologic and Ecologic Context
Nitrogen is the fourth most abundant element in the biosphere and is the nitrogen cycle that delivers and recycles this essential element throughout the Ecosystem. Nitrogen is involved in many anabolic and catabolic pathways where it can be incorporated into amino acids and nucleic acids or be part of respiration processes. Due to human activities like the overuse of nitrate based fertilizers, the nitrogen cycle “has been altered more than any other basic element cycle” [8].
Nitrate is the most stable and important nitrogen source in soils and water, reduction of nitrate to nitrite - a key step in the nitrogen cycle – becomes therefore important in the management of the ecosystem. This reaction is catalyzed by nitrate reductases (NR) and is the first step in both assimilatory and dissimilatory nitrate reduction pathways [9].
Prokaryotic nitrate reductases belong to the DMSO reductase family of Mo containing enzymes and their functions and localizations vary between nitrogen assimilation (cytoplasmic nitrate reductases - Nas), energy generation (membrane bound nitrate reductases - Nar) and excess energy dissipation (periplasmic nitrate reductase - Nap) [10].
The cytoplasmic assimilatory nitrate reductase (Nas), catalyze the first step of nitrogen assimilation and receive electrons from nicotinamide adenine dinucleotide (NADH), reduced nicotinamide adenine dinucleotide phosphate (NADPH), ferredoxin, or flavodoxin. Respiratory nitrate reductases (Nar) are membrane-bound (facing the cytoplasm) enzymes that obtain the reductive power from periplasmic formate, whose electrons are transferred through the quinone pool to the Nar active site, releasing nitrite into the cytoplasm and contributing to the proton motive force [10], [11].
6 The true physiological role of periplasmic nitrate reductase (Nap) is not yet fully clear. Periplasmic nitrate reductases are known to be responsible for the redox balancing but they are also involved in the denitrification process, nitrate scavenging and respiration, even though apparently, they do not contribute for the proton motive force. Electrons originating from the quinone pool flow through the tetra-heme monomer NapC, passing by a di-heme monomer NapB, reaching the active site in NapA [10]. The catalytic subunit NapA ranges from 70 kDa (D. desulfuricans) to 90 kDa (C. necator) and some organisms like D. desulfuricans lack the NapB monomer [4], [10].
Nitrate reductases have been implicated in a diverse range of functions, namely denitrification, reduction to ammonia, maintenance of cellular redox potential, nitrate respiration and scavenging. Because these functions are so diverse, knowledge about NR activity in the ecosystems becomes an important step towards the regulation of the nitrogen cycle. Through better understanding these enzymes we can better predict the impact on biodiversity, global warming and water quality – essential problems caused by the gradual disruption of the nitrogen cycle [8], [9].
1.2.2 Structure of Periplasmic Nitrate Reductases: State of the Art
The first structure of a NR was solved by X-Ray Crystallography in 1999 ([12]. The protein is a monomer isolated from Desulfovibrio desulfuricans (Dd) and the structure was obtained at 1.9 Å resolution. At the time, the model was published with six Mo ligands, four provided by the cofactor cis-dithiolene groups, one from the side chain of a cysteine and the sixth was interpreted as an oxo/hydroxyl ligand. The model showed a distorted trigonal prismatic geometry involving Mo and its ligands [12]. The first crystal structure of a heterodimeric NR (NapAB from Rhodobacter sphaeroides) was obtained in 2003 at 3.2 Å resolution [13]. In 2007 the crystal structure of the catalytic subunit NapA from Escherichia coli was obtained at 2.5 Å. During purification the NapB monomer would dissociate and therefore its structure was not determined in the study [14].
New crystallographic studies of novel Dd NapA structures were later conducted of the protein in the native state and with ligands, with resolutions between 1.99 Å to 2.50 Å. Through improved refinement methods, this work showed that the sixth Mo ligand is a sulfur atom instead of oxygen. The authors also highlighted the proximity between the fifth and sixth ligands, implying a partial disulfide bond. Due to the true nature of the sixth ligand, the initial proposed reaction mechanism (based on oxygen chemistry) needed to be revisited and more research was therefore required [15].
7
Figure 1.2: Structure of NapAB from Cupriavidus necator.
The cartoon colors represent the various NapA domains and the NapB monomer: domain I, green; domain II, red; domain III, sand; domain IV, blue; NapB, magenta. A zoom in of the NapAB active site cofactors and electron pathway is shown (rectangle); Zoom in of the active site of NapAB is also shown (circle).
8 The crystal structure of the heterodimeric NapAB from Cupriavidus necator (Cn), was solved at atomic resolution (1.5 Å) and corroborated that the sixth Mo ligand was a sulfur atom [16]. The authors also published a partially reduced NapAB structure which showed the Mo coordinating cysteine with a novel alternate conformation, further advancing the discussion on the Nap reaction mechanism.
The NapAB from Cn is a globular heterodimer of an approximate dimensions of 65 Å x 65 Å x 58 Å and is shown in Figure 1.2. The larger subunit, NapA is composed of 802 amino acids and is responsible for catalyzing the reduction of nitrate to nitrite. This monomer contains the Mo atom bound to two molybdopterin guanosine dinucleotide (MGD) cofactors and a [4Fe4S] cluster involved in electron transfer. The active site is buried within the protein, having a 15 Å long substrate channel leading to it in the opposite side of the interface between NapA and NapB. The NapB monomer is responsible of transporting electrons originating from the quinone pool and NapC (a membrane-anchored tetraheme c-type of unknown structure), towards NapA. NapB has 134 amino acids and contains two c-type hemes – with two histidines coordinating the iron atoms. The electrons reaching the active site originating from the heme groups (10 Å away from each other), are expected to be mediated by the conserved NapA tyrosine 58 (8 Å away) that is at the interface between NapA and NapB and reaching the [4Fe4S] cluster (also 8 Å away). From the [4Fe4S] cluster, the electrons should first pass through the highly conserved NapA lysine 56 (4 Å away) and finally reach the nearest MGD cofactor that is 3 Å away. The NapA from Cn is organized in 4 domains: I – residues 4–68, 507–531, and 600–641; II – residues 69–148, 386–506, and 532–599; III residues 149–385; and IV residues 642–802. The N-terminal domain (I) contains the four cysteine residues coordinating the [4Fe4S] cluster, domains II and III have an overall similar α/β fold and each one binds one of the two MGD cofactors. The domain IV is a β-barrel and is very exposed to the solvent.
1.2.3 Proposed reaction mechanism and its considerations
Based on the Mo chemistry and the nature of the sixth ligand, three alternative reaction mechanisms where initially proposed [15], [17], [18]. These hypotheses can be differentiated by the combination of two aspects – substrate direct/indirect binding to Mo and preservation/breaking of the Mo-fifth ligand: (Figure 1.3.a) Substrate direct binding to Mo and breaking of the bond between Mo and its fifth ligand; (Figure 1.3.b) Substrate second-sphere coordination to the Mo ligand; (Figure 1.3.c) Substrate direct binding to Mo. [17]–[21]
9 The proposed reaction mechanism also states that the formation of bonds and/or partial bonds between the fifth and the sixth sulfur ligands plays a role in the redox state of molybdenum. This is corroborated by the different crystal structures where the distances vary between 2.17 Å and 2.80 Å – where the van der Waals contact distance is 3.3 Å [4], [15].
Figure 1.3: NapAB proposed reaction mechanism.
a-c (adapted from Najmudin et al., 2008): the various considered possibilities for the substrate
interaction with the active site. a) Substrate direct binding to Mo and breaking of the bond between Mo and its fifth ligand; b) Substrate second-sphere coordination to the Mo ligand; c) Substrate direct binding to Mo. d) the proposed reaction mechanism for Nap [17]–[21].
10 Independent studies involving computational chemistry were also performed. In all cases the authors concluded that a first coordination sphere mechanism where the cysteine remained indirectly bound to the Mo atom was energetically more favorable [17], [18].
The proposed mechanism implies that for the enzyme to become active, a conformational rearrangement must first occur (Figure 1.3.d). This rearrangement involves the Mo coordinating cysteine changing from a first coordination shell to a second coordination shell ligand. The cysteine’s side chain loses its Mo bond and starts bonding to the sixth ligand, which in turn shifts towards the fifth ligand’s prior position. From this rearrangement originates a free Mo coordinating position where the substrate may bind [4], [22]. After substrate binding, catalysis follows and an oxygen atom is left bonded to Mo. For the active site regeneration two electrons and protons are transferred to the remaining oxygen and a water molecule is released. The catalytic cycle continues until nitrate is consumed and the inverse of the sulfur shift occurs.
A partially reduced NapAB structure from Cn was obtained at 1.7 Å resolution [16]. During refinement of this structure, the Mo coordinating cysteine (Cys 152) presented extra positive electron density near the Cβ. The authors interpreted this new density as a cysteine alternate conformation with 12% occupancy. The mechanism hypothesis previously described is corroborated by this structure. The conformational freedom of the active site, the bond and/or partial bond interaction of the fifth and the sixth sulfur ligands with the subsequent computational chemistry studies sustains the proposed mechanism. However further studies are necessary to establish the NR reaction mechanism [17]–[21].
1.3 X-R
AYC
RYSTALLOGRAPHYMacromolecular X-Ray Crystallography is a technique used to solve the 3-D macromolecular structures up to atomic resolution. This technique takes advantage of the crystal high degree of organization and the X-ray characteristics – the wavelength range compatibility to the atomic bonds and the diffraction pattern of the electrons [23].
This technique is used worldwide and its major drawback are the difficulties in obtaining crystals. X-Ray Crystallography was the first technique to deliver atomic resolution structures and is until today the most used technique for such purposes. By August 2017, the protein data bank (https://www.rcsb.org/pdb/statistics/holdings.do) holded 132428 structures from which 118533 (90 %) were provide by X-Ray Crystallography. Other available structural biology techniques are Nuclear Magnetic Resonance (NMR), Cryo-Electron Microscopy (Cryo-EM) and Small-angle X-ray
11 scattering (SAXS) that possess different sets of advantages/drawbacks. X-Ray Crystallography, NMR and Cryo-EM can be used in separate to produce detailed 3-D structures or may also be combined, complementing each other to succeed in particular cases.
1.3.1 Protein crystallization
The crystallization of proteins is a procedure which relies on diverse ways of gradually increasing the protein concentration. The event must be slow and gentle enough so that the proteins precipitate in an organized manner, leading to the formation of crystals. Crystals are highly organized matter and can be represented by the unit cell – the smallest group of molecules that can reconstruct the crystal by symmetry operations. Unit cells are characterized by the length of “a”, ”b”, and ”c” and the “α”, “β” and “” angles between them [23]. Unit cells contain at least one asymmetric unit, which reconstructs the unit cell by symmetry operations and belong to one of four types: Primitive lattice (P), base-centered lattice (A, B or C), internal-centered lattice (I) or face-internal-centered lattice (F). When combined with the seven crystalline systems, 28 crystalline lattices are available. Since proteins are chiral, the symmetry operations available are translation and rotation, excluding any mirror planes or inversion centers. Because of this, the possible space groups for protein crystals are reduced from 230 to 65, all of them available for consult at “The International Tables for Crystallography”. Protein crystals contain water channels which represent 30-70% of the crystal as first described by Matthews [23], [24]
Protein crystals are used to diffract X-rays. Planes of atoms within the crystals act as X-Ray reflectors through constructive interferences serving as signal amplifiers. The diffraction of unorganized atoms within the crystal will cause destructive interference, whereas diffraction from the organized atoms will be recorded in the diffraction patterns [23].
1.3.1.1 Phase Diagrams and the Crystallization Process
Phase diagrams may be composed of various zones, namely precipitation, nucleation and crystal growth and represents the crystallization process for each unique protein (Figure 1.4). For maximizing the probability of obtaining adequate crystals, the crystallographer attempts to obtain a solution that conveniently passes through the three stages in. The objective is to start in the unsaturated zone (Figure 1.4.a). As water moves out of the crystallization droplet, the protein and the precipitants concentration increases because the water volume is reduced. In theory, as the protein and precipitant concentration arise, the crystallization droplet changes
12 from the unsaturated stage, to the nucleation stage (Figure 1.4.b). The droplet passes by the crystal growth stage because here it cannot form new nuclei and there are not existing nuclei to grow. When the nucleation stage is reached, the protein begins to form crystal nuclei, so its concentration starts to decrease. As the protein concentration lowers, the droplet changes towards the crystal growth stage again (Figure 1.4.c). When this stage is achieved, the already formed nuclei continue to grow, forming crystals. The crystals will grow until the solution reaches equilibrium or is perturbed [23], [25].
This is a complex and not yet fully understood phenomenon, often needing fine-tuning of key conditions. Because of this, and the fact that so many (non-exhaustively testable) conditions vary on significance for each protein to be crystallized, the crystallization step is still partially empiric [23].
1.3.1.2 Crystallization Methods
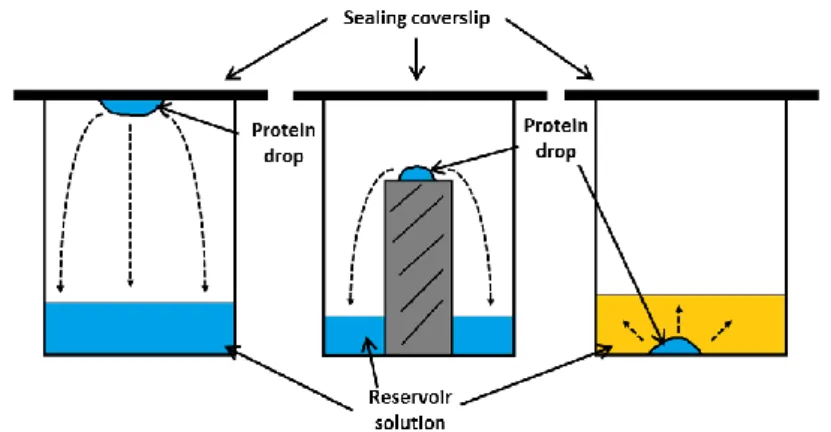
There are several crystallization methods, ant the most common is the vapor diffusion method, which can be performed by the hanging or sitting drop techniques. In hanging drop, the crystallization condition containing the precipitating agent is applied on the top of a silanized cover slip and the protein is added, followed by sealing of the well with the cover slip. Since there is a lower precipitant concentration in the drop, water slowly diffuses into the reservoir. In the sitting drop method the drop
Figure 1.4: A protein crystallization phase diagram.
In the diagram is shown a hypothetical crystallization condition progress along time (brown circles). The protein droplet passes by the crystal growth zone (a-b) reaching the nucleation zone (b). Here crystal nucleus are generated and start to grow, lowering the dissolved protein concentration. The droplet leaves the nucleation zone, passing the remaining time in the crystal growth zone. The crystals grow until no more protein is available, hence reaching the interface between the crystal growth and unsaturation zone (c).
13 containing the precipitant/protein is placed in a small platform inside the well (Figure 1.5) [23].
Other methods used in protein crystallography are dialysis and micro batch. The first consists in a small button enveloped by a dialysis membrane and immersed in the crystallization condition. The dialysis button has a depression where the protein is previously added, therefore, protein-crystallization solution contacts are made only through the dialysis membrane. The micro batch is a technique that makes use the protein and water insolubility in oil. In this technique, the protein and crystallization solution are added to oil in the bottom of the well as a single drop. Water will migrate from the drop to the oil at an even slower rate than for instance, vapor diffusion [23].
The use of crystallization robots for automated crystallization is a popular and appealing option. Crystallization robots are used for initial screening assays. Using special crystallization plates, the robots automatically add the protein and crystallization solutions to the wells. The machines complete the screening assays much faster, but also use significantly less protein amounts (down to the nano-scale) that humans are able to. The major downfalls of the robots is that the crystals are usually smaller and a scale up is required, which might be complex and problematic in specific cases [23], [26].
1.3.1.3 Co-crystallization, Soakings and Cryoprotectant Solutions
Proteins in the crystalline form may retain their function and tolerate some conformational changes induced by ligands without damaging the crystal [23], [25], [27]. Besides structures of site-specific ligand interaction with the proteins, important
Figure 1.5: Representations of the principle vapor diffusion method techniques:
hanging drop, sitting drop and microbatch.
A simple representation of the three crystallization methods used in this work. The dashed arrows represent the movement of water from the protein drop to the reservoir. a) Hanging drop; b) sitting drop; c) microbatch.
14 conformational changes caused by the ligands can be revealed. For this purpose, several procedures such as co-crystallization or soakings experiments can be made.
Co-crystallization consists in crystallizing the protein while the ligand is dissolved in the crystallization drop, either by previously incubating the protein with the ligand, or by adding the ligand to the protein drop during the crystallization. Soaking experiments consists in introducing new solutions that contain the ligand in pre-existing crystals. The ligand diffuses through the water channels within the crystal and interact with the protein molecules. If drastic conformational changes are expected, co-crystallization might be preferable to avoid crystal damage.
After the crystals are grown, they can be transferred to stabilizing and cryoprotectant solutions for diffraction experiments. In order to prevent the crystals from dissolving, the solutions used possess higher precipitating agent concentrations than in the conditions that they grew. During the diffraction experiments or transport, liquid nitrogen (-197 ˚C boiling temperature) is used. Aiming to avoid the water within the crystals to freeze and damage them, cryoprotectant solutions are used. The cryoprotectant solutions possess a cryoprotectant agent that inhibits the formation of water crystals. For these purposes glycerol, xylitol, sugars, Polyethylene Glycol (PEG), salts or mixtures of these are used [23].
1.3.2 X-Ray Sources
The first generation of X-Ray sources were the X-Ray tubes, in which electrons collided with an anode under vacuum conditions. In these conditions, when the electrons hit the metal, inner orbital electrons are ejected from it. An outer orbital electron then fills the empty orbital and releases energy in the form of X-rays. Each metal emits photons in varying specific wavelengths. However, this procedure heavily degrades the metal in the zone that the electrons collide. To solve this problem, other X-Ray sources were invented – the rotating anode X-Ray tubes. In this case the anode was rotating and the area of impact of electrons was distributed along the anode. By doing this, the degradation of the anode was dispersed in a larger area. Although, the temperature rise under vacuum conditions did remain a problem [23].
Synchrotron radiation is widely used nowadays. Electrons are accelerated in storage rings to near the speed of light and emit X-Ray photons when forced to change in direction but continue to accelerate. The photons released pass through monochromators that make X-Ray wavelength selection possible. Synchrotron radiation further revolutionized X-Ray crystallography in the drastic time reduction required for data collection, data quality and crystal size requirement [23].
15 A more recent X-Ray source is the Free Electron Laser X-Ray (XFEL), where the electrons are instead accelerated in a straight line. This technology produces extremely brilliant and short pulses. Because of this, data can be collected free of radiation damage – the radiation pulse exits the sample faster than the damage occurs [28].
1.3.3 Protein crystal diffraction
In the diffraction experiment X-rays go through a protein crystal and are diffracted by the electrons of the protein. The diffracted beams hit the detector and its intensities and relative positions are recorded. Although the phase information is not detectable and therefore lost. The experiment results in a diffraction pattern, a plane with various spots varying in size proportionally to photon count. The crystal orientation is changed over the course of the diffraction experiment, obtaining thousands of diffraction patterns, reflected from the different lattice planes of the crystal. The diffraction patterns are indexed forming a hypothetical 3D diffraction pattern sphere (Figure 1.6.a). The result of the experiment is a list of intensities across the reciprocal space sphere and correspondent errors [23].
Since the crystal is a periodic organization of molecules, some atoms diffract in the same direction and in phase with each other in all the unit cells which constitute the crystal. These atoms are said to diffract X-rays in a constructive manner, increasing its signal proportionally to the number of such atoms. In contrast atoms not structurally repetitive inside the crystal (as for solvent channel’s waters) give diffractions varying in direction and phase that cancel each other [23]. W.H. Bragg and his son W. L. Bragg discovered and mathematically described this phenomenon now known as the Bragg’s Law (Figure 1.6.b).
The planes of atoms within a crystal that produce constructive diffraction can be represented by three numbers, called the Miller indices (or lattice indices) – h,k and l. These indices represent sets of parallel planes with constant interplanar spaces of dhkl. If the scattered waves from X-rays are in phase, they interfere constructively. When these conditions are met, constructive interference happens, resulting in multiple diffracted/reflected X-rays in the same direction and in phase – a strong diffracted beam that produces a spot in the diffraction pattern. Each crystal orientation has a different number of sets of planes that meet the Bragg’s law condition. The crystal is rotated in order to capture the diffraction of more planes of atoms [23].
For diffraction data evaluation, various parameters are used in combination. Some of the more used parameters and its expected values are: Ratio of signal to noise (I/σ(I)) (should be no less than 2); completeness, which represents the percentage of measured expected reflections (should be above 95% at the highest resolution shell); 3); correlation coefficient (CC1/2) representing the correlation between two halves of a randomly split data
16 set (should be no less than 0.5); 4); and Rmerge which is the averaging of multiple symmetry-related reflections, depending on the study case a value lower than 0.25 is acceptable [23].
1.3.4 The Phase problem
Fourier showed that any complex periodic function can be described as the sum of simpler periodic functions. Diffracted X-rays can be described as
three-Figure 1.6: Schematic representation of the diffraction experiment and constructive
interference.
a) X-rays go through a Nap crystal which results on a diffraction pattern. As the crystal rotates more
diffraction patterns are collected that forms a hypothetical reciprocal diffraction sphere. Symbolizing the unit cells are Nap structures. The crystal photo, diffraction pattern and NapAB structures have all been experimentally obtained during the course of this work. b) Constructive interference is produced from sets of planes (horizontal dashed lines) of atoms (yellow dots), with interplanar spaces of dhkl, from impinging X-rays of wavelength λ with a θ angle only if Bragg’s law is met. To
the right a simple description of the relation between interplanar spacing and difference in path length of X-Rays 1 and 2 (adapted from Rhodes 2007).
17 dimensional waves, they are therefore a complex periodic function and can be described as the sum of various simpler functions [23].
The 3D electronic distribution of the atoms in the protein can be calculated using the Fourier Transform (FT). The FT transforms the values of a periodic function in their reciprocal values, in the case of X-Ray Crystallography it transforms the reflection data (reciprocal space) into electron density data (real space). FT is reversible, therefore applying it to electron density data gives back the reflection data [23].
The FT requires the amplitudes and phase angles to transform diffraction data into real space information. Amplitudes are calculated directly from the indexed list of reflection intensities experimentally obtained. The phase angles are however missing, resulting in the “phase problem” where the crystallographer needs to obtain phase information by other means [23]. Molecular replacement is one way of obtaining phase information. It is popular and widely used because it does not require any additional experiments, but does require an already existing homology model of the protein in study. The method consists in placing the already obtained structure into the new unit cell. After translation and rotational operations, the phases of the X-rays this structure would diffract are calculated. These phases are taken as initial estimations of the real unattained phases [23], [25].
1.3.5 Model Improvement
With the estimated phases and the measured intensities, the FT is applied and a 3D description of the protein electronic distribution is obtained. This model is however greatly influenced by the model used in Molecular Replacement procedure, in fact the phase information dominates the amplitude information [23].
The crystallographer interprets the electronic density and makes adjustments that in principle will approximate the model to the real structure. After significant adjustments are made, another FT is practiced resulting in reciprocal-space information about the structure, therefore amplitudes and phases. Mathematical analysis are made, further progressing phases, approximating the model’s calculated structure factors to the experimentally obtained. Cycles of FT and model improvement are made, converging the 3-D model to the structure that experimentally diffracted the X-Rays [23], [25], [27].
18 1.3.6 Model analysis and validation
During model refinement, various parameters are used to evaluate how close it is to the obtained data and how much more it can be improved, such as different electron density maps, temperature factor, R-factors and the Ramachandran plot.
During model building the atoms are fitted into the electron density where there is enough confidence to do so. Common contour maps used are 2FO-Fcalc and FO-Fcalc. The 2FO-Fcalc map results in continuous density along the model, giving increased importance to observed structure factors over the calculated ones. The FO-Fcalc map is a difference map that shows negative or positive density. Positive density represents lack of electron density compared to what obtained data suggests, whereas negative density is the inverse. This map can show subtler errors that the 2FO-Fcalc [23].
The temperature factor (B factor) represents the thermal vibration expected for each atom in the model and is expected to be lower for atoms buried inside the protein and higher for atoms at the proteins surface. The thermal motion of each atom is expected to be similar to neighbor atoms and higher for side chain than the protein’s backbone [23], [25], [27].
Other parameter used for model analysis and validation is the R-factor - a measure of the proximity between the current model and the experimentally obtained data. If during refinement the model is converging to the real 3D structure, this factor will converge also to 0. There are diverse ways to calculate factors, the “traditional” R-factor is given by:
𝑅 =∑ ||𝐹𝑜𝑏𝑠| − |𝐹𝑐𝑎𝑙𝑐|| ∑ |𝐹𝑜𝑏𝑠|
If the model would be perfectly equal to the structure that diffracted the X-rays R will be zero, whereas if Fcalc are random values from another dataset R will be 0.6 or higher. The Rfree is an R-factor that uses a random set of data not used in refinement (usually 5 %). The two factors complement each other in what the “traditional” R-factor tells us how well the current model predicts the obtained data and Rfree how well the current model is predicted by data not used to arrive to the same model [23], [25].
Another way to evaluate a model is to stereochemically compare it to the amino acid conformations in the Ramachandran plot. These plots represent preferable and allowed amino acid conformations since they are physically restricted. It is allowed that a few outliers remain through refinement but not too many. These amino acids
19 remain outliers because they are tolerating a higher energetic cost in order to maintain the protein’s function.
1.4 I
SOTHERMALT
ITRATIONC
ALORIMETRY(ITC)
Isothermal titration calorimetry (ITC) is a very powerful technique and the objective of using ITC was to try to obtain the kinetic constants for Cn NapAB and its interaction constants with various ligands, further characterizing it.
The ITC machine contains two isotermically isolated compartments (the reference and the reaction cell). By altering the energy provided to the reaction cell, the machine maintains the temperature of both cells constantly equal. The result of the experiment, is the variation of energy provided to the reaction cell along time. Exothermic reactions occurring inside the reaction cell lead to a decrease in energy provided to the reaction cell, maintaining the temperature; whereas endothermic reactions lead to an increase of energy providence [29], [30].
The process of determining reaction kinetics through ITC generally requires two steps: the first is the acquisition of the total apparent molar enthalpy (ΔHapp) in the established conditions, the second is the measurement of the heat flow at different substrate concentrations [29]. For determining ΔHapp a single injection experiment is performed in which the substrate injected is totally converted into product. Because the substrate is totally consumed, it is assumed that the moles of product obtained are proportional to the moles of substrate injected; therefore, enabling to calculate the reaction total apparent molar enthalpy [29], [30]. After ΔHapp has been calculated, the heat flow (dQ/dt) for different substrate concentrations is needed. To do this there are currently two methods available, the multiple injection and the single injection methods [29], [30].
𝑣 =𝑑[𝑃] 𝑑𝑡 = 1 𝑉. Δ𝐻𝑎𝑝𝑝 .dQ 𝑑𝑡
The multiple injection method involves consistent injections of substrate into the cell containing the sample. Each injection is timed to permit the signal to stabilize to the new baseline but not for the substrate to be significantly consumed – simulating steady state conditions. In this method, the heat flow is calculated through the difference between the original baseline and the new after each injection. In the single injection, the method of calculating the enthalpy of the reaction is similar but requires higher substrate concentrations. Comparing the two methods, the single injection requires more complex mathematical analysis, takes less experimental time and is more resilient to base line drift derivate errors [29], [30].
20
1.5 T
HERMALS
HIFTA
SSAY(TSA)
The thermal shift assay technique (TSA) has become very important, since it is a simple and fast technique able to screen various buffers and/or ligands detecting their influence in the protein of study. This is especially useful for macromolecular X-Ray Crystallography in order to discover stabilizing buffer conditions suitable for the crystallization assays [31]–[33]. In the TSA assays, a fluorophore that improves its emission efficiency when interacting with hydrophobic residues of the protein is used to monitor protein denaturation. As the temperature rises and the proteins start to denaturate, the fluorescence increases its emission and is detected in a RT-PCR machine. The melting temperature (Tm) – which is the temperature at which half the proteins is denatured – is measured for the native protein and for the protein in the presence of several ligands of interest and/or buffers [33].
When a ligand stabilizes the protein, the Tm increases and when the ligand destabilizes the protein, the Tm decreases. An inhibitor that interacts exclusively with the folded protein active site is an example of a stabilizing ligand, whereas a ligand that interacts exclusively to the unfolded protein will destabilize it. Ligands that stabilize the protein in these assays, often also improve the macromolecular crystallization process [33], [34].
The result of the technique is a melting profile for each compound tested with the protein and the corresponding melting temperature. The influence of each ligand is accessed through the comparison of melting profiles with the profile absent of any ligand [35].
1.6 M
ICROSCALET
HERMOPHORESIS(MST)
Microscale thermophoresis (MST) is a relatively recent technique and it basically consists in the measurement of local loss of fluorescence after heating. The sample consists of at least one labeled analyte, (usually a protein labeled with a fluorophore), producing fluorescence and a ligand. Multiple capillaries containing the analyte and varying ligand concentrations are introduced into the MST machine. The machine is constantly measuring the emission of the fluorophore. At a certain point, it irradiates the center of the capillary with infrared heating. Normally the fluorescence will decay as the molecules will flow from the heated part of solution to the coolest, (the inverse, although less common, might also happen). In either case a signal profile is created depending on the quantity and velocity at which the molecules diffuses away (or into) the heated volume [36].
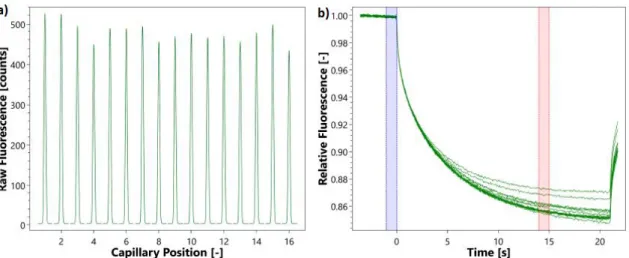
21 As each capillary contains increasing concentration of ligand, if it interacts to the analyte it will often change the signal profile. The signal change depends on the difference in size, charge and hydration shell of the protein and protein-ligand complex. From the gradual change in signal dependent on the ligand concentration, the Kd can be obtained. The normal experiment consists on a capillary scan before and after the MST traces (Figure 1.7.a-b). These scans assess if the protein is stable enough before and throughout the experiment. Between these scans the MST tracing experiment is performed. This tracing consists measuring the fluorescence without impinging infrared light for a brief period of time (usually for 20 seconds). After this step, the infrared is turned on and the varying fluorescence is measured along time, following the fluorophore diffusion. The signal stabilizes after some time, at which point the velocity of diffusing molecules away and into the irradiated zone is the same. The infra-red is turned off again and the signal rapidly stabilizes to the initial signal. A comparative study is made with the non (infrared) irradiated fluorescence and the irradiated fluorescence [36].
1.7 O
BJECTIVESThe aim of this work was to study the reaction mechanism of the periplasmic nitrate reductase (NapAB) from Cupriavidus necator through the use of X-Ray Crystallography and complementary techniques. To try to obtain the reaction mechanism intermediates various co-crystallization and soaking experiments were conducted using substrate, substrate-analogues, inhibitors and reducing agents.
Besides the X-Ray Crystallography studies, Isothermal Titration Calorimetry (ITC), Thermal Shift Assays (TSA) and Microscale Thermophoresis (MST) were also performed.
Figure 1.7: Typical MST experimental results.
a) superimposed capillary scans before and after the MST tracing. b) MST traces where the blue
and red areas are the non-irradiated fluorescence and irradiated values that are being considered for the Kd calculations.
22 These techniques were used because they can provide complementary information on ligand-protein interactions, valuable for the study of the reaction mechanism.
23
25
2.1 P
ROTEINP
URIFICATIONThe Cupriavidus necator (Cn) NapAB protein used in this work resulted from a homologous expression system, with the particularity that all the genetic engineering steps were carried out in Escherichia coli and later the resulting vector was introduced in an inactive strain of C. necator. An industrial growth of 300 L was carried out to obtain large amounts of the bacteria C. necator and after pellet resuspension the periplasm was isolated and frozen at -80°C in aliquots of ~1L until further usage [26].
In this work, the purification steps started from one of this periplasm aliquots. The sample was thawed in an ice-water bath, centrifuged at 13000 g for 20 min and the supernatant was dialyzed in 10 mM MES pH 5.5 overnight. The dialyzed solution was centrifuged at 13000 g for 15 min and the resulting sample was always maintained at 4°C further on. To purify the protein the resulting supernatant was injected in a HPLC (High Performance Liquid Chromatography) system (Shimadzu) connected to a cation exchange SP Sepharose Fast Flow column (GE Healthcare) pre-equilibrated with 10 mM MES pH 5.5. A linear gradient of 10 mM MES pH 5.5 with 500 mM NaCl was used for NapAB elution. The initial flux of the column was 3 mL/min but due to technical problems the flux was lowered to 0.35 mL/min (overnight) and finally to 1.5 mL/min. Continuous absorbance at 280 nm was recorded to follow protein elution and 15 aliquots of 3 ml were collected. To verify which of the collected fractions contained the NapAB protein, an SDS – PAGE (Sodium dodecyl sulfate – Polyacrylamide gel electrophoresis) was used. Samples of 15 µL were previously denatured and loaded into 13% acrylamide Tris-Tricine gels. An electric field of 200 mA and 200 V was applied for 50 minutes and the NZY Color Protein Marker II (NZY Tech) was used to identify the resulting bands.
The fractions containing NapAB, were pooled together and concentrated using a Macrosep concentrator (30 kDa, Pall corporation) and later injected into a molecular exclusion Superdex 200 (GE Healthcare) HPLC column. The column was pre-equilibrated with 300 mM Tris-HCl pH 7.6 and three separate runs were performed at 1 ml/min flow collecting 1 mL aliquots. A SDS-PAGE following the previously described protocol was used to verify which collected samples contained the NapAB protein and the corresponding fractions were pooled together.
Protein purity and concentration where assessed through SDS-PAGE and absorbance at 410 nm which corresponds to the two c-type heme groups (ε = 212 000 M-1 cm-1) from NapAB. The final NapAB concentration was 16.9 mg/mL (158 µM) with a purity ratio (A410nm/A280nm) of 95%, also confirmed by using a plate reader).
26 Qualitative activity assays were made to ensure the purified NapAB sample was active. We used sulfanilamide and N-1-napthylethylenediamine dihydrochloride (NED) under acidic conditions to detect the presence of nitrite in various samples. This reaction was first described by Griess in 1879, hence the reaction mixture can be abbreviated to the “Griess reagent” [37], [38]. Each sample solution had a total of 500 µL and was (prior to the addition of the Griess reagents) 100mM Tris-HCl pH 7.6, 1 mM methyl viologen, 4 µM NapAB and 9.2 mM sodium dithionite. After one minute, potassium nitrate was added to a concentration of 14 mM and the reaction was allowed to proceed for half a minute after which the sample was vortexed, oxidizing dithionite and stopping the reaction. A volume of 500 µL 35 mM sulfanilamide and 6 M HCl was added to the sample mixture followed by 500 µL 5 mM NED. The development of an intense pink color was then assessed.
2.2 P
ROTEIN CRYSTALLIZATION2.2.1 Screening and optimization
Crystallization assays where performed in a temperature controlled room at 20°C and all the necessary material was there placed for at least 30 min prior to the beginning, including the 24 well-plates used (Molecular Dimensions - XRL).
Considering the previous successful C.necator NapAB crystallization studies [16], [26], two crystallization conditions were initially tested by the hanging drop method using 100 mM Bis-Tris pH 5.5 and 100 mM succinic acid pH 7.0 with 5% to 30% PEG 3350. Different NapAB initial concentrations were also tested: 17 mg/ml, 12.75 mg/ml and 8.5mg/ml. The drops contained 1µL of protein solution and 1µL of precipitating solution (1+1) and 500 µL of crystallization solution in the reservoir. In parallel, an additive screen from Hampton Research (total of 48 different additives) was also tested by hanging drop using the crystallization condition of 0.1 M succinic acid pH 7.0, 20% PEG 3350 and drops composed by (1+0.25+0.75) of protein, additive and precipitant solution respectively. To clarify the crystallization drop composition, in all cases the pipetting order was: protein sample on a silanized cover slip or crystallization bridge; additive solution (when applied) on top of the protein drop; and precipitating solution followed by the sealing of the well.
The commercial screen JCSG-plus™ from Molecular Dimensions (96 different crystallization conditions) was also tested using the hanging drop method and drops (1+1) in the search for alternative crystallization conditions. The JCSG+ screen results showed that 9 out of 28 initially promising conditions were worth to pursuit and were
27 reproduced using in-house made solutions. From these nine conditions, the condition containing 0.1 M ammonium citrate pH 5.5 with 20% PEG 3000 was selected and PEG concentrations of 15%, 20%, 25% and 30 % were also screened. The condition containing 20% PEG 3000 was originally chosen, however, co-crystallization of NapAB with reducing agents caused a decrease of the crystals size and an increase of the presence of smaller crystals. Due to this, we retested PEG 3000 for 15%, 17.5%, 20% and 22.5% and the condition containing 17.5% PEG 3000, 0.1M ammonium citrate pH5.5 proved to lead to better crystals and chosen as the main crystallization condition until the end of this work.
2.2.2 Co-crystallizations and soakings
Two main crystallization methods were used in order to try to obtain the NapAB crystals with ligands: co-crystallization and soaking. Co-crystallization was used either by incubating Nap with the ligands for 30 min prior to the crystallization assay or by adding the ligand to the crystallization drop as an additive. Soaking experiments were carried out either by fishing the crystals into a new drop containing a harvesting solution (HB) with the ligand or by exchanging the drop by successively and gently substituting the mother liquid by the HB/ligand solution.
Potassium nitrate (1 0 mM or 100 mM) and sodium nitrate (10 mM) were tested to verify if the salts were relevant as additives using drop volumes of (1+0.5+0.5) and (1.5+0.5+1). Co-crystallization with reducing agents (DTT and TCEP at 14 mM) by incubation with NapAB was also tested using hanging drop (1+1; 1.5+1.5; 2+2), sitting drop (1+1) and the micro batch (2+2) techniques. For incubation assays the final concentration of the reducing agent was 14 mM and the NapAB sample concentration was 13.6 mg/ml. The incubation periods lasted 30 minutes for all cases.
The incubation of Nap with reducing agents resulted in a low yield of large protein crystals, favoring the appearance of smaller crystals in high amounts. To improve crystal size of NapAB with reducing agents, we tested: (1) different Nap concentrations (158 µM, 126 µM, 111 µM and 79 µM); (2) different drop volumes (1+1; 1.5+1.5 and 2+2); (3) decreased crystallization temperature at 4 0C; (4) urea and potassium nitrate as additives, through the hanging drop, sitting drop and micro batch techniques. Urea was tested because it was present in the additive screen (with succinic acid pH 7.0 and 20% PEG 3350) and showed to decrease protein nucleation in the drops. Optimal conditions were found for the reducing agent TCEP and were later used to co-crystallize NapAB with other reducing agents: sodium dithionite and methyl viologen. DTT was no longer used for incubation due lack of suitable crystallization results.
28 For the soaking experiments, we used a harvesting buffer solution (HB) containing 25% PEG 3000, 0.1 ammonium citrate pH 5.5 and the ligands in a similar concentration as in the co-crystallization assays. The precipitant concentration was higher than in the crystallization assays in order to prevent the crystals to dissolve. The soaking experiments were made either by transferring single crystals to new drops containing the HB or by gently exchanging the mother-drop solution in which the crystals grew by the HB solution. The last method was performed by repeatedly adding between
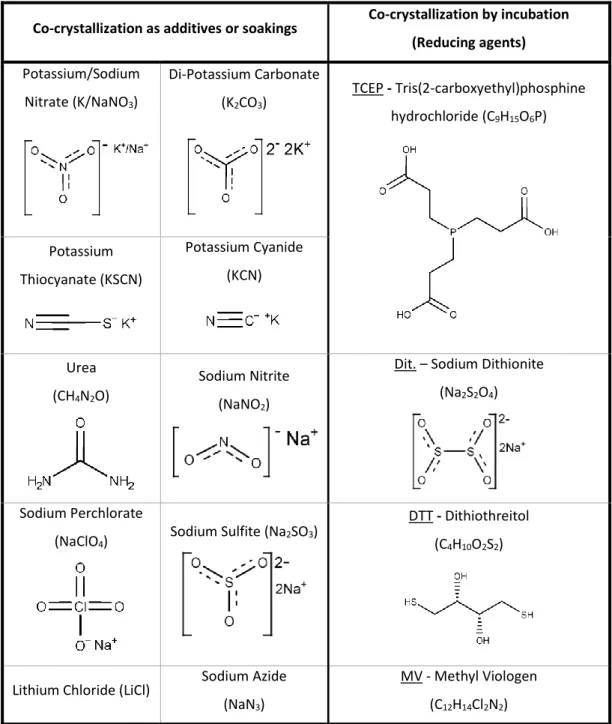
Co-crystallization as additives or soakings Co-crystallization by incubation (Reducing agents) Potassium/Sodium Nitrate (K/NaNO3) Di-Potassium Carbonate (K2CO3) TCEP - Tris(2-carboxyethyl)phosphine hydrochloride (C9H15O6P) Potassium Thiocyanate (KSCN) Potassium Cyanide (KCN) Urea (CH4N2O) Sodium Nitrite (NaNO2)
Dit. – Sodium Dithionite (Na2S2O4)
Sodium Perchlorate (NaClO4)
Sodium Sulfite (Na2SO3)
DTT - Dithiothreitol (C4H10O2S2)
Lithium Chloride (LiCl) Sodium Azide (NaN3)
MV - Methyl Viologen (C12H14Cl2N2)
Table 2-1: Summary of ligands used in the co-crystallization assays: reducing
agents, substrates, substrate- analogues and inhibitors.
In parentheses the chemical formulas, underlined the acronyms and below the 2D structure of the compounds. Potassium cyanide, potassium thiocyanate, and sodium azide, perchlorate and carbonate where expected to act as NapAB inhibitors/substrate inhibitors.