ISSNe: 2182.2883 Available: https://doi.org/10.12707/RIV18090
Adaptation and validation to Portuguese of the Reasons
for Higher Education Dropout Scale
Adaptação e validação para português da Escala de Motivos de Intenção de Abandono
do Ensino Superior
Adaptación y validación al portugués de la Escala de Motivos de Intención de
Abando-no de la Enseñanza Superior
Manuela Ferreira* ; João Duarte** ; José Luís Abrantes*** ; Lídia Cabral**** ; Raquel Guiné***** ; Sofia Campos****** ; Ana Paula Cardoso*******
Abstract
Background: School dropout is a problem education systems struggle with, which disputes the quality of the edu-cational institution and the education system itself.
Objectives: To adapt and validate the psychometric qualities of the Reasons for Higher Education Dropout Scale for Portuguese higher education students.
Methodology: Quantitative, transversal, descriptive, and correlational study. A sociodemographic characterization questionnaire and the Reasons for Higher Education Dropout Scale were applied to a sample of 891 students, mostly female (68.2%), with a mean age of 19.68 years. Exploratory and confirmatory factor analysis was used. Results: The scale, consisted of 30 items, is organized into 4 dimensions: Organizational; Life management; Profes-sional; and Relational. It presents an explained variance of 46.5% and a Cronbach’s alpha of 0.959.
Conclusion: The results support the psychometric adequacy of the scale for the Portuguese population and indicate that it can be used in future studies in this area and allow the implementation of measures to prevent dropout. Keywords: student dropouts; education, higher; validation studies; reliability and validity
Resumo
Enquadramento: O abandono escolar é um problema com que os sistemas educacionais se debatem, colocando em causa a qualidade da instituição escolar e do próprio sistema de ensino.
Objetivos: Adaptar e avaliar as qualidades psicométricas da Escala de Motivos de Intenção de Abandono do Ensino Superior para os estudantes do ensino superior português. Metodologia: Estudo quantitativo, transversal, descritivo e correlacional. Foi aplicado um questionário de caracteri-zação sociodemográfica e a Escala de Motivos de Intenção de Abandono do Ensino Superior a uma amostra de 891 estudantes, maioritariamente feminina (68,2%), com uma idade média de 19,68 anos. Recorreu-se à análise fatorial exploratória e confirmatória.
Resultados: A escala composta por 30 itens, organizados em 4 dimensões: Organizacional; Gestão de vida; Profis-sional e Relacional. Apresenta uma variância explicada de 46,5%, e um alfa de Cronbach de 0,959.
Conclusão: Os resultados apoiam a adequação psicomé-trica da escala para a população portuguesa, indicando que poderá ser utilizada em ensaios futuros neste âmbito e permitir a implementação de medidas que o contrariem. Palavras-chave: evasão escolar; ensino superior; estudos de validação; confiabilidade e validade
Resumen
Marco contextual: El abandono escolar es un problema al que los sistemas educativos se enfrentan, y que pone en causa la calidad de la institución escolar y del propio siste-ma de enseñanza.
Objetivos: Adaptar y evaluar las cualidades psicométricas de la Escala de Motivos de Intención de Abandono de la Enseñanza Superior para los estudiantes de la enseñanza superior portuguesa.
Metodología: Estudio cuantitativo, transversal, descripti-vo y correlacional. Se aplicó un cuestionario de caracteriza-ción sociodemográfica y la Escala de Motivos de Intencaracteriza-ción de Abandono de la Enseñanza Superior a una muestra de 891 estudiantes, mayoritariamente femenina (68,2%), con una edad media de 19,68 años. Se recurrió al análisis facto-rial exploratorio y confirmatorio.
Resultados: La escala estuvo compuesta por 30 ítems, or-ganizados en 4 dimensiones: Organizativa; Gestión de la vida; Profesional y Relacional. Presenta una varianza expli-cada del 46,5% y un alfa de Cronbach de 0,959. Conclusión: Los resultados apoyan la adecuación psico-métrica de la escala para la población portuguesa, lo que indica que se podrá utilizar en ensayos futuros en este ámbito y permitir la implementación de medidas que lo contraríen.
Palabras clave: abandono escolar; educación superior; es-tudios de validación; confiabilidad y validez
*Ph.D., Coordinating Professor, Polytechnic Institute of Viseu, Health School, CI&DETS, 3500-843, Viseu, Portugal [[email protected]]. https://orcid.org/0000-0002-8452-2222. Contribution to the article: project conception; creation and implementation of the formative intervention program; data analysis and interpretation; article writing and final approval of the submitted version. Address for correspondence: Rua D. João Crisóstomo Gomes de Almeida, n.º 102, 3500-843, Viseu, Portugal.
**Ph.D., Coordinating Professor, Polytechnic Institute of Viseu, Health School, CI&DETS, 3500-843, Viseu, Portugal [[email protected]]. https://orcid.org/0000-0001-7082-8012. Contribution to the article: data analysis and interpretation; article writing and final approval of the submitted version.
***Ph.D., Coordinating Professor, Polytechnic Institute of Viseu, School of Technology and Management of Viseu, CI&DETS, 3504-510, Viseu, Portugal [[email protected]]. https://orcid.org/0000-0003-0565-7207. Contribution to the article: data analysis and interpretation, and article writing.
****Ph.D., Coordinating Professor, Polytechnic Institute of Viseu, Health School, CI&DETS, 3500-843, Viseu, Portugal [[email protected]]. https://orcid.org/0000-0001-7306-5049. Contribution to the article: project conception; creation and implementation of the formative intervention program; and article writing.
*****Ph.D., Coordinating Professor, Polytechnic Institute of Viseu, Agrarian School, CI&DETS, 3500-606, Viseu, Portugal [[email protected]]. https://orcid.org/0000-0003-0595-6805. Contribution to the article: project conception; creation and implementation of the formative intervention program; and article writing.
******Ph.D., Invited Professor, Polytechnic Institute of Viseu, Health School, CI&DETS, 3500-843, Viseu, Portugal [[email protected]]. https://orcid.org/0000-0002-4696-3537. Contribution to the article: project conception; creation and implementation of the formative intervention program; and article writing.
*******Ph.D., Coordinating Professor, Polytechnic Institute of Viseu, School of Education,
3500-155, Viseu, Portugal [[email protected]]. https://orcid.org/0000-0001-5062- Received for publication: 13.12.18
RESEARCH PAPER (ORIGINAL)
36
Revista de Enfermagem Referência - IV - n.º 21 -2019
Adaptation and validation to Portuguese of the Reasons for Higher Education Dropout Scale
Introduction
Higher education dropout is becoming an increa-singly evident political and social issue and has also been discussed within the scientific community and institutions (Ferreira & Fernandes, 2015). The access of a varied audience to higher edu-cation has brought new challenges and new res-ponsibilities to higher education institutions, particularly that of ensuring that all students have equal opportunities for academic permanence and success. The reasons for dropout are very diverse. Professional and life management reasons, that is, sometimes it is related to the high demand in the labor market. There are also social, economic, and personal reasons, not forgetting when the reason is the students’ poor relationship with their educational institution. The use of reliable instruments is extremely important to confirm the need for intervention within the context of academic success promotion. Therefore, the ob-jective of this study is to adapt and evaluate the psychometric qualities of the Reasons for Higher Education Dropout Scale (Ambiel, 2015) for Portuguese higher education students. Following the procedures recommended in the scientific literature, the aim is to provide to the community a reliable instrument, capable of assessing what it is meant to assess.
Background
In recent years, promoting higher education success has been a primary objective of public policies and initiatives of higher education ins-titutions. Nevertheless, academic failure and dropout must still be considered worrying pro-blems, both by the students affected by them and the higher education system and the Por-tuguese society as a whole. There is a current set of specific circumstances, namely the increasing importance of higher qualifications to the cur-rent economic panorama, which is increasingly supported on knowledge and innovation (Costa & Lopes, 2008).
The Ministry of Science, Technology, and Higher Education issued in 1999 the Order no. 6659/99 of 5 April (Despacho n.º 6659/99 de 5 de abril, 1999), underlining the relevance of this academic dropout problem and requesting from higher education institutions the production of studies to define the causes of higher education failure/ dropout and to support the implementation of preventive measures. In 2013, the Portuguese go-vernment issued the Resolution of the Republic Assembly no. 60/2013 (Resolução da Assembleia da República n.º 60/2013 de 18 de abril, 2013),
requesting an annual report on higher education dropout and, in 2014, the document “Higher Education Strategic Guidelines” (Direção-Geral do Ensino Superior, 2014) where action mea-sures are defined, namely the creation of the Retomar Program, directed at increasing school success and reducing dropout rates.
The first college year is, as described by Albu-querque (2008), a problem for many students. Academic failure, dropouts, and the apparent lack of motivation of many students become concer-ning factors for higher education institutions. In this respect, the author developed a study which aimed to “understand how students who enroll in a course, which was not their first choice, adapt to higher education and why they choose not to abandon it” (Albuquerque, 2008, p. 19).
Results indicated that, through the practi-cal academic activities undertaken during the course, students began to understand the profession, the type of population they would work with, and the type of work they would develop. It was concluded that the involvement of students in the course and the pedagogical relationship are the factors that most influence the decisions of the permanence of these students. (Al-buquerque, 2008, p. 19)
On the other hand, by analyzing the path of all students enrolled in the 1st year, for the first time, in 2011/2012, Baptista (2015) sought to define their situation after one year, more specifically in the academic year of 2012/2013. He concluded that in undergraduate courses of public education, the panorama is similar to university and polytechnic education, whose dropout rate is about 12% after 1 year. Thus, it is important to understand the factors that could influence academic success in higher education, including emotional skills, the quality of academic life, and other sociodemographic variables.
The factors that influence the academic profile of students, particularly in higher education, can be analyzed from a multidimensional perspective, comprising the
inherent dimension of the student (educa-tion path, socio-economic data, personal contact information, and psychological factors), the pedagogical dimension (rela-tionship between teachers and students and organization of the curriculum), the institutional dimension (conditions of attendance, degree of integration, services and equipment) and the external envi-ronmental dimension (university-related, cultural, and geographical). (Sequeira, 2013, p. 14)
Research questions
What are the explanatory dimensions of the Reasons for Higher Education Dropout Scale? Is the hypothesized 4-factor model validated by the confirmatory factor analysis?
Methodology
For the evaluation and refinement of measu-rement instruments, it is common practice to use statistical procedures, including reliability studies, such as the study of the internal con-sistency of items, and validity studies, more specifically the exploratory factorial analysis (EFA) and confirmatory factorial analysis. The aim is to determine the number and nature of the latent variables (factors) that best represent a set of observed variables (manifest variables). To this end, a psychometric and methodologi-cal research was outlined because, in addition to development, validation, and assessment of research tools and methods, this study seeks to define useful values to support the selection of valid and reliable instruments in future researches and, thus, to ensure the quality of results. Participants
The sample for this study is non-probabilistic by convenience consisting of 891 1st-year higher education students, of whom 3.6% study in the area of health, 20.9% in education, 24.7% in agrarian sciences, and 40.8% in the area of technology. The participants had a minimum age of 17 years and a maximum of 40 (M = 19.68 years ± 2.34 years). The male representatives were 31.8%, and the female 68.2%.
Instrument
The school dropout scale was developed by Am-biel (2015) and is a standardized instrument, in the form of an inventory, which assesses the potential reasons for enrolled students to leave their courses before completion.
In its original form, this scale is composed of 53 items related to the reasons that influence the decision of a student to drop out of a university degree. It has a five-point Likert-type answer key, ranging between 1 - very weak and 5 - very strong. The instrument is subdivided into seven factors: Institutional reasons (Factor 1); Personal reasons (Factor 2); Reasons related to lack of support (Factor 3); Professional Reasons (Factor 4); Reasons related to academic performance (Factor 5); Interpersonal Reasons (Factor 6), and Reasons related with autonomy (Factor 7). This study performed the linguistic adaptation
and validation for European Portuguese of the scale.
Adaptation of the scale into European Por-tuguese
Although developed and presented in Portu-guese, the scale had Brazilian Portuguese ter-minology, so the content of the items was vali-dated, using two procedures: expert analysis and semantic analysis.
Five experts in the area of education were con-sulted and provided their contribution. Then, their opinions were subjected to a descriptive analysis, checking the rate of agreement for each item. A criterion was defined as to incorporate items with more than 75% agreement among experts. Items with a lower percentage, when suggested, suffered alterations. As a result, five items were modified. Finally, for the semantic analysis, that is, to analyze the understanding of the items, a pre-test was conducted with 25 students. All modifications and suggestions were incorporated in the final version of the scale. Procedures for data analysis
A questionnaire on sociodemographic charac-teristics and the Reasons for Higher Education Dropout Scale (Ambiel, 2015) were applied. The purpose of the study was to determine and test the factorial structure of the Reasons for Higher Education Dropout Scale for Portuguese university students. Thus, the homogeneity be-tween items, that is, the internal consistency, was assessed by means of calculating the Cron-bach’s alpha coefficient (α) both for the items and the total scale. As for the validity studies, the exploratory factor analysis used the principal component method and the orthogonal varimax rotation procedure. For factor retention, the eigenvalues greater than 1 and the scree plot were taken into account. The criterion for items saturation were values equal to or higher than 0.20 (Marôco, 2014).
For the confirmatory factor analysis, the Analysis of Moment Structures (AMOS 24) software was used. Considering the covariance matrix, the Maximum Likelihood Estimation (MLE) algorithm was adopted for the estimation of parameters. The statistical procedures for data analysis were: (i) assessment of item sensitivity by skewness (Sk) and kurtosis (Ku) whose reference values are ≤ 3 and ≤ 7, respectively; (ii) construct validation based on a factor, convergent, and discriminant analysis (Marôco, 2014).
The factor validity analysis was based on the quality of the global fit of the factorial model and the local fit quality.
38
Revista de Enfermagem Referência - IV - n.º 21 -2019
Adaptation and validation to Portuguese of the Reasons for Higher Education Dropout Scale
of the goodness of fit global indexes, as listed below with the following reference values: ratio of the x² statistic and degrees of freedom (x²/ df), comparative fit index (CFI), goodness of fit index (GFI), ≥ 0.90 values; root mean square error of approximation (RMSEA), root mean square residual (RMR), and standardized root mean square residual (SRMR), considering val-ues below 0.08 appropriate (Marôco, 2014). The local quality fit was assessed by factor load-ings (λ) and the reliability of individual items (δ). The reference values are a factorial saturation higher than 0.50 and individual reliability above 0.25, respectively (Marôco, 2014).
The model fit used the modification indexes (above 11; p ˂ 0.001) produced by AMOS and based on theoretical considerations.
The composite reliability (CR) was assessed with the standardized Cronbach’s alpha for each of the factors. Consistency is considered to be appro-priate when the alpha value is greater than 0.7. Convergent validity estimated by the average variance extracted (AVE) showed that values above 0.50 indicate a good convergent validity (Marôco, 2014).
The discriminant factor validity was assessed by comparing the AVE for each factor with the squared Pearson correlation. This analysis showed that there is discriminant validity when the squared correlation between factors is lower than the AVE, for each factor.
Ethical procedures
All participants in the study received the ne-cessary information and were asked to sign the informed consent form. Their anonymity and confidentiality of data were assured and their autonomy respected.
They were also informed that their participation was entirely free; they could withdraw from the study at any time; this participation did not im-ply any gains or benefits nor incur in any losses or harm. As for the ethics committee approval, the opinion delivered by the Viseu Higher School of Health (Ref. 08/2017) was favorable.
Results
The psychometric study began with determining the statistics for each of the items and later with the internal consistency analysis.
The statistics showed that the average indexes and their standard deviations have a well-centered distribution, all of them placed below the middle point. Regarding the correlation coefficients, it was found that almost all items show correlations above 0.20 (reference value; Pestana & Gageiro,
2014), excepting the first item, which presents a slightly lower value. The analysis of the Cronbach alpha coefficients per item reveals that all items are equal to or higher than 0.958, the global alpha being 0.959.
After determining the internal consistency, the next step was conducting the validity studies using the scale’s exploratory factor analysis. The adequacy of the factor analysis was assessed using the Kaiser-Meyer-Olkin (KMO) test, a statistical procedure that measures the quality of correla-tions between variables and that allows conclu-ding whether it is possible to carry on with the factor analysis. Considering that the reference values are between 0.5 and 1, this study obtained a KMO = 0.958, which can be classified as very adequate. The Bartlett’s sphericity test, based on the chi-squared statistical distribution, was also carried out to test if there was no correlation between the variables. The result obtained (x2 = 25118,096; p = 0.000) allows stating that the correlation matrix is not an identity matrix and, therefore, there is some correlation between the variables, expected to be included in the analysis. The exploratory factor analysis was, then, carried out on the 53 items, using the principal compo-nent method with orthogonal varimax rotation and latent roots higher than 1 (Marôco, 2014). The initial solution allowed selecting eight factors that explained, in total, 58.12% of the variability. However, the scree plot sustains the retention of four factors, according to the inflection point of the curve. Successive factor analyzes were made because of the elimination of items by saturation below 0.40 ou saturation in two or more factors with differences below the recommended value (0.15). The final solution, limited to four factors, allowed selecting 30 items distributed between the four factors which, together, explain 2% of the total variance.
Factor 1 was named Organizational Dimension and consisted of 8 items (35, 37, 43, 45, 46, 48, 50, and 51), which explains 14.53%, after rotation. Factor 2 contains items 11, 18, 19, 21, 22, 49, and 52, and was named Life Manage-ment Dimension and explained 11.58%. Factor 3, Professional Dimension, is composed of 8 items (5, 14, 20, 23, 26, 31, 34, and 36) and explains 11.43%. Factor 4 was named Relational Dimension, whose construct includes items (12, 15, 27, 28, 29, 39, and 41), and shows an explained variance of 10.84%.
The 4-factor solution of this scale was tested using confirmatory factor analysis. Details relating to the multicollinearity and univariate and multi-variate values that might influence the factorial analysis, among others, were analyzed. It was observed that the trajectories of the items with
39
Revista de Enfermagem Referência - IV - n.º 21 -2019
MANUELA FERREIRA et al. their corresponding factors are statistically signifi-cant, showing high factor loadings (λ = 0.50) and reliability higher than 0.25. Exceptions were item 33 of factor 1, item 6 of factor 3, and item 2 of factor 4, which were eliminated in a later analysis. The initial model was refined based on the mod-ification indexes proposed by AMOS, which correlated some errors, and items with satura-tions below 0.50 were eliminated. The results of this procedure showed that the global fit was
very adequate for the global fit indexes: χ2/gl = 4.494; RMSEA = 0.063; RMR = 0.074; SRMR = 0.057; GFI = 0.878; and CFI = 0.887, al-though slightly lower than those recommended by Marôco (2014).
Accordingly, it was found that in factor 1 items 44, 47, 38, 42, 53, 40 and 33 were eliminated, in factor 2 items 1, 17 and 24, in factor 3 items 3, 25, 16, 32, 30, and 6, and in factor 4 items 10, 7, 4, 2, 8, and 9.
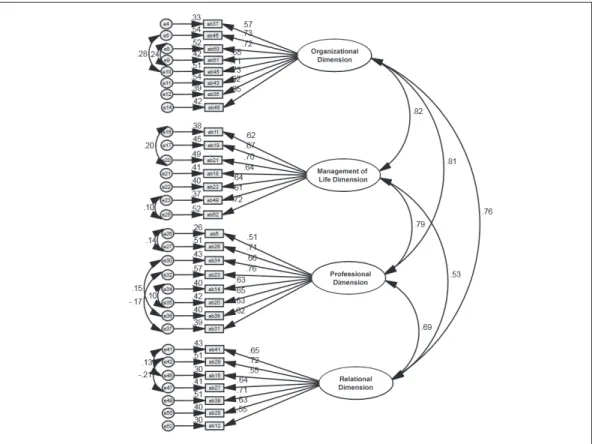
Figure 1. Model with modification indexes
Figure 1. Model with modification indexes Table 1 presents the global goodness of fit indexes. It should be noted that poor indexes exist only in the initial model, but after refining the model, they became adequate, except GFI and CFI, which improved but still have indexes slightly lower than the reference values.
Table 1
Global Fit Indexes
Note. x2/gl = Ratio of the x² statistic and degrees of freedom; GFI = Goodness of Fit
Index; CFI = Comparative Fit Index; RMSEA = Root Mean Square Error of
Approximation; RMR = Root mean square residual; SRMR = Standardized root mean square residual.
CR is, in all the factors, higher than the reference value (0.70), but AEV indicates that
Model x2/gl GFI CFI RMSEA RMR SRMR
Initial model (Figure 1) 5.229 0.744 0.772 0.069 0.091 0.071 Model with modification
indexes 4.494 0.878 0.887 0.063 0.074 0.057 2nd model 4.643 0.870 0.881 0.064 0.075 0.058
Table 1 presents the global goodness of fit in-dexes. It should be noted that poor indexes exist only in the initial model, but after refining the
model, they became adequate, except GFI and CFI, which improved but still have indexes slightly lower than the reference values. Table 1
Global Fit Indexes
Model x2/gl GFI CFI RMSEA RMR SRMR
Initial model (Figure 1) 5.229 0.744 0.772 0.069 0.091 0.071
Model with modification indexes 4.494 0.878 0.887 0.063 0.074 0.057
2nd model 4.643 0.870 0.881 0.064 0.075 0.058
Note. x2/gl = Ratio of the x² statistic and degrees of freedom; GFI = Goodness of Fit Index; CFI = Comparative Fit
Index; RMSEA = Root Mean Square Error of Approximation; RMR = Root mean square residual; SRMR = Standardized root mean square residual.
40
Revista de Enfermagem Referência - IV - n.º 21 -2019
Adaptation and validation to Portuguese of the Reasons for Higher Education Dropout Scale
CR is, in all the factors, higher than the reference value (0.70), but AVE indicates that all factors have a value lower than the recommended (0.50), concluding that there is a divergent validity in all factors.
Furthermore, the stratified coefficient is high (0.957) and presents an AVE of 0.431. In this sense, the instrument seems to be adequate for this sample, so it may be a valuable resource for the study of the intention of school dropout. The next step was to carry out the study of the internal consistency by subscale (Table 2). Fac-tor 1 (Organizational Dimension) shows, con-sidering the mean values, homogeneity in the answers to the various items because the score obtained varies between 2.30 ± 1.220 in item 37 and 2.65 ± 1.051 in item 48. The Cronbach alpha coefficients per item show, if the item is eliminated, an internal consistency that varies between good and reasonable, the smallest value being that of item 46 with α = 0.849 and the greatest value α = 0.867 in item 37.
Regarding Factor 2 (Life Management Dimen-sion), the mean results reveal a homogeneity in
the answers to the various items, because the score achieved ranges between 2.41 ± 1.104 in item 21 and 3.06 ± 1.200 in item 19. The Cronbach alpha coefficients show an internal consistency that varies between good and rea-sonable, the smallest value being α = 0.815, corresponding to item 21, and the greatest value α = 0.828, corresponding to item 49. When analyzing the results of Factor 3 (Profes-sional Dimension), it is noted that the mean indexes range between 2.51 ± 1.014 in item 31 and 2.83 ± 1.162 in item 5. The Cronbach alpha coefficients point out to a questionable internal consistency, as the smallest value is α = 0.826, in item 26, and the largest α = 0.850, in item 5.
As regards Factor 4 (Relational Dimension), the mean indexes range between 1.87 ± 1.037 in item 15 and 2.23 ± 1.163 in item 12. The Cronbach alpha coefficients indicate an inter-nal consistency between reasonable and ques-tionable, the smallest value being α = 0.788, corresponding to item 41, and the highest value α = 0.814, corresponding to item 12.
Table 2
Internal Consistency by Subscale Statistics of the Higher Education Dropout Scale
Items Mean SD total r/item r2 α without
item Organizational Dimension
35 Teachers’ teaching methods. 2.65 1.102 0.573 0.338 0.864
37 No Internet available on campus. 2.30 1.220 0.552 0.318 0.867
43 No help from colleagues when I struggle with learning something. 2.31 1.042 0.666 0.451 0.854
45 No time to participate in inter-nships. 2.49 1.095 0.664 0.502 0.854
46 No pedagogical follow-up program provided by the institution 2.36 1.076 0.706 0.546 0.849
48 Below average grades 2.65 1.051 0.574 0.338 0.863
50 Lack of assistance in the coordina-tion of the course. 2.50 1.087 0.694 0.513 0.851
51 No exchange opportunities offered by the institution. 2.31 1.051 0.629 0.430 0.858
Management of Life Dimension
11 Working during school hours. 2.57 1.235 0.605 0.391 0.820
18 Attending school/polytechnics by family imposition. 2.67 1.451 0.580 0.347 0.826
21 Having to stop working to have time for internships. 2.41 1.104 0.647 0.439 0.815
22 A case of severe illness in the family. 3.04 1.292 0.582 0.347 0.824
49 Need to buy a property (house, apartment…). 2.69 1.298 0.558 0.330 0.828
52 Assuming new professional respon-sibilities that make studies’
conti-nuation impossible. 2.75 1.090 0.627 0.403 0.818
Professional Dimension
5 Having doubts regarding my career choice. 2.83 1.162 0.482 0.262 0.850
14 Likely to have a low professional recognition in the long term. 2.74 1.109 0.588 0.355 0.836
20 Very limited labor market 2.69 1.070 0.609 0.386 0.834
23 Realizing that professional activity will not be as enjoyable as imagined. 2.76 1.118 0.664 0.452 0.827 26 Realizing that the course will not help to get a good job in the future. 2.71 1.077 0.673 0.462 0.826
31 Having a low performance in some classes. 2.51 1.014 0.518 0.281 0.844
34 Career may not be as I thought it would be. 2.58 1.030 0.635 0.417 0.831
36 Very low.professional wages. 2.57 1.058 0.591 0.370 0.836
Relational Dimension
12 No friends at school/polytechnic institute. 2.23 1.163 0.478 0.235 0.814
15 Need to live in student residences. 1.87 1.037 0.522 0.290 0.805
27 Living far from school/polytechnic institute. 2.13 1.113 0.568 0.347 0.797
28 Having failed a class. 2.05 1.069 0.540 0.336 0.802
29 Realizing that people think diffe-rently from me. 2.00 1.004 0.606 0.413 0.791
39 Having a different social class from my colleagues. 1.89 0.999 0.622 0.411 0.789
41 Having to live alone. 1.90 1.089 0.624 0.398 0.788
Note. DP = standard deviation; r = correlation; r2 = coefficient of determination; α = Cronbach’s alpha. The correlation matrix between the four
fac-tors and the overall scale indicate positive and significant correlations (Table 3), which allows stating that the increase or decrease of the in-dexes of a variable corresponds to the increase or decrease of the variable it correlates with. It is evident that, among the subscales, the lowest
correlational value occurs between factor 4 and factor 2 (r = 0.474), with an explained variance of 22.46% and the greatest correlation between factors 3 and factor 1 (r = 0.689), with variability of 47.47%. Among the different subscales and the overall factor, the correlations are higher, which explains the score above 61.0%.
42
Revista de Enfermagem Referência - IV - n.º 21 -2019
Adaptation and validation to Portuguese of the Reasons for Higher Education Dropout Scale
Table 3
Pearson’s Correlation matrix between the factors of the Higher Education Dropout Scale
Factors F1 F2 F3 F4
Life Management Dimension - F2 0.670***
--Professional Dimention - F3 0.689*** 0.652***
--Relational Dimension - F4 0.648*** 0.474*** 0.590***
--Total Factor 0.893*** 0.836*** 0.869*** 0.783***
Note. F1 = Organizational Dimension; F2 = Life management Dimension; F3 = Professional Dimension; F4 = Relational
Dimension.
Discussion
The main objective of this study was to adapt and validate the Reasons for Higher Education Dropout Scale for its use with the Portuguese population. There was no translation since the original instrument was written in Brazilian Portu-guese. However, some semantics corrections were necessary, especially regarding sentence construc-tion and replacement of some terms not used in European Portuguese.
The results were obtained from a sample con-sisting of 891 higher education students, mostly female (68.2%), with a minimum age of 17 and a maximum of 40 (M = 19.68 years ± 2.34 years), for the total sample.
Literature states that the validity of an instrument cannot be regarded as an intrinsic characteristic but rather a characteristic of the instrument itself when applied to a sample. It can, therefore, be concluded that the characteristics of the pop-ulation under study can directly influence the structure of a scale. The exploratory analysis of the Reasons for Higher Education Dropout Scale indicated the existence of a 4-factor construct, being that the retained four factors explained 49.02% of the total variance. Nevertheless, the instrument’s original structure was subdivided into seven factors. No other studies were found on the validation of the instrument, which limits the comparability of results.
The reliability and validity studies through explor-atory and confirmexplor-atory factorial analysis allow stating that the Reasons for Higher Education Dropout Scale constitutes a valid and reliable instrument, adapted to the study of the school dropout intention of Portuguese higher education students.
It is considered that the reliability and validity
analysis of the Reasons for Higher Education Dropout Scale is a crucial aspect. This is because, having the instrument been used to operationalize the central variable and, depending on the study, the value of its results as well as its conclusions, they depend on their conceptual and psycho-metric qualities.
The Reasons for Higher Education Dropout Scale (M-ES; Ambiel, 2015) was then composed of 30 items related to the reasons that influence the decision of higher education dropout, instead of the 53 items of the original scale. In favor of the conceptual validity of the construct, it can be noted that the factorial structure complies with theoretical foundations that support the dropout intention. Yet, there are items which, based on content anal-ysis, would be put in the same category, but are integrated into different factors through the fac-torial analysis. Some of the items were eliminated because they showed saturations below the reference values during the internal consistency analysis and exploratory factor analysis. Others were eliminated during the confirmatory factor analysis, because they proved to be redundant, not clearly defining the aspects under evaluation.
Another argument in favor of the validity of the M-ES is the fact that the scale presents high and statistically significant correlations between the dimensions and are, therefore, not redundant, meaning that they evaluate different aspects of the same construct.
The exploratory and confirmatory factor analysis demonstrates the validity of the scale’s structure in four dimensions: Organizational (F1), with eight items; Life management (F2), with seven items; Professional (F3), with eight items; and Relational (F4), with seven items.
The scale’s original proposal (Ambiel, 2015) rec-ommended evaluating the dropout intention
based on the overall score of each factor, obtained by the sum of the score attributed to each item of this factor. This study suggests that the final score must be based on the second hierarchical factor (Marôco, 2014), which considers the loading of each item and each factor for the sample. This procedure seems, to the authors of this study, to be more adequate because, as the abovemen-tioned author states, according to the classical theory of items, an instrument by itself cannot be considered valid.
Conclusion
Recently, there has been an increasing interest in assessing the possible reasons for active students to drop out of courses they enrolled in before completing them. For this purpose, it was nec-essary to create and/or adapt specific instruments for this population.
It can be concluded that this instrument is very re-liable and has good indexes of internal consistency. Due to the time limitation, the study of temporal stability was not conducted, but later studies will carry it out.
Similarly, it was not possible to perform studies concerning convergent validity due to the lack of previous studies with similar instruments. This limits this study, since it makes it difficult to compare it with other instruments that might have been built based on the same theoretical constructs. It should also be noted, as a limitation of the study, that the scale has been applied to higher education students from a polytechnic institute located in the interior of the country. Considering the different contexts in the country and their influence, future research on the appli-cation of the scale may highlight their functioning in students from other educational institutions. However, the conclusion is that the psychometric adequacy of the Reasons for Higher Education Dropout Scale for the Portuguese population indicates that it could be used in future trials aimed at raising awareness to the school dropout intention and allowing the implementation of measures to fight it.
Acknowledgments
This work is funded nationally by the FCT - Foundation for Science and Technology, I.P., within the context of the project UID / Multi /
04016/2016. Furthermore, the authors would like to thank the Polytechnic Institute of Viseu, the Viseu Higher School of Health, and the CI&-DETS for their support.
References
Ambiel, R. A. (2015). Construção da escala de motivos para evasão do ensino superior. Avaliação Psicológica, 14(1), 41-52. doi:10.15689/ap.2015.1401.05
Albuquerque, T. (2008). Do abandono à permanência num curso de ensino superior. Sísifo: Revista de Ciências da
Educação, 7, 19-28. Retrieved from https://www.re- searchgate.net/publication/28240665_Do_abando-no_a_permanencia_num_curso_de_ensino_superior Baptista, J. O. (2015). Indicadores de transferência e de
abandono no ensino superior português. Retrieved from
http://www.dgeec.mec.pt/np4/%7B$clientServlet- Path%7D/?newsId=499&fileName=2_Apresenta-cao_DGEEC.pdf
Costa, A. F., & Lopes, J. T. (Coord.). (2008). Os estudantes
e os seus trajetos no ensino superior: Sucesso e insucesso, fatores e processos, promoção de boas práticas: Relatório
final. Retrieved from http://etes.cies.iscte.pt/Ficheiros/ relatorio_ETES_completo.pdf
Despacho n.º 6659/99 de 5 de abril. (1999). Diário da
República nº 79, II Série. Ministério da Educação e
Ciência. Lisboa, Portugal.
Direção-Geral do Ensino Superior (2014). Linhas de
orien-tação estratégica para o ensino superior. Retrieved from
https://www.dges.gov.pt/sites/default/files/mec_linhas_ estrategicas_enssup.pdf
Ferreira, F., & Fernandes, P. (2015). Fatores que influenciam o abandono no ensino superior e iniciativas para a sua prevenção o olhar de estudantes. Educação, Sociedade
& Culturas, 45, 177-197. Retrieved from https://www.
fpce.up.pt/ciie/sites/default/files/ESC45Ferreira.pdf Marôco, J. P. (2014). Análise de equações estruturais:
Fun-damentos teóricos, software & aplicações (2ª ed.). Pêro
Pinheiro, Portugal: ReportNumber.
Pestana, M. H., & Gageiro, J. N. (2014). Descobrindo
regressão: Com a complementaridade do SPSS. Lisboa,
Portugal: Silabo.
Resolução da Assembleia da República n.º 60/2013 de 18 de abril. (2013). Diário da República nº 76, I Série. Assembleia da República. Lisboa, Portugal.
Sequeira, P. M. (2013). Contribuição da inteligência emocional
para o sucesso escolar no contexto da formação em medicina
(Master’s Dissertation). Universidade da Beira Interior, Covilhã, Portugal. Retrieved from http://ubibliorum. ubi.pt/bitstream/10400.6/2686/1/Disserta%C3%A7%-C3%A3o_IE_SE_Patricia%20Barata.pdf