The Impact of Traveling and
Waiting Times in Health Care
Emergency Service Choice
An Econometric Approach
Trabalho Final na modalidade de Relatório de Estágio apresentado à Universidade Católica Portuguesa para obtenção do grau de mestre em Business Economics
por
Maria Luísa Araújo Alves
sob orientação de
Professor Doutor Ricardo Ribeiro
Catolica Porto Business School Novembro 2016
Acknowledgements
First and foremost, I would like to thank my supervisor, Professor Ricardo Ribeiro, for the academic guidance and support he has given me throughout this journey. A special word of gratitude to Professor Paula Benesch from the University of Minho for having introduce me to health economics and for always pushing me to go further in this area. Also, I would like to thank Entidade Reguladora da Saúde, particularly to the Supervision Department, for the warm reception and for everything they have taught me. My gratitude extends to all the people in the two hospitals involved in this research. Finally, I would like to thank my family for the continuous encouragement and Luís for the incredible amount of patience and for playing the role of discussant every step of the way.
Abstract
This study aims at estimating the effect of traveling and waiting times on patients’ choice of emergency care provider. In a model with no outside option, patients choose to demand emergency care from one of two similar hospitals. Using data from two Portuguese public hospitals, a conditional logit model is estimated. Two measures of waiting times are considered: the waiting time between admission and triage and the waiting time between triage and the first medical observation. A negative, statistically significant, impact of traveling time and waiting time between triage and the first medical observation on the probability of choosing a given hospital is found. The magnitude of the effect of waiting time, however, is close to zero. The estimated marginal effect suggests that a supply-induced 30-minutes increase in waiting time reduces, all else equal, the probability of choosing a given hospital by 0.009 percentage points. An increase of the same magnitude in traveling time reduces, all else equal, the probability of utilization by 5.841. Although the data does not allow for the estimation of consumer surplus, and given that the estimated effect captures only the impact of changes in waiting times resulting from supply side decisions, it is plausible to admit their effect on patient welfare would be small.
Resumo
Este estudo procura estimar o efeito do tempo de deslocação e de espera na escolha de serviços de urgência por parte dos pacientes. Num modelo sem uma outside option, os utentes escolhem entre dois serviços de urgência de dois hospitais semelhantes. Utilizando dados de dois hospitais públicos Portugueses, um modelo logit condicional é estimado. Duas medidas de tempo de espera são consideradas: o tempo de espera entre a admissão e triagem e o tempo de espera entre a triagem e a primeira observação. Os resultados sugerem a existência de um efeito negativo, estatisticamente significativo, dos tempos de deslocação e de espera entre a triagem e a primeira observação na probabilidade de um paciente escolher determinado hospital. No entanto, a magnitude do efeito dos tempos de espera é próximo de zero. O efeito marginal estimado de um aumento de 30 minutos induzido pelo lado da oferta na probabilidade de escolher um dado hospital é, tudo o resto constante, -0,009 pontos percentuais. Um aumento de igual magnitude no tempo de deslocação reduz, tudo o resto constante, aquela probabilidade em 5,481 pontos percentuais. Apesar de os dados não permitirem a estimação do excedente do consumidor, e dado que o efeito estimado captura apenas o impacto de variações nos tempos de espera causados por decisões de oferta, é razoável concluir que estas não tenham um impacto significativo no bem-estar dos pacientes no caso dos serviços de urgência.
Table of Contents
Acknowledgements iii Abstract v Resumo vii 1. Introduction 13 2. Literature Review 15 3. Theoretical Framework 19 4. Econometric Procedure 225. Portuguese National Health System 23
6. Empirical Application 25
6.1 Data and Descriptive Statistics 25
6.2 Preliminary Analysis 30
7. Results and Discussion 33
8. Policy Implications 38
Tables
Table 1 Descriptive Statistics for the original data retrieved from the hospitals
... 26
Table 2 Variable description ... 29
Table 3 Descriptive Statistics for the estimation sample ... 30
Table 4 Descriptive Statistics for traveling and waiting time variables per choice ... 32
Table 5 Estimation Results ... 35
Table 6 Marginal Effects at the mean ... 36
1. Introduction
Health care is consensually perceived as being distinct from other goods, mainly because of its ethical implications, which makes the evaluation of health care provision an extremely delicate matter. In a seminal contribution, Arrow (1963) addressed a number of aspects that distinguish the market for health care from the markets for other commodities
One of the distinctive features of health care markets is the role of the monetary price consumers face. The presence of insurance and/or the existence of tax-funded national health services as is the case of several western countries usually dampen the monetary costs consumers incur at the time of purchase. Therefore, the instrument that is used in most markets to curb demand the monetary price is often unavailable to providers and policy makers in health care markets.1 This gives rise to an increase in the
relative importance of non-monetary costs, among which time plays a predominant role, as determinants of demand and as a public policy tools. Waiting times broadly defined as the period of time between the moment in which patients, or an agent on their behalf, like a physician, demand the medical good and the moment in which it is supplied affect treatment outcomes and efficiency, thus, shaping investment and capacity decisions. In the case of emergency care and due to its short-term nature, such effect is often amplified.
Whether waiting times are viewed as a result of insufficient capacity, or an instrument that aligns supply and demand, hence bringing health care markets to an equilibrium like prices do in markets for other private goods, they are highly likely to enter patients’ utility functions.2 Economic theory
1 For example, Duarte (2012), using data for Chile, finds demand elasticities for acute health care close to
zero.
2 See, for exemple, Siciliani (2008) and Brekke et al. (2008) for dynamic and static discussions along those lines.
14 predicts that an increase in the waiting time in health care emergency services has a negative impact on the demand for these services and, hence, in the welfare of users.
The main purpose of this study is to analyze the effects of provider specific factors (among which travel and waiting time are deemed of special interest) on patient emergency care choice. Using data from two major general hospitals in the city of Porto, Portugal, a discrete-choice demand model for emergency services is estimated by Maximum Likelihood. The results show that waiting times have a negative and significant effect on the probability of a given hospital being chosen, but very modest in size. The estimated marginal effect suggests that a supply-induced 30-minute increase in waiting time reduces, all else equal, the probability of choosing a given hospital by 0.009 percentage points. As far as the traveling time is concerned, the estimated marginal effect implies a 5.581 decrease in the probability of choosing a given hospital, all else equal.
The remaining of this study is organized as follows. Section 2 reviews the related literature, devoting particular attention to the Portuguese case. Sections 3 and 4 present, respectively, the random utility choice framework and the estimation procedure. Section 5 offers an institutional description of public health care provision in Portugal. Section 6 presents the dataset and conceptually discusses the construction of the explanatory variables in the econometric model, and provides first attempt to understand the link between waiting times and choice. Section 7 reports the results and accesses the estimates. Section 8 debated policy implications. Finally, Section 9 concludes.
2. Literature Review
Demand for health care and time costs are the subject of a significant body of both theoretical and empirical literature.
The idea that in order to produce a set of commodities individuals must combine inputs of market goods and their own time was first purposed by Becker (1965). He introduced time consumed as a cost to the individual and presented a theory of the allocation of time between different activities. This framework was then applied to the health care market by Grossman (1972). In a model of the demand for health and medical care, patients produce health by combining two inputs: time and medical care. Medical care consumption is, thus, associated with both a monetary cost the price of the medical good and a nonmonetary one time.
In the presence of insurance, the relative importance of the monetary cost is dampened. Since health care consumption requires a substantial expense in terms of time, the lower the coinsurance, the lower the monetary price patients have to bear, which implies that the time price becomes relatively more important. This idea was explored by Newhouse and Phelps (1974), who investigated the link between insurance and the relative importance of the time price and found empirical evidence that lower coinsurance rates were indeed associated with higher time elasticities of demand. Another important contribution may be found in the work of Cauley (1987), which corroborates the findings of Newhouse and Phelps (1974). His results suggest that increases in the time requirement and in the monetary price have a negative effect on demand, which is consistent with a priori expectations. Further, he also suggested that the time price is a large fraction of the total cost patients incur when seeking treatment, which indicates that patients
16 normally place a high marginal value on the time required in health care consumption.
Acton (1976) expanded this idea further, by dividing the total cost of health care into monetary price, the amount of time between arriving at the provider office and being treated waiting time , and the travelling time.3 He studied
the effects of each of these costs on the demand for health care. The main purpose of the study was to find if time prices would be an appropriate mechanism for controlling demand as the monetary price decreased in the presence of insurance.4 Using a utility maximization model, he concluded that
nonmonetary factors, as time, act as prices in discouraging demand. The results for two separate samples yielded negative own-elasticities of demand with respect to both travelling and waiting times for outpatient departments and for private physician visits, supporting the idea that time is a suitable instrument for controlling demand. The point estimates for the elasticities all smaller than one in absolute value suggest that the demand for health care at those types of providers is inelastic with respect to time, though.
In line with Acton (1976) is the later work of Martínez-Garcia et al. (1998). Their formulation is akin to that of Acton (1976), since it considers the opportunity cost of traveling and waiting times in the budget constraint as if they were monetary prices. They analyze the elements that influence patients’ choice between provider alternatives in the Spanish health system, placing special emphasis on traveling and waiting times. The results revealed that emergency services demand is very sensitive to time costs. In fact, they concluded that the demand for emergency services is more elastic than the
3 In an attempt to study the impact of travelling time in determining the demand for medical services in
New York City, Acton (1975) used the travelling distance as a proxy for the travelling time.
4 Brekke et al. (2008) present a model of hospital competition in which hospitals avoid treating
unprofitable patients by increasing waiting times.
Blundell and Windmeijer (2000) present a model in which waiting time acts as a cost to treatment and is sufficient to reduce demand to equal supply – if there is an increase in demand, waiting times will increase, causing some individuals to drop out, which will reduce the waiting times.
demand for specialist services and the demand for appointments with general practitioners.
The set of approaches addressed so far might also be applied to the case of the Portuguese National Health Service, under which copayments amount only to a very small part of true service cost and, therefore, where the relative importance of the monetary cost is reduced. In fact, some attention has been given to the link between increases in copayments and health care demand in Portugal, with the evidence suggesting that the former are somewhat ineffective in controlling the latter. Using data from an undisclosed Lisbon hospital, Afonso et al. (2013) concluded that copayments are not an important barrier in the access to health care, although they discourage the utilization of emergency care by patients with milder health conditions.5 Almeida and
Ramos (2015) analyzed the effect of an increase in both direct and indirect costs on the demand for emergency services in Portugal and reported that emergency services demand was not significantly affected by the increase in copayments, while the change in transport regulation had a substantial impact on demand. Their results support the view that indirect costs may be more important than direct costs in determining healthcare when copayments are small and exemption schemes are available.
For Portugal there is no equivalent to the work of Acton (1976), associating demand for health care and the total time cost. Actual distance is alternatively used as a proxy for traveling time, and waiting times as defined above are not considered. Examples of this approach may be found in Santana (1996) and Oliveira (2004). The former attempts to evaluate whether hospital utilization is decreasing in the distance between the patient’s residence and the hospital.
5 These findings were corroborated by a study on the impact of the 2012 increase in user fees in the
Portuguese National Health System conducted by Entidade Reguladora da Saúde, the Portuguese Health Regulator. According to the report, the increase in user fees were accompanied by a reduction in the utilization of both exempt and non-exempt patients, ruling out the former as the cause of the latter. There was, however, an increase in the share of acute cases in the total number of emergency episodes, which suggests that emergency services demand by low severity patients was hindered.
18 Her results are consistent with Acton’s (1975) findings since an increase in distance has a negative influence on demand. She also found that this influence is greater for emergency services visits, which is in line with the work of Martínez-Garcia et al. (1998). The latter develops a demand model for hospital care in which demand is a function of the distance the patient has to travel to get to the hospital. The empirical analysis shows that patients that are located further away from the hospital have a lower probability of utilization, supporting the rationale that the distance a patient has to travel, and hence the traveling time, and the demand for medical services are negatively correlated.
Contrary evidence is presented by Lourenço and Ferreira (2005), whose findings indicate that time is not a determinant of demand for public health centers in Portugal. Lourenço and Ferreira’s (2005) findings refute the argument that time costs are relevant in determining demand. They concluded that utilization is highly inelastic to the total time spent at the health care center and that the elasticity of demand with respect to the traveling time is actually positive. They argue that these results can be explained by the characteristics of the health center users and the health centers distribution across the country.
3. Theoretical Framework
In order to answer the research question I follow Matinez-Garcia et al. (1998). I model patient choice between two alternatives emergency care from Hospital a or Hospital b. The utility derived from getting treatment at either hospital is not observed, only the actual choice is. Thus, the observed choice between the two hospitals reveals which of the alternatives provides greater utility. In other words, the observed outcome reveals how the patient ranks the two alternatives. Both the patient’s and the hospitals’ observable and unobservable characteristics affect the utility derived from emergency care consumption at each one of the hospitals and, accordingly, influence the choice between them.
Let 𝑈𝑖𝑎 and 𝑈𝑖𝑏 represent patient i’s utility from choosing hospital a and
hospital b, respectively:
𝑈𝑖𝑎 = 𝒛𝑖𝑎′ + 𝜀
𝑖𝑎, (1)
where 𝒛𝑖𝑗, j = a,b, includes characteristics specific to the patient as well as to
the choices. Let 𝒛𝑖𝑗 = [ 𝒙𝑖𝑗, 𝒘𝑖] and = [ 𝜷′, 𝜶′] . The vector 𝒙𝑖𝑗denotes the
attributes of the hospitals and, thus, varies across choices and possibly across patients as well. 𝒘𝑖 contains the characteristics of the patient and is, therefore,
the same for the two hospitals. Finally, 𝜀𝑖𝑎 and 𝜀𝑖𝑏 represent the stochastic
elements that are specific to patients and hospital and known only by the individual.6
Following Martínez-García et al. (1998), 𝒘𝑖 comprises variables like gender,
age, whether or not the patient is exempt from copayments, and the severity of the patient’s condition (health status). The vector 𝒙𝑖𝑗 includes, for example,
6This model is a version of a model presented by Green (2000), chapter 18.
20 the traveling time patients face to go to the hospital, the waiting time at the hospital, and its capacity. Travelling and waiting times are the non-monetary cost patients must incur when seeking care. Hence, it is expected that longer waiting times and a more distant location are associated with a lower probability of utilization of a given hospital.
Aiming at examining the effect of hospital-specific attributes—namely, traveling and waiting times—, the conditional logit model is adopted. Its link with utility maximization is as follows. Let 𝑦𝑖 = 𝑎 represent patient 𝑖’s choice
of hospital a and 𝑦𝑖 = 𝑏 patient 𝑖 ’s choice of hospital b. Observing 𝑦𝑖 = 𝑎
implies that patient i retrieves greater utility from option a. That is, 𝑈𝑖𝑎 > 𝑈𝑖𝑏.
With 𝜀𝑖𝑗independentely and identically distributed according to the type 1
extreme value distribution, the probability that each hospital is chosen is given by: 𝑃𝑟𝑜𝑏(𝑦𝑖 = 𝑎) = 𝑃𝑟𝑜𝑏(𝑈𝑖𝑎 > 𝑈𝑖𝑏) = exp(𝒙𝑖𝑎′ 𝜷 + 𝒘 𝑖 ′𝛼) ∑ exp(𝒙𝑖𝑗′ 𝜷 + 𝒘 𝑖 ′𝛼) 𝑏 𝑗=𝑎 , (3) and 𝑃𝑟𝑜𝑏(𝑦𝑖 = 𝑏) = 𝑃𝑟𝑜𝑏(𝑈𝑖𝑏 > 𝑈𝑖𝑎) = exp(𝒙𝑖𝑏 ′ 𝜷 + 𝒘 𝑖 ′𝛼) ∑ exp(𝒙𝑖𝑗′ 𝜷 + 𝒘 𝑖 ′𝛼) 𝑏 𝑗=𝑎 . (4)
As Green (2012) notes, the terms that are specific to the patient fall out of the probability, which is expected in a model that compares the utilities of the alternatives. Equation (3) and (4) then simplify to:
𝑃𝑟𝑜𝑏(𝑦𝑖 = 𝑎) = exp(𝒙𝑖𝑎 ′ 𝜷) ∑𝑏 exp(𝒙𝑖𝑗′ 𝜷) 𝑗=𝑎 , (5) and 𝑃𝑟𝑜𝑏(𝑦𝑖 = 𝑏) = exp(𝒙𝑖𝑏′ 𝜷) ∑𝑏 exp(𝒙𝑖𝑗′ 𝜷) 𝑗=𝑎 . (6)
Following Sivey (2012), an outside option, which could represent the choice to go private or forgo treatment, is not included in the model. It is assumed that 𝑈𝑖𝑗 is sufficiently high enough at one of the hospitals for the patient to always
seek treatment, which implies a fixed overall demand for treatment, with the model coefficients determining the choice between the two hospitals. As in Sivey (2012), this may be interpreted as a model for the second stage in a two-stage decision process, where the patient firstly decides whether or not to seek treatment and secondly which hospital to seek treatment from.
22
4. Econometric Procedure
In order to estimate 𝜷, I follow the maximum likelihood approach. The choice between hospitals a and b of each of 𝑛 patients is treated as a single draw from a Bernoulli distribution. Given the data for the 𝑛 independent observations, the joint probability function, or likelihood function, is given by:
𝑃𝑟𝑜𝑏(𝑌1 = 𝑦1, … , 𝑌𝑛 = 𝑦𝑛|𝒙) = 𝐿(𝜷|𝒙) = ∏𝑖=1𝑛 ∏𝑏𝑗=𝑎[𝑃𝑟𝑜𝑏(𝑦𝑖 = 𝑗)]𝑑𝑖𝑗, (7)
where 𝑑𝑖𝑗 is an indicator equal to one if hospital 𝑗 is chosen by patient 𝑖.
Therefore, the log of choice probabilities over hospitals and patients takes the form of the log-likelihood:
𝐿𝑛 𝐿(𝜷|𝒙) = ∑ ∑ 𝑑𝑖𝑗𝑙𝑛 [ exp(𝒙𝑖𝑗′ 𝜷) ∑𝑏 exp(𝒙𝑖𝑘′ 𝜷) 𝑘=𝑎 ] 𝑏 𝑗=𝑎 𝑛 𝑖=1 (8)
The maximum-likelihood estimator of 𝜷, 𝜷̂, is such that:
𝜷̂ = argmax
5. Portuguese National Health System
The Portuguese National Health System (SNS) is universal, comprehensive and almost free at the point of use. In addition to it, citizens may benefit from additional insurance coverage in the form of public health subsystems, private health subsystems, and voluntary health insurance.
The SNS is predominantly financed through taxation, although out-of-pocket expenditures exist in the form of copayments, which are charged for services ranging from consultation to emergency visits and differ with the level of care. 7 They are defined as a fixed amount charged for a service, and their core
objective is to regulate demand for public services. Copayments in the SNS correspond only to a small share of the total cost of service. For instance, in 2015 the copayment in polyvalent emergency services was €20.60 but the total cost was estimated to be €112.07, roughly 8.4%.8 In the SNS as a whole, as of
2012, copayments amounted to approximately 1.69% of total NHS revenue, according to the Portuguese Health Regulator (Entidade Reguladora da Saúde – ERS).9 Furthermore, 6.136.188 citizens, 59% of the population, are
exempt from copayments. 10
In the Portuguese Emergency Network, emergency services are classified according to the complexity of the cases they are qualified to treated and the availability of resources as polyvalent, medical-surgical and basic.11 The
polyvalent emergency services are endowed with a greater number of medical specialties and equipped with more resources, corresponding to the
7Decreto-lei n.º 117/2014 (2014.Ago.05). DIÁRIO DA REPÚBLICA: I SÉRIE. n.º 149 pp. 4065-4069 8Circular Normativa da ACSS N.º1/2015/DPS/ACSS and Portaria n.º 234/2015 (2015.Ago.07) DIÁRIO
DA REPÚBLICA: I SÉRIE. n.º 153 pp. 5516-5654
9 O Novo Regime Jurídico das Taxas Moderadoras, Entidade Reguladora da Saúde, available at
https://www.ers.pt/uploads/writer_file/document/892/Estudo_Taxas_Moderadoras.pdf (2016/05/11;
15H44M)
10 Administração Central do Sistema de Saúde, IP. 2016. Taxas moderadoras. Available at
http://www.acss.min-saude.pt/Publicações/TabelaseImpressos/TaxasModeradoras/tabid/142/language/ pt-PT/Default.aspx (2016/08/13; 15H05M)
24 more differentiated level of response to situations of emergency. Medical-surgical emergency services are at an intermediate level, referring to the polyvalent emergency services patients that require more specialized care. Basic emergency services treat only patients with milder conditions, directing the more severe cases to further differentiated hospitals in their referral network.
In Portuguese hospitals, emergency services are obliged to announce in the entrance the number of patients and a measure of the waiting time between triage and the first medical examination for each Manchester Triage System (MTS) classification. The methodology adopted to estimate the waiting time is the arithmetic mean of all emergency care episodes that took place in the previous two hours until the moment of update. The estimate is updated every five minutes.12
6. Empirical Application
6.1 Data and Descriptive Statistics
The data was retrieved from the ALERT database of the polyvalent emergency services of two public Portuguese hospitals located in the city of Porto. The original dataset was comprised of 23,680 observations, referring to all the patients aged 18 and over who sought emergency care at either hospital during the month of April 2016. For each observation, information regarding the hospital from which emergency care was demanded, the date, the patient’s age, gender, copayment exemption status, classification of the MTS color of the bracelet , and parish of residence, the time between admission and triage, and the time between triage and the first medical examination was obtained.13
Following the discussion of the previous section and in order to ensure that only patients who actually chose to seek treatment from one of the two alternatives were included in the sample, only patient initiated contacts are considered. This implies that patients who had been referred from other providers were excluded from the sample, as well as those who had been transported by ambulance. Patients living outside the Porto district were also removed to control for situations in which emergency treatment was demanded by patients that would not normally chose any of the hospitals due to their residence this includes, for example, the case of individuals visiting the region at the time of demand. Finally, observations for which there were missing values for any of the variables were excluded, as well as those for which waiting times displayed negative values, probably due to errors in the introduction of the data.
13 Grupo Português de Triagem. 2016. Sistema de Triagem de Manchester. Available at
http://www.grupoportuguestriagem.pt/index.php?option=com_content&view=article&id=4&Itemid=11 0 (2016/08/13; 14H57M)
26 After these changes, the sample was reduced to 16,380 observations. Table 1 presents descriptive statistics for the original data retrieved from the hospitals. Traveling times to each hospital, computed using the information regarding the patients’ address, is also reported.
Mean S.D. Min. p25 p50 p75 Max.
𝑦𝑖=a 0.579 0.494 0.000 0.000 1.000 1.000 1.000 Age 53.289 19.833 18.000 37.000 53.000 69.000 108.000 Female 0.540 0.498 0.000 0.000 1.000 1.000 1.000 Exempt 0.525 0.499 0.000 0.000 1.000 1.000 1.000 Blue 0.016 0.127 0.000 0.000 0.000 0.000 1.000 Green 0.228 0.419 0.000 0.000 0.000 0.000 1.000 Yellow 0.640 0.480 0.000 0.000 1.000 1.000 1.000 Orange 0.112 0.315 0.000 0.000 0.000 0.000 1.000 Red 0.004 0.063 0.000 0.000 0.000 0.000 1.000 Traveling time 16.566 8.221 3.000 12.000 15.000 20.000 87.000 Time Admission/ Triage 8.330 7.947 0.400 3.300 6.333 11.067 250.500 Time Triage/ Examination 75.906 92.937 0.150 15.100 36.508 103.242 859.333
Table 1 Descriptive Statistics for the original data retrieved from the hospitals (16,380 observations).
Note: yi= a if chosen hospital is hospital a, yi= b if chosen hospital is hospital b; age =
number of years of age; female = 1 if female, female = 0 if male; exempt = 1 if exempt from copayments, exempt = 0 if non-exempt from copayments. Blue, Green, Yellow, Orange, and Red are dummy variables = 1 for patients with the according color of bracelet in the MTS classification.
The median patient is a 53-year-old woman, who is not exempt from copayments. She seeks emergency care from hospital a, where she is classified as a yellow case in the MTS. Besides facing a 15-minute traveling time, she
waits approximately 6 minutes between admission and triage, and another 36.5 minutes until the first medical observation.
In order to estimate the conditional logit model, as discussed in section 3, the original data was used to derive hospital-specific attributes.
Traveling times are the shortest period of time, measured in minutes, required to travel from the patient’s parish to each hospital. 14
In the spirit of Sivey (2012), although available, actual waiting times for each patient at the hospital they visited are not used. The conditional logit model requires the inclusion of waiting times for each hospital in the choice set, and the waiting time patients may have waited had they chosen the other hospital is unknown. Thus, two measures of waiting times for each hospital were constructed instead.
For the waiting time between admission and triage, the measure of waiting time for each patient is the daily median waiting time between admission and triage, in the day they demanded emergency care, at each hospital. It is assumed that, at the arrival at the hospital site, patients form an expectation of the waiting time between admission and triage by assessing the number of people in the queue. The daily median is used as oppose to the mean to offset the impact of outliers.
For the waiting time between triage and the first medical observation, the measure of waiting time for each patient is the daily median waiting time between triage and the first medical observation for the MTS classification they received, in the day they demanded emergency care, at each hospital. The underlying assumption here is that patients would have received the same MTS classification in the two hospitals. The choice of this measure is justified on additional grounds.
14 The time needed to travel from the patient’s residence to the hospital was computed using the
28 Firstly, in the entrance of emergency rooms, Portuguese hospitals are obliged to announce a measure of the waiting time between triage and first medical examination for each MTS classification. Therefore since this information is available to patients at the moment of the choice between staying at the hospital they arrived or seeking care from another hospital it plausible to assume that it is factored in the decision process. Further, it is the expectation of the waiting time and not its ex-post realization that matters for the utility comparison at the moment of choice.
Secondly, following Sivey (2012), the median is used in opposed to the mean to reduce the effect of outliers which may be inferred from Table 1. According to the discussion of the previous section, each emergency care episode is included in the mean computed and made available to patients at the hospitals only for two hours. This implies that the effect of extreme values of waiting times have a short-lived effect on that measure. Since the dataset only allows to compute daily averages of waiting times, the effect of outliers would be larger in that average than it is in the set of averages available to patients. As such, it is argued that the daily median is a more accurate proxy for the information patients take into account in the moment of choice.
Finally, for a few patients, mainly classified as blue and red cases, the measure of waiting time could not be computed due to the inexistence of patients with the same MTS classification in the not chosen hospital in the same day. Consequently, the estimation sample was reduced to 16,310 cases (patients) and 32,620 observations.
Table 2 summarizes the independent variables used in the conditional logit estimation.
Variables Description
traveling Shortest period of time, measured in minutes, required to travel from the patient’s parish to each hospital.
medianwaiting1
Daily median waiting time between admission and triage for each hospital.
medianwaiting2
Daily median waiting time between triage and the first medical observation for each MTS classification at each hospital.
epblue
Daily number of patients classified as non-urgent in the MTS classification (blue bracelet) at each hospital.
epgreen Daily number of patients classified as standard in the MTS classification (green bracelet) at each hospital.
epyellow
Daily number of patients classified as urgent in the MTS classification (yellow bracelet) at each hospital.
eporange
Daily number of patients classified as very urgent in the MTS classification (orange bracelet) at each hospital.
epred
Daily number of patients classified as immediate in the MTS classification (red bracelet) at each hospital.
Table 2Variable description.
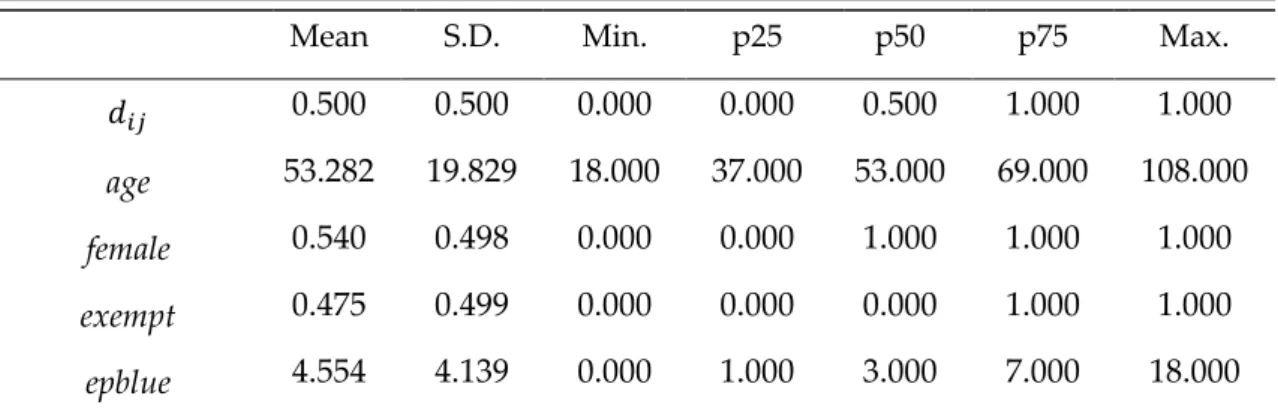
Table 3 reports descriptive statistics for the variables used in the estimation.
Mean S.D. Min. p25 p50 p75 Max.
𝑑𝑖𝑗 0.500 0.500 0.000 0.000 0.500 1.000 1.000
age 53.282 19.829 18.000 37.000 53.000 69.000 108.000
female 0.540 0.498 0.000 0.000 1.000 1.000 1.000
exempt 0.475 0.499 0.000 0.000 0.000 1.000 1.000
30 epgreen 62.934 31.533 17.000 34.000 58.000 90.000 123.000 epyellow 176.562 23.749 120.000 159.000 178.000 193.000 230.000 eporange 30.975 11.362 11.000 21.000 31.000 41.000 56.000 epred 1.101 1.104 0.000 0.000 1.000 2.000 4.000 traveling 18.262 8.516 3.000 13.000 17.000 23.000 87.000 medianwait1 6.599 1.862 2.767 5.167 6.350 7.333 11.183 medianwait2 45.223 29.757 0.150 29.517 39.600 53.050 417.700
Table 3 Descriptive Statistics for the estimation sample (32,620 observations).
The median patient is a 53-year-old woman, who is not exempt from copayments.15 Among the two choices, the composition of emergency care
demand, on the day the median patient seeks treatment, is as follows: 3 blue, 58 green, 178 yellow, 31 orange, and 1 red cases. Also among the two choices, the median patient faces a 17-minute traveling time, waits 6.35 minutes between admission and triage and almost 40 minutes until the first medical observation.
In order to estimate the model it is assumed that 𝒙𝑖𝑗 are exogenous to every
decision-maker i.e., the patient. As Sivey (2012) notes, this is a plausible assumption given that the patients are relatively small and numerous compared to the hospitals, making the effect of the marginal patient on waiting times negligible. In fact, it seems unlikely that an individual patient choice of hospital would have an impact in a given hospital’s waiting times. However, to control for possible effects of demand on waiting times, the number of daily episodes by MTS classification are included in 𝒙𝑖𝑗.
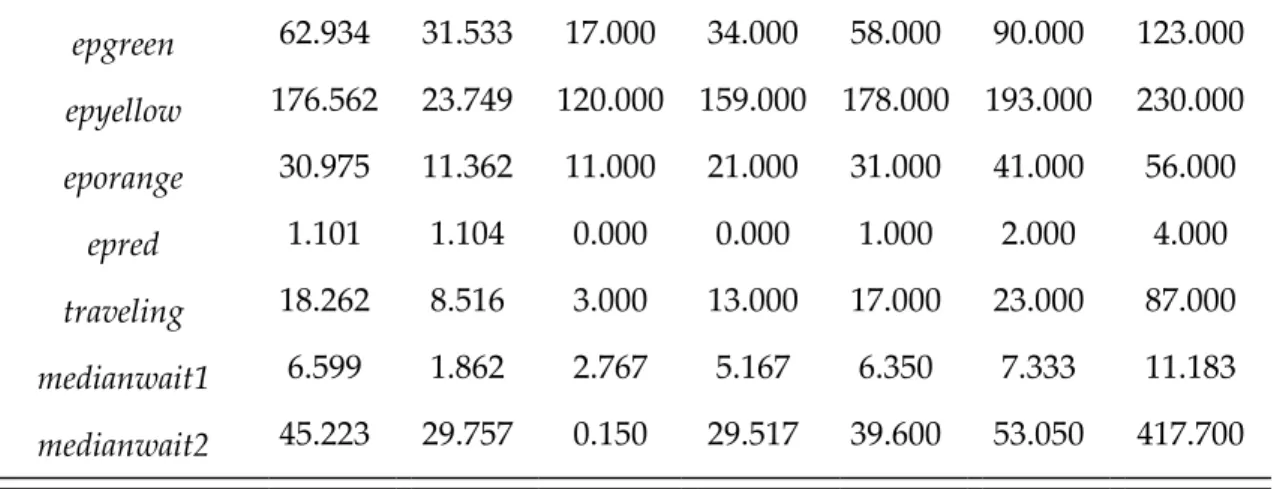
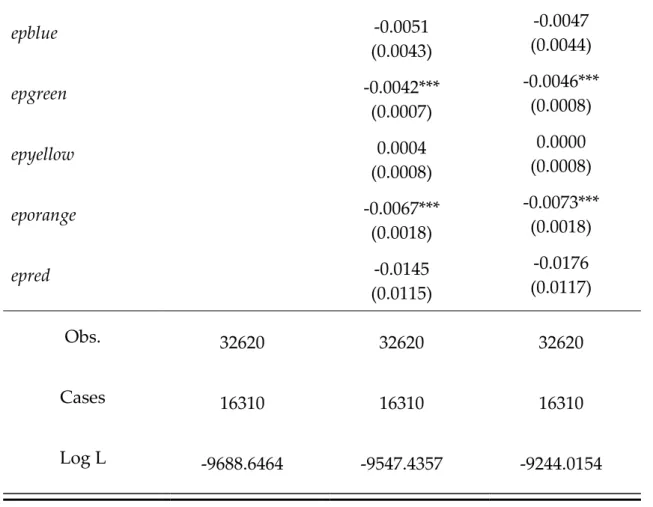
6.2 Preliminary Analysis
In this subsection, a first data-driven attempt to investigate the link between waiting times and the demand for emergency care is carried out. To the extent
that there is one, the relationship between waiting times and demand might not be strictly demand-sided. If it is, as discussed in Sections 1 and 2, waiting times assume the role of a demand-curbing mechanism by acting like a non-monetary price. All else equal, it is expected that lower waiting times lead to increased demand. However, it may be the case that the relationship is supply-sided in the sense that waiting times are a result of excess demand. That is, waiting times increase because demand is above the hospital’s capacity.
Table 4 presents descriptive statistics for the traveling and waiting times variables for the chosen and not chosen hospital. From the table, no consistent pattern between traveling time, waiting time, and choice can be inferred. On average, traveling time is shorter for the chosen hospital, waiting times between admission and triage are similar, and waiting times until the first medical observation are longer in the chosen hospital for except for high severity cases (orange and red). Considering the median instead yields identical conclusions. This implies that traveling time may be an important determinant of hospital choice, while waiting times may not. This type of analysis, however, has the significant shortcoming of considering each variable individually, which diminishes the validity of its conclusions.
Chosen hospital
Mean S.D. Min. p25 p50 p75 Max.
traveling 16.570 8.220 3.000 12.000 15.000 20.000 87.000 medianwait1 6.608 1.887 2.767 5.167 6.350 7.333 11.183 medianwait2 (blue) 138.507 110.206 10.600 43.400 90.650 235.367 417.700 medianwait2 (green) 44.915 15.934 19.300 32.717 41.300 53.367 99.908
32 medianwait2 (yellow) 50.033 26.049 24.550 33.400 40.892 56.117 161.892 medianwait2 (orange) 15.734 8.761 4.350 8.850 12.650 20.400 41.767 medianwait2 (red) 16.156 10.771 0.150 8.708 14.350 21.433 39.450 Not chosen hospital
traveling 19.954 8.472 3.000 14.000 18.000 25.000 87.000 medianwait1 6.589 1.837 2.767 5.167 6.350 7.333 11.183 medianwait2 (blue) 120.006 123.960 10.600 32.967 59.000 180.900 417.700 medianwait2 (green) 38.021 14.130 19.300 28.050 33.750 43.800 99.908 medianwait2 (yellow) 49.623 25.617 24.550 33.400 40.892 53.967 161.892 medianwait2 (orange) 18.269 8.257 4.350 12.317 19.000 23.500 41.767 medianwait2 (red) 17.796 11.996 0.150 10.200 16.267 23.350 39.450
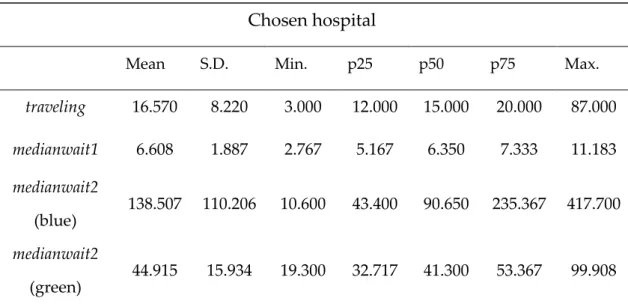
7. Results and Discussion
Table 4 presents the results for three specifications of the conditional logit model.16
Specification 1 includes traveling and waiting times as sole explanatory variables. The estimates show a statistically significant negative effect of traveling and the waiting time between triage and the first medical observation on the probability of utilization and a statistically significant positive effect of medianwait1. In order to evaluate if these results are biased because of a correlation of waiting times and demand factors, a second specification that adds the daily number of episodes (patients) by MTS classification is estimated. The significance and the sign of the above results hold when the daily number of episodes by MTS classification which are used to control for the possible correlation between waiting times and overall demand are included. However, the absolute value of the coefficient of the traveling time variable increases, and the impact of waiting times is reduced in a non-trivial manner.
In order to evaluate whether these results are biased of correlation of waiting times with patient-specific characterizes a third specification is estimated. Specification 3 includes the traveling and waiting times variables, their interactions with patient-specific characteristics, and the daily number of episodes by MTS classification. The estimate for the effect of traveling time is robust across specifications and actually increases as more variables are included in the model. Although marginally, this effect is stronger for older patients and offset by copayment exemption, arguably because the total cost (monetary and non-monetary) is smaller for exempt patients. On the other hand, the sign of the coefficients on the waiting time variables are reversed in
34 the last specification. The effect of waiting time between admission and triage becomes insignificant, as well as that of its interactions. Besides the change in the sign of the effect of medianwait2, its magnitude is considerably small in all model specifications. The net effect of traveling and waiting times may be further investigated by analyzing the marginal effects reported in Table 5.
Specification 1 Specification 2 Specification 3
traveling -0.1271*** (0.0025) -0.1562*** (0.0032) -0.1947*** (0.0084) × age -0.0003*** (0.0001) × female 0.0071 (0.0051) × exempt 0.0945*** (0.0052) medianwait1 0.0201*** (0.0069) 0.0144* (0.0081) -0.0009 (0.0227) × age 0.0002 (0.0004) × female -0.0076 (0.0142) × exempt 0.0176 (0.0143) medianwait2 -0.0045*** (0.0005) -0.0018*** (0.0005) 0.0075*** (0.0016) × age -0.0001*** (0.0000) × female 0.0004 (0.0010) × exempt -0.0096*** (0.0010)
epblue -0.0051 (0.0043) -0.0047 (0.0044) epgreen -0.0042*** (0.0007) -0.0046*** (0.0008) epyellow 0.0004 (0.0008) 0.0000 (0.0008) eporange -0.0067*** (0.0018) -0.0073*** (0.0018) epred -0.0145 (0.0115) -0.0176 (0.0117) Obs. 32620 32620 32620 Cases 16310 16310 16310 Log L -9688.6464 -9547.4357 -9244.0154
Table 5 Estimation Results.
Standard errors reported in parenthesis. *** p<0.01, **p<0.05, *p<0.1
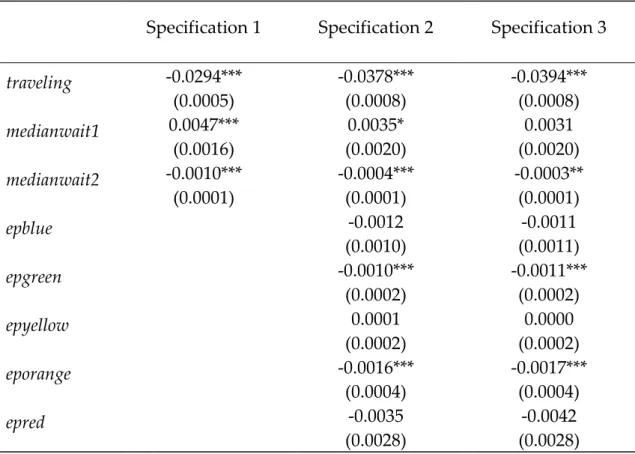
The estimated marginal effects reveal that traveling time has a robust, statistically significant, negative effect on the probability of utilization, while confirming that the waiting time between admission and triage is not likely to affect demand decisions. As far as the impact of the waiting time between triage and the first medical observation is concerned, its net effect turns out to be negative, statistically significant, though very close to zero.
The estimates of Specification 3 imply that a standard deviation increase in the waiting time between triage and the first medical observation (approximately, 30 minutes) reduces the probability of seeking emergency care from a given hospital by 0.009 percentage points, ceteris paribus, which suggests that waiting times are a weak determinant of hospital choice. An increase of the same magnitude in the traveling time reduces the probability
36 of utilization by 5.841 percentage points, ceteris paribus. Note that, due to the inclusion of the daily number of episodes, the marginal effect of medianwait2 only captures the effect of supply-side induced changes in waiting times, such as changes in hospital capacity.
These results may be due to the nature of emergency care i.e., patients in urgent need of medical care are unlikely to forgo treatment even when faced with a high time cost or to the fact that patients only learn the expectation of waiting times at the hospital site, and, once they arrive, traveling to another hospital might not be a suitable alternative to most patients. This is consistent with the larger effect of traveling times, which may be anticipated by patients at a prior point in time.
Specification 1 Specification 2 Specification 3 traveling -0.0294*** (0.0005) -0.0378*** (0.0008) -0.0394*** (0.0008) medianwait1 0.0047*** (0.0016) 0.0035* (0.0020) 0.0031 (0.0020) medianwait2 -0.0010*** (0.0001) -0.0004*** (0.0001) -0.0003** (0.0001) epblue -0.0012 (0.0010) -0.0011 (0.0011) epgreen -0.0010*** (0.0002) -0.0011*** (0.0002) epyellow 0.0001 (0.0002) 0.0000 (0.0002) eporange -0.0016*** (0.0004) -0.0017*** (0.0004) epred -0.0035 (0.0028) -0.0042 (0.0028)
Table 6 Marginal Effects at the mean.
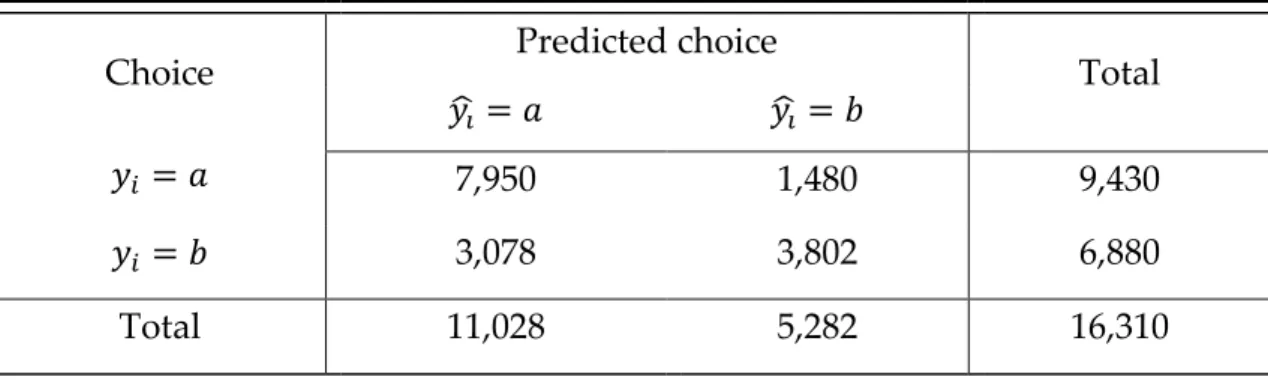
Finally, the goodness of fit of Specification 3 is assessed by cross tabulating the predicted,𝑦̂𝑖, versus actual outcome, 𝑦𝑖, in Table 6. Predicted outcomes are
defined as:
𝑦̂ = 𝑎 𝑖𝑓 𝑃𝑟𝑜𝑏(𝑦𝑖 ̂𝑖 = 𝑎) > 𝑃𝑟𝑜𝑏 (𝑦̂𝑖 = 𝑏), (10) where 𝑃𝑟𝑜𝑏(∙)̂ denotes the estimated probability according to Specification 3. The values of Table 6 yield a percentage of correct classifications of 72.05%.
Choice Predicted choice Total
𝑦̂ = 𝑎 𝑖 𝑦̂ = 𝑏 𝑖
𝑦𝑖 = 𝑎 7,950 1,480 9,430
𝑦𝑖 = 𝑏 3,078 3,802 6,880
Total 11,028 5,282 16,310
38
8. Policy Implications
From a policy standpoint, traveling times have limited relevance. Unless when deciding the site of construction of new health care facilities which is usually a decision for the very long run that does not happen often , policymakers cannot easily influence traveling times.
According to the results of the previous section, it is the waiting time between triage and the first medical observation that matter for patients’ choice. Unlike traveling time, waiting times at the hospital site can be subject to policy intervention. By expanding medical capacity or increasing efficiency, waiting times between triage and the first medical observation might be reduced. If the results suggest that such policies would not foster consumer welfare a great deal, they also indicate that waiting times are not a suitable demand-curbing mechanism, contradicting the literature that assigns them a policy role.
Although the data does not allow for the estimation of consumer surplus, it is plausible to admit that changes in waiting times would not have significant impact on consumer welfare in the case of emergency care. It may be the case that patients are more tolerant to waiting once they arrive at the hospital
site-possibly, due to a safety feeling or because going to a different hospital is not a suitable option for patients in need of emergency care. One way to make demand more responsive to waiting times is to make information regarding them available to consumers prior to their arrival at the hospital. The Portuguese ministry of health has already implemented policies towards that goal by making available online the same information on waiting times emergency services display at the site.
Finally, it is important to stress that if data from hospitals with different copayments is included, the framework may be used to evaluate the costs
imposed on patients by traveling and waiting times, thereby complementing cost-benefit analysis of hospital location and emergency care management.
40
9. Concluding Remarks
In this study, patient choice of emergency care providers in a duopoly setting without outside option was analyzed. Placing emphasis on the role of hospital-specific attributes traveling and waiting times , a conditional logit model was estimated with data from two Portuguese public hospitals. The available dataset opened the possibility of dividing waiting times into two components: the period between admission and triage and the period between triage and the first medical observation. The major conceptual challenge, as is common in this type of works, was how to proxy the information available to patients regarding waiting times at the moment of choice.
Negative and statistically significant effects of traveling time and the time between triage and the first medical observation were found, even when controlling for patient-specific characteristics and for correlation between waiting times and aggregate hospital demand. The size of the effects, though, is quantitatively small, particularly for the measure of waiting time. The fact that traveling time seems to matter more than waiting time indicates that the former may not be at least, entirely factored in by patients at the moment of choice, arguably due to lack of information. In turn, this suggests that actual choice of emergency care provider might not occur at the hospital site, after collecting information that allows patients to form an expectation of the waiting time, but before arrival, when only traveling times are anticipated. The low responsiveness of the probability of utilization of a given hospital to waiting times has somewhat striking policy implications. Both policymakers aiming at reducing waiting times in order to foster welfare or, conversely, policymakers wishing to use waiting times as has been long proposed in the Health Economics literature to discourage utilization may fall short of the intended goals.
It is noteworthy that such results might be motivated by the nature of emergency care itself and that they should not be carried over to other dimensions of health care provision lightly. Requiring immediate care, patients are likely to forgo search and seek treatment from the nearest provider or from the provider with which they have a previous or on-going relationship.
Finally, the major shortcomings of the current work are closely related to opportunities for further research. The most promising extension would be to collect data that allows for the possibility of including a measure of patients’ opportunity cost. A common measure would be the hourly salary for employed patients. As the burden of waiting is closely related to what is sacrificed, controlling for the opportunity cost might provide additional and important insight into patient choice.
42
References
Acton, J.P. 1975. Non-monetary factors in the demand for medical services: some empirical evidence. Journal of Political Economy, 83: 595–614.
Acton, J.P. 1976. Demand for health care among the urban poor, with special emphasis on the role of time. In Richard N. Rosett (Ed.), The role of health insurance in the health services sector: 163-214. New York, NY: National Bureau of Economic Research.
Arrow, K. J. 1963. Uncertainty and the welfare economics of medical care. American Economic Review, 82(2): 141-149.
Barros, P. P. 2012. Health policy reform in tough times: The case of Portugal. Health Policy. 106(1): 17-22.
Barros, P. P., Afonso, H. , Martins, B. , & Pereira, D. 2013. Impacto das taxas moderadoras na utilização de serviços de saúde. Lisbon: Nova School of Business and Economics, Universidade Nova de Lisboa.
Barros, P. P., Machado, S. R. & Simões, J. A. 2011. Portugal: Health system review. Health Systems in Transition 13(4):1–156.Becker, G. 1965. A theory of the allocation of time. The Economic Journal, 75: 493–517.
Blundell, R. & Windmeijer, F. 2000. Identifying demand for health resources using waiting times information. Health Economics, 9: 465–474.
Brekke, K. R., Siciliani, L. & Straume, O. R. 2008. Competition and waiting times in hospital markets. Journal of Public Economics, 92: 1607-1628.
Cauley, S. 1987. The time price of medical care. The Review of Economics and Statistics, 69(1): 59–66.
Duarte, F. 2012. Price elasticity of expenditure across health care services. Journal of Health Economics, 31(6): 824-841.
Greene, W. H. 2000. Econometric analysis (International edition) (7th ed.).
Essex: Pearson.
health. Journal of Political Economy, 80(2): 223–255.
Lourenco, O. D., & Ferreira, P. L. 2005. Utilization of public health centers in Portugal: effect of time costs and other determinants. Finite mixture models applied to truncated samples. Health Economics, 14(9): 939-953.
Oliveira, M. 2004. Modeling demand and supply influences on utilization: a flow demand model to predict hospital utilization at the small area level. Applied Economics, 36(20): 237-251.
Phelps, C. & Newhouse, J. 1974. Coinsurance, the price of time, and the demand for medical services. The Review of Economics and Statistics, 56(3): 334–342.
Puig-Junoy, J., Saez, M., & Martinez-Garcia, E. 1998. Why do patients prefer hospital emergency visits? A nested multinomial logit analysis for patient-initiated contacts. Health Care Management Science, 1(1): 39-52.
Ramos, P. & Almeida, A. 2015. The impact of an increase in user costs on the demand for emergency services: the case of Portuguese hospitals. Health Economics, 25(11): 1372-1388.
Santana, P. 1996. Utilização dos cuidados hospitalares. Uma abordagem da geografia da saúde. In A. Vaz, C. G. Pinto, F. Ramos & J. Pereira (Ed), As reformas dos sistemas de saúde: 183-208. Lisboa: Associação Portuguesa de Economia da Saúde.
Siciliani, L. 2008. A note on the dynamic interaction between waiting times and waiting lists. Health Economics, 17: 639–647.
Sivey, P. 2012. The effect of waiting time and distance on hospital choice for English cataract patients. Health Economics, 21(4): 444-456.