1. Introduction
Sales & Operations Planning process can be conceptualized as a process that unites different business plans in a single integrated set of plans (Association for Operations Management, 2009). The process has the intention to balance demand and supply and link strategic and operational plans of the company (Wallace, 2004; Muzumdar
& Fontanella, 2006; Lapide, 2005a; 2006; Feng et al., 2008; Association for Operations Management, 2009; Wight, 2009; Voluntary Interindustry Commerce Solutions, 2010; Thomé et al., 2012a), in which decisions are made at a tactical level, and which mainly covers middle and top management (Moon, 2006; Ivert & Jonsson, 2010; Lapide, 2011). S&OP has become a key process in organizations since it allows a holistic planning, balances demand and supply and integrates organizational functions, as well as strategic and operational plans (Affonso et al., 2008; Tuomikangas & Kaipia, 2014; Ivert et al., 2015a, b). When properly implemented, S&OP can lead to a responsive supply chain (Lapide, 2004) and add value to the firm (Thomé et al., 2012a; 2014).
After S&OP implementation, process cycles are performed and the process is then incorporated in the organization, making the process progress, resulting in higher levels of communication and internal collaboration, as well as bringing solutions and preventing problems (Voluntary Interindustry Commerce Solutions, 2010). The evolution of the process involves different degrees of maturity, making it possible to evaluate, classify and
Proposal of a model for sales and operations planning
(S
&
OP) maturity evaluation
Carolina Belotti Pedrosoa*, Lucas Daniel Del Rosso Calachea, Francisco Rodrigues Lima Juniorb,
Andrea Lago da Silvac, Luiz César Ribeiro Carpinettia
aUniversidade de São Paulo, São Carlos, SP, Brazil bUniversidade Tecnológica Federal do Paraná, Curitiba, PR, Brazil
cUniversidade Federal de São Carlos, São Carlos, SP, Brazil
*carolina.belotti@usp.br
Abstract
A successful S&OP implementation can bring many benefits to organizations, and after its implementation, the S&OP process can evolve and reach higher levels of maturity. Considering that, only through a measurement system, goals and benefits can be achieved, thus, it is essential to assess S&OP maturity level. Many papers on literature adopt a quantitative perspective on S&OP, but just few of them deal with uncertainty present in S&OP decision-making, such as maturity model assessment process that carries subjectivity and uncertainty. Thus, this study proposes a decision making model based on fuzzy theory to evaluate and to categorize S&OP maturity levels and to suggest strategies to increase S&OP maturity. A pilot application was conducted in two manufacturing organizations that have implemented the S&OP process. The results, according to the performance presented, suggest different actions must be taken in terms of ensuring enablers to S&OP implementation.
Keywords
Sales and operations planning. Maturity model. Fuzzy inference. Fuzzy set theory.
How to cite this article: Pedroso, C. B., Calache, L. D. R., Lima Júnior, F. R., Silva, A. L., & Carpinetti, L. C. R. (2017). Proposal of a model for sales and operations planning (S&OP) maturity evaluation. Production, 27, e20170024. http:// dx.doi.org/10.1590/0103-6513.20170024
ensure means of measuring its progress over time (Grimson & Pyke, 2007). The use of maturity models is an effective way to measure the evolutionary stage of the S&OP process. A process with a high level of maturity includes a review of deviations from operational plans, budgets and supply plans with respect to organizational goals (Bower, 2005). In discussion regarding an “ideal” S&OP process, Lapide (2005a) stated about the stages that “while they can never all be executed to the fullest extent, they represent an ideal process toward which companies should evolve, yielding and improving supply chain management”.
In order to reach higher levels in the S&OP process, it is essential that the number of relationships and collaboration between suppliers and consumers be increased. In addition, there must be alignment between S&OP plans with customers’ and suppliers’ plans to obtain an even higher level of maturity (Lapide, 2005b). As stated by Noroozi & Wikner (2017), performance measurement is instrumental in providing information on whether the expected benefits have been obtained. Thus, S&OP measurement is critical to its success and of great importance to both performance and improvement of the process. Thus, it is important to control S&OP process, and this can be accomplished by evaluating the stages of maturity achieved by the process in the course of its cycles.
According to Thomé et al. (2012a) there are few studies that address maturity models in an integrated perspective. In addition, few studies show how maturity models can be applied in illustrative cases or in real situations. More recent research started to realize the importance of studying real contexts, for example, Goh & Eldridge (2015) explore S&OP in two companies in the context of new product introduction, in which data available in the supply chains was gathered and assessed according to an S&OP maturity framework. Hulthén et al. (2016) evaluated S&OP maturity in five companies. Wagner et al. (2014) also explored S&OP maturity evaluation in a pharmaceutical company that was in the early stages of its implementation.
Fuzzy set theory has been widely used to deal with decision-making processes grounded on imprecise and vague information of a problem (Abdullah et al., 2013). A fuzzy inference system is designed through on an if-then framework based on specialists’ judgments that represent human reasoning and subjectivity from decision makers (Osiro et al., 2014). As S&OP maturity evaluation is a highly subjective process and depends on decision-makers’ opinions, fuzzy set theory is a suitable technique to address this kind of issue. Other existing multi-criteria decision-making methods carry some limitations when compared to fuzzy set theory. For example, liner programming demands historical data that can be difficult to obtain, qualitative data is challenging to interpret, and AHP (Analytic Hierarchy Process) uses paired comparison scales that can be subject to human error. Also, fuzzy inference system is highlighted in the literature because of its ability to capture and keep the experts’ knowledge of the problem domain and to model human reasoning. This is possible because the technique is designed by if-then scenarios designed by the experts. Moreover, the evaluation of alternatives by others approaches such as AHP and ANP is limited (Osiro et al., 2014). In this context, this study proposes a decision making model based on fuzzy inference to evaluate and to categorize different levels of maturity, and to suggest strategies to increase S&OP maturity level. Several S&OP maturity models were analyzed aiming to identify enablers and dimensions used by the existing models. Two decision making models based on fuzzy inference are developed based on S&OP enablers and dimensions identified in the previous phase. The maturity level of S&OP can be classified into four categories considering dimensions related to “process” and “tools”. According to the classification results, different strategies are suggested to increase the maturity level. Computational implementation of the proposed model was made using the software MATLAB. A pilot application was conducted aiming to evaluate the S&OP maturity of two organizations of different economic sectors.
2. General aspects of maturity models
Maturity can be referred to as the development of a beginning phase to a more advanced one. This process implies that intermediate phases are present in the course of maturity gaining. Maturity also means that a process is effective and properly implemented in an organization, without the need of bureaucracies and regulations. Common elements in maturity models are the notion of various dimensions evaluated and distinct maturity levels, describing the performance of which dimension at different maturity levels (Fraser et al., 2002). In turn, maturity levels can be characterized as the evolutionary path towards a more mature process, in which each level presents its own goals that need to be achieved in order to get a higher maturity level. When the goals of a given maturity level are reached, process improvements are gained, benefiting the whole organization (Paulk, 1993; Lapide, 2005a).
and presented five levels: uncertainty, awakening, enlightenment, wisdom and certainty. After that, several maturity models have emerged, highlighting the Capability Maturity Model (CMM) for software development created by Paulk (1993) which intended to create a broader view of the previous model, aggregating more layers of complexity. CMM also has five evolutionary stages: initial, repeatable, defined, managed and optimizing (Mendes Junior et al., 2016). There are basically three types of maturity models: (i) maturity grids; (ii) Likert scale based questionnaires; (iii) continuous models. Maturity grids are models with relatively low complexity, in which texts are used to describe the activities performed in each evolutionary level. Likert scale questionnaires evaluate best practices according to a pre-established ranking in which the performance resulted is related to a given evolutionary stage. Continuous models are the most complete and complex among the existing maturity levels, created based on CMM model, and having general and specific goals for each dimension and for each evolutionary stage. It can be also noted that common elements in maturity models are the notion of various dimensions evaluated at distinct maturity levels, describing the performance of which dimension at different maturity levels (Fraser et al., 2002; Mendes Junior et al., 2016).
2.1. S
&
OP maturity models
The majority of the papers that explore S&OP under a quantitative perspective, in general, are based on mathematical models and simulation (Affonso et al., 2008; Chen Ritzo et al., 2010; Feng et al., 2010; Wang et al., 2012; Hahn & Kuhn, 2012; Mendoza et al., 2014; Lim et al., 2014; Zhao et al., 2014; Calfa et al., 2015; Taşkın et al., 2015; Wochner et al., 2016), addressing mainly the issue of aggregate planning. As Olhager & Rudberg (2002) state that the term “aggregate planning” is usually used to refer to mathematical programming methods in relation to S&OP supply planning. Some other quantitative studies are survey based, like Thomé et al. (2012b) and Thomé et al. (2014), intending to promote a bigger picture of the S&OP scenario. Some papers that use an artificial intelligence technique were found. The study of Rexhausen et al. (2012) investigates the relationship between S&OP integration and demand management performance. Chen & Sarker (2015) applied the fuzzy linear programming method to deal with aggregate production planning. Rabbani et al. (2015) that used evolutionary methods and particle swarm optimization also applied to aggregate planning. Thomas et al. (2011) used neural network to address aggregate and operational planning issues. These approaches are suitable for problems that they address, but in the case of S&OP maturity evaluation lacks a decision-making model that can deal with uncertainty and subjectivity of decision-makers’ opinions. That is why it was chosen the fuzzy set theory. As Zadeh (1965) states, fuzzy set theory is suitable for modeling decision making processes, where imprecise and vague information are present. Thus, a relevant advantage from the application of fuzzy inference for S&OP maturity evaluation refers to the possibility of modeling qualitative information and vague and imprecise values of the variables related to S&OP.
S&OP process includes activities such as meetings, demand forecast, integration of plans and performance measurement (Calfa et al., 2015). Various evaluation models of S&OP maturity have been proposed by different authors (Wing & Perry, 2001; Lapide, 2005b; Ventana Research, 2006; Grimson & Pyke, 2007; Feng et al., 2008; Viswanathan, 2009; Cecere et al., 2009). Among these S&OP maturity models, the model proposed by Grimson & Pyke (2007) stands out since it presents a broader approach.
The framework elaborated by Grimson & Pyke (2007), consists of five evolutionary stages, analyzed in the following categories: meetings and collaboration, organizational structure, measures of performance, information technology, and integrated planning. This maturity model shows a more detailed analysis, which explores five dimensions (meetings, organization, measurement, information technology, and integrated plan) using a five-level process evolution scale - Without S&OP, S&OP Reactive, S&OP Standard, S&OP Advanced and S&OP Proactive.
The maturity model proposed by Lapide (2005b) presents four evolutionary stages, in which each of them is analyzed in terms of meetings, alignment between demand and supply, and technology used to support the process. The evolutionary path initiates with a Marginal process, and goes towards Rudimentary process, Classical process and Ideal process. The fourth and final stage, “Ideal Process”, in practice cannot be achieved by companies, but can be used as benchmarking in order to stimulate continuous improvement.
Cecere et al. (2009) state that S&OP must achieve a demand driven status, thus, as the process advances, more balance can be incorporated in the organization. The framework developed on this research consists of four steps: reacting, anticipating, collaborating, and orchestrating. Each step is evaluated in terms of balance between demand and supply, S&OP process goals, ownership, and metrics used to measure the process. The last step is the ideal situation that must be pursued.
integrated and proactive. S&OP is assessed in this paper according to the following dimensions: (i) process effectiveness that includes general characteristics and activities of the process; its sub-dimensions are: degree of formalization, scope, and collaboration and alignment; (ii) process efficiency is related to plans integration and alignment, composed of three sub-dimensions: information preparation and sharing; meeting efficiency; and KPI measurement; (iii) people and organization (that is specifically directed to the two sub-dimensions: roles, responsibility and organizational structure; and knowledge, commitment, and executive sponsorship); (iv) and information technology (covers three sub-dimensions: systems and functionalities, degree of integration, and master data).
Goh & Eldridge (2015) explore the S&OP maturity in situations in which a supplier is integrated in the process. The authors take Grimson and Pyke’s maturity model and classify it into two main dimensions, internal collaboration and external collaboration. Internal collaboration is related to the Stages 1 to 3 of Grimson and Pyke’s model, and it enables closer interactions in daily operations, in which cross-functional integration is key. Between internal and external collaboration there is, a gap that can be attributed to the Stages 4 and 5 of the refereed maturity model. External Collaboration involves supplier and customer integration and CPFR. The authors suggest that best-in-class organizations pursue internal and external collaboration integration. Two companies were investigated, one that had internal S&OP practices and another that presented an S&OP process with supplier integration. S&OP maturity degree of these companies were assessed based on Grimson and Pyke’s maturity model. The results show that in both cases S&OP brought benefits regarding to supply chain performance, being that the organization that presented the traditional S&OP gained lead time reduction in new products introduction. The organization that had a supplier integrated into the S&OP process benefited from improvements in forecast accuracy and inventory level reduction.
The most recent study that has arisen is a qualitative framework developed by Hulthén et al. (2016) that aims to measure S&OP performance. This research is based on multiple case studies, among cross-industry organizations, in which data has been collected in five companies. S&OP measures developed by this framework were classified as effectiveness measures and efficiency measures. Effectiveness measures include demand related measures (i.e. forecast accuracy), supply related measures (i.e. inventory measures), and other measures. Efficiency measures are: process, organization, and people. Here, “process” is associated to demand and supply planning conducted on a daily basis, and “organization” refers to communication of S&OP measures throughout the organization, and “people” is related to cross-functional teams and participation of managers in the process. Many metrics for S&OP maturity evaluation have been suggested in the literature. Table 1 summarizes some metrics used by conceptual models of S&OP maturity evaluation. The most used metrics are “Integrated Planning”, followed by “Technology”, “Meetings” and “Processes”. It demonstrates the importance of these metrics, and it is a good sign they should be considered in the S&OP maturity model.
Table 1. Metrics used by S&OP maturity models.
W in g & P er
ry (2001) Lap
id e (2 0 0 5 b) V en ta n a R es ea rc h (2 0 0 6 ) G ri ms on & P yk e (2007) Fe n g e t a l. (2 0 0 8 ) V is w an ath an (2 0 0 9 ) C ec er e e t a l. (2 0 0 9 ) W ag n er e t a l. (2 0 1 4 ) G oh & El d ri d ge (2015) Hu lth én e t a l. (2 0 1 6 )
Technology ✓ ✓ ✓ ✓
Reunions ✓ ✓
Process ✓ ✓
Process organization ✓
Measurement ✓ ✓ ✓
Integrated Planning ✓ ✓ ✓ ✓ ✓
Service Level ✓
Return of inancial assets ✓
Forecast accuracy ✓
Goals ✓
Ownership ✓
Demand measures ✓
Supply measures ✓
Communication ✓
Cross-functional teams ✓ ✓
People/ organization ✓ ✓
Activities/ characteristics ✓
Taking into consideration that a successful S&OP implementation can ensure robustness and return the expected benefits, it is believed that a successful S&OP implementation is also responsible for bringing maturity to the process. In turn, a successful S&OP implementation depends on enablers, thus, they are critical elements for maturity gaining.
3. Fuzzy set theory
Fuzzy set theory is suitable for addressing decision making situations involving qualitative factors and vague, imprecise and subjective information (Herrera & Martínez, 2001). The fuzzy set theory was introduced by Zadeh (1965), with the purpose to represent qualitative information (Wang, 2010) and imprecise quantitative data (Herrera & Martínez, 2001). Fuzzy set can be conceptualized as a class of objects characterized by a membership function, which assigns a certain degree of inclusion (Zadeh, 1965). Fuzzy logic differs from classical logic due to its ability to allow that a certain objective can be partially included in more than one set at the same time. Considering the characteristics of fuzzy systems, especially their ability to deal with uncertain information and to deal with elements that are difficult to measure, such a technique is increasingly being applied to management problems (Santos et al., 2012; Lima Junior & Carpinetti, 2013). Also, in decision making problems, fuzzy rule-based classification methods are very suitable for categorizing sets of alternatives according to their similarity (Lima Junior et al., 2013).
3.1. Fundamental definitions
3.1.1. Fuzzy set
Let X be the universe of discourse and x an element of X. The A set in X is characterized by a membership function µA(x) that associates each point x in X to a real value in the interval [0,1] that represents the degree of inclusion of x in A. Thus, µA(x) can assume any real value within the interval [0,1], and, if µA(x)=0, x does not belong to the set A, however, if µA(x)=1, x is totally included in the set A. Therefore, have been ∀ x ∈ X, A={{x, µA(x)}}, where the degree of membership of any x can be calculated by the membership functions (Zadeh, 1965; Bellman & Zadeh, 1970; Zimmermann, 2010). A fuzzy number is a fuzzy set that attends the properties of normality and convexity. A fuzzy set is normal if, and only if, there is at least one element with µA(x)=1. A fuzzy set is convex if and only if ∀ x1 and x2∈ X and ∀λ∈ [0,1], fA(x)[λx1+(1- λ)x2]≥min[fA(x1), fA(x2)] (Zadeh, 1965; Bellman & Zadeh, 1970).
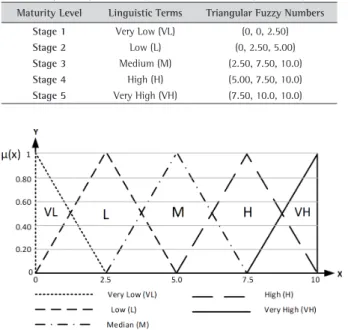
3.1.2. Triangular membership functions
When variables are represented by triangular fuzzy numbers (Figure 1), the membership function that represents xi∈ X can be obtained by Equation 1.
( )
0 ,
1
,
1
,
0 .
i
i
i A i
i
i
i
for x l x
for a x m
m x
u x
for m x u
u m
for x u
µ
<
−
≤ ≤
−
= − ≤ ≤ −
>
(1)
3.1.3. Intersection and union
Intersection and union of two fuzzy sets A and B can be obtained by means of its operations A∩B = min(µA(x), µB(x)), ∀ x ∈ X and AUB = max(µA(x),µB(x)), ∀ x ∈ X (Zadeh, 1965; Bellman & Zadeh, 1970).
3.1.4. Algebraic operations with fuzzy numbers
Let A=(a1,b1,c1) and B=(a2,b2,c2) be a fuzzy number, algebraic operations of addition, multiplication, subtraction, and division can be obtained, respectively, by Equation 2, Equation 3, Equation 4 and Equation 5 (Lima Junior et al., 2014).
( 1 2, , 1 2 1 2)
A+ =B a+a b +b c +c (2)
( 1 2, , 1 2 1 2)
A B× = a×a b×b c×c (3)
( 1 2, , 1 2 1 2)
A B− = a −c b−b c −a (4)
( 1 2, , 1 2 1 2)
A B÷ = a ÷c b ÷b c ÷a (5)
3.1.5. Fuzzy inference
The first fuzzy inference system was developed by Mamdani & Assilian (1975). The five main elements of a fuzzy inference system can be seen in Figure 2. Table 2 describes each element of the system.
Figure 2. Elements of a Fuzzy inference system.
Table 2. Components of a fuzzy inference system.
Data base Information base on which are defined: number of input variables and their type; values assigned to the linguistic terms; fuzzy operators; mapping of linguistic variables in fuzzy sets.
Fuzzification The input crisp variables are converted into fuzzy variables.
Rules base Assignments of rules which have an if-then structure (if-then). It aims to describe specifications of the problem addressed.
Inference Structure Structure which develops a relationship between the resulting set of operations and the consequent of the rule.
The fuzzy inference system converts the inputs into fuzzy variables, which in turn are inserted into the inference engine. The inference engine evaluates the fuzzy variables based on the rule base set defined by the decision maker. These rules have “AND” connectors, which aim to represent the relationship between the linguistic terms of the input variables. The following operators can be used to represent the “AND” intersection operation: “minimum (min)” and “algebraic product”, represented by Equations 6 and 7 respectively (Pedrycz & Gomide, 2007).
( ) ( )
(
)
, A B
Min µ x µ y (6)
( ) . ( )
A B
µ x µ y (7)
Each decision rule activated generates an implication relationship. Then, the degree of membership of the elements of the input set and the output set are related using an implication operator. The implication operator “product” is represented by Equation 8. Examples of implication operators are “max-min” and “min”, presented by Equations 8 and 6 respectively (Pedrycz & Gomide, 2007).
( ) ( )
(
)
(
)
A , B
Max Min µ x µ y (8)
After applying the implication operator, the output of each rule is obtained, which is given by a composition between a singleton set and the implication relation. This composition may be done, for example, by “max-min” operator presented by Equation 9.
( ) ( )
(
)
(
)
A , , B ,
Max Min µ x y µ y z (9)
Then, the resulting outputs of rules µIi(x) are aggregated in a single fuzzy set by an aggregation operator. Thus, the aggregation operator “maximum (max)” presented by Equation 10 can be adopted (Kahraman, 2008).
( ) ( ) ( )
(
1 2)
I , I In
Max µ x µ x…µ x (10)
The inference system ends at a defuzzification interface, in which an operator takes the values of one or more fuzzy output variables into crisp values. Various operators can be used to perform defuzzification, such as Center of Area (CoA), which takes into account all membership values for calculating the output value (Zimmermann, 2001). The result of the inference fuzzy is a set of infinite points that compose a solution region that represent a linguistic variable. Center of Area (CoA) method was chosen because of its ability to consider all membership values in a given region, assuming a centralized position. Defuzzification method can also be changed in order to reach the best representation of decision maker’s opinions, for example, the Mean of Maximum (MOM) most represents an optimistic view, and the First of Maximum (FOM) most represents a pessimist view. (Zimmermann, 1996). The method of Center of Area (CoA) is shown by Equation 11.
( ) ( ) 1
1
n
A K K
k n
A K
k
X X
CoA
X
µ µ
=
=
=
∑
∑
(11)4. Methodology
and Operations Planning” OR “S&OP” AND “Evaluation”, because it is intended to identify relevant research carried out on S&OP maturity evaluation. The first string returned 8 articles in the Scopus and 34 articles in Web of Science. The second string returned 1 paper in Scopus and 34 papers in Web of Science. After applying filters, it was identified 10 maturity models that were incorporated in the literature review on S&OP process maturity models available on section 2 of this paper.
The quality appraisal of literature review was possible through considering papers contained in considering International Journals on Operations Management. Inclusion and exclusion criteria were in general, the same criterion proposed by Thomé et al. (2012a). Inclusion criteria were: international papers, books and book chapters about S&OP. Only papers that presented S&OP maturity models were included in the literature review, since it is the focus of this research, characterizing it as an inclusion criterion. Exclusion criteria were: papers in other languages (other than English), theoretical and empirical papers on S&OP that had no maturity models, and duplicate articles.
The first literature review was conducted by only one reviewer. Next, upon completion of initial filtering, other participating researchers assessed and reviewed the literature ensuring relevance to the topic. In this review performed by the other three researchers, no disagreement was found. The other authors added more relevant papers, and suggestions from anonymous reviewers were included as the paper passed through the reviews.
The approach of this research has a qualitative-quantitative character, since the combination of the advantages of each approach promotes greater robustness for this research. The combination of multiple observers, theories, methods and data sources can help overcome the intrinsic bias of isolated methods (Denzin, 1978; Rocco et al., 2003). This research is qualitative, as it uses the multi-case study method to investigate S&OP process, mainly regarding its maturity; and it is quantitative because it applies mathematical modeling based on fuzzy logic to evaluate the level of maturity of S&OP process in companies researched.
Regarding the organizations’ selection, the companies’ requirements were organizations that had already implemented S&OP process and gained positive results. This allowed analyzation of the S&OP maturity level. In addition, large size companies were chosen due to their greater complexity (Massey & Dawes, 2007), thus S&OP maturity gaining would be even more challenging and its analyses could give richer results. Thus, two organizations were included in this research, as they met the necessary requirements, namely: Company X: this is a Brazilian company, working in agricultural machinery sector and Company Y, a German company, a writing materials manufacturer.
Decision makers of the organizations presented were interviewed in order to define linguistic terms and inference rules. The gathering of decision-makers view on S&OP maturity was carried out through a case study research that was conducted with the presence of the interviewee. Main topics covered are available at Appendix A. Data collection was performed with the support of a semi-structured questionnaire that included questions about the maturity process and covered general aspects of S&OP as well. In addition, observations were made, and documentation of the process was accessed. The choice of respondents was based on their proximity to S&OP process, and these respondents were quite familiar with the process (being the sponsor of the process), Sales Manager was interviewed in company X; and S&OP Manager was interviewed in company Y. The point of view of each of the interviewees was a valuable source to the rules base building process that was performed by the interviewer. This way, information given by the interviewees was used to build the rules base utilized in fuzzy inference process.
5. Proposal of a model for performance evaluation of sales and operations planning
process
Steps taken to develop the S&OP maturity evaluation model consist of the following procedures:
• Step 1 - Criteria and sub-criteria formulation: criteria are based on studies about enablers for a successful S&OP implementation that were identified through empirical evidences based on Pedroso et al. (2016). S&OP enablers (treated here as sub-criteria) are then aggregated into five major categories (representing criteria used) according to their nature.
In total, 21 enablers required for successful S&OP implementation related to metrics, information technology, integrated planning, people/organizational culture and organization of the process were detected through literature review and empirical evidences, covering the following studies: (Wing & Perry, 2001; Lapide, 2004; 2005b; Wallace, 2004; Muzumdar & Fontanella, 2006; Dougherty & Gray, 2006; Sheldon, 2006; Grimson & Pyke, 2007; Boyer, 2009; Cecere et al., 2009; Voluntary Interindustry Commerce Solutions, 2010; Tuomikangas & Kaipia, 2014; Wagner et al., 2014; Pedroso et al., 2016). Table 3 shows this enablers grouped into evaluation criteria and dimensions according their similarities. The grouping of enablers was performed in order to reflect decisions made in similar scopes. The development of dimensions considered aims to promote a holistic view of the process in order to integrate different views of S&OP process.
Table 3. Criteria and subcriteria for S&OP maturity evaluation.
Dimension Criteria Subcriteria
Tools Metrics Metrics and performance evaluation
Technology Information systems
Information flow management
Processes Integrated planning Demand and supply planning Cross-functional integration Integrated planning Forecast accuracy
Consideration of external environment Consolidated company strategy Formal structure
People /Organizational culture Enabled participants to make decisions Training/ Process understanding Ability to manage change Attendance at meetings
Organizational structure made for changes Top management support
Organization of the process Process coordination
Delegating responsibilities and initial information Preparation for meetings
Structured schedule Documentation
Enablers found (subcriteria), divided into five elements (criteria), were aggregated again. This new aggregation intended to enable categorization. Thus, identified criteria were divided in two main dimensions: tools and processes. This division was performed according to the nature of criteria, then, criteria that presented technical character, such as “metrics” and “information technology” were rated in the dimension “tool”. Criteria that have management features (such as integrated planning, people /organizational culture and organization of the process) were allocated in the dimension “processes.”
The model includes dimensions that are not considered in other frameworks available in literature, such as cultural and organizational issues.
• Step 3 - Categorization: This refers to the result of fuzzy inference system of both dimensions. The application of two fuzzy systems was necessary, being one of them to categorize the maturity level of “tools” dimension. The second system aims to categorize the maturity level of “processes”. The linguistic terms chosen were: very low (VL), low (L), medium (M), high (H) and very high (VH). After obtaining the results of fuzzy inference systems, there was a combination of both systems, in order to fit them into different segments according to the achieved performance. The implementation of this last fuzzy system has the intention to categorize the potential achieved by the organization in its evolutionary process of S&OP as very low (VL), low (L), medium (M), high (H) and very high (VH).
• Rules consequents were defined by experts;
• The product operator is used as a logical connector “AND”;
• The implication relation is carried out by Mamdani method;
• Max-Min is the composition operator used;
• Aggregation is performed by maximum operator;
• Deffuzication is conducted by Center of Area (CoA).
• Step 4 - Evaluation of categorization results: From the fuzzification result, the fuzzy inference system returned a crisp value that was transformed into a fuzzy performance class. Each fuzzy performance class will involve different strategies to leverage S&OP process maturity.
• Step 5 - Strategies to advance maturity: According to the performance achieved by the companies, different strategies to develop the maturity level are proposed.
Figure 3 contains the illustration of the model proposed in this research.
Figure 3. Model to S&OP maturity evaluation.
5.1. Brief discussion about main results
In general, S&OP maturity models bring similar metrics in order to evaluate the process maturity, but at the same time there is not general agreement about which metrics should be used to evaluate S&OP process properly. This way, this research have made an attempt to synthesize important S&OP elements, also known as success factors, to gather S&OP key aspects in one maturity model. The most used metric is “integrated planning” cited by Ventana Research (2006), Grimson & Pyke (2007), Feng et al. (2008), Cecere et al. (2009) and Wagner et al. (2014). This can be a good indicator that this may be a key issue in evolving in S&OP process. This way, this metric was also incorporated in this research as a criteria. Another issue that needs to be addressed is the metrics incorporation that have gained few or limited attention, but that might be important elements to S&OP evolution.
One point that needs to be highlighted is that maturity gaining is not necessarily attached to how many times the S&OP process has been implemented, but rather it is related to the efforts made and to the willingness of people to make process work and succeed. This finding is based on the high maturity gaining of company Y that has implemented S&OP more recently when compared with company X. This point has not been discussed in literature yet, and deserves more academic attention. This finding can also bring the discussion of people’s role in the S&OP process, since it is the human element that seems to be bringing more advanced maturity gain (Lapide, 2005a; 2007; McCormack & Lockamy, 2005; Wagner et al., 2014; Hulthén et al., 2016). McCormack & Lockamy (2005) highlighted that informal mechanisms such as cross-functional collaboration are essential to S&OP effectiveness.
current maturity level, for being a visual model. In addition, it helps to identify gaps in S&OP process more intuitively. Another novelty of this paper, is the use of linguistic classes of maturity levels and fuzzy numbers representing them. As human thinking and judgments aren’t linear, but rather subjective and imprecise, fuzzy set theory was a suitable technique to deal with the problem of S&OP maturity evaluation. Also, fuzzy inference presents a simple fuzzy grid method to support S&OP maturity evaluation. This way, this research aims to support managers to take more structured decisions related to S&OP implementation and maturity gaining, guiding decision makers through providing a tool to measure S&OP current status, and enabling to detect which factor need to be improved in order to get a better process.
5.2. Application
The proposed method was applied in two organizations that already had the S&OP process implemented and had presented expected results, enabling the analysis of the company’s level of maturity and the understanding of the process maturing dynamics. Large size companies are also part of the selection requirements of organizations participants of this research. Thus, two organizations were included in this research, as they met the necessary requirements, namely: Company X, a Brazilian company, working in agricultural machinery sector that implemented S&OP in 2010, and Company Y, a German company, manufacturing writing materials that implemented the process in 2012.
Decision makers of the organizations presented were interviewed in order to define linguistic terms and inference rules. The gathering of decision-makers’ views on S&OP maturity was carried out through a case study research that was conducted with the presence of the interviewee. Data collection was performed with the support of a semi-structured questionnaire that included questions about the maturity process and also covered general aspects of S&OP. In addition, observations were made, and documentation of the process was accessed. The choice of respondents was based on their proximity to the S&OP process, and these respondents were quite familiar with the process (being the sponsor of the process). The Sales Manager was interviewed in company X, and S&OP Manager was interviewed in company Y.
5.2.1. Definition of linguistic terms and rule base
The universe of discourse of the input variables (criteria) and the output variables (dimensions) are on a scale of 0 to 10. The linguistic terms referring to maturity stages described in the literature, and triangular fuzzy numbers related to each of the linguistic terms are available in Table 4. The fuzzy system corresponding to input and output variables is represented by Figure 4.
Table 4. Linguistic terms corresponding to maturity levels and the Triangular Fuzzy related to linguistic terms.
Maturity Level Linguistic Terms Triangular Fuzzy Numbers
Stage 1 Very Low (VL) (0, 0, 2.50)
Stage 2 Low (L) (0, 2.50, 5.00)
Stage 3 Medium (M) (2.50, 7.50, 10.0)
Stage 4 High (H) (5.00, 7.50, 10.0)
Stage 5 Very High (VH) (7.50, 10.0, 10.0)
Rules bases of each inference system were defined based on interviews conducted with decision makers of the two organizations in which this research was conducted. The rules bases relating to tools and to processes are available in Tables 5 and 6. The use of two fuzzy systems was necessary to construct the categorization matrix. Thus, it was applied a fuzzy inference system for each of the proposed dimensions (tools and processes) for each organization. The resulting performance yielded by each inference system was combined to classify the S&OP maturity level into the categorization matrix showed in Figure 4.
Table 5. Rule base of the fuzzy inference 1 (Tools).
Company IF
Metrics (c1)
AND Technology (c2)
THEN Performance
X M L M
Y H H H
Table 6. Rule base of the fuzzy inference 2 (Processes).
Company IF
Integrated planning (c3)
AND
People /Organizational culture (c4)
AND
Organization of the process (c5)
THEN Performance
X M M H M
Y H VH H VH
According to results of S&OP maturity level, different strategies are suggested to improve the S&OP performance:
• Group I - Companies falling into this category are in a danger zone, with extremely low levels of maturity. Even in initial stages of S&OP, companies do not have adequate tools to support the process implementation. Information systems do not match the company’s needs for running S&OP and information flow is loose. There are no metrics used to monitor the process. Concerning “processes”, plans are not well integrated, silos culture is strong, people are reluctant to change their mindset, and top management doesn’t make efforts to sponsor the process. Also, there are no pre-scheduled meetings, and no previous preparation for meetings exists. Strategies to leverage the maturity level include actions in both dimensions (tools and processes), as both dimensions have low scores;
• Group II - Companies classified in this group have low performance in “tools” dimension and high performance in “processes” dimension. These companies have reached good results in ensuring that plans are integrated, organizational culture and people are open to changes, and the organization of the process is well executed, but tools are still being used as primary stages. Then, companies should adjust their technology tools and metrics in order to progress in S&OP maturity. As Gilmore (2005) states, in early stages it is not required to use advanced information technology, and basic spreadsheets and tools are sufficient. As the process progresses, the need for more elaborate software is emphasized, taking into consideration that the process involves quality information from various functional areas, which needs to be integrated, and the plans need to be combined in order to understand the consequences of the possible scenarios and trade-offs, increasing the complexity of the required systems. Thus, companies should ensure that enablers related to tools are present to support S&OP process;
• Group III - This category represents organizations with high performance in “tools” dimension and low performance in “processes” dimension. Thus, enablers for “processes” should be incorporated in the S&OP process. This scenario is rare, as there is a tendency for maturity gains to occur first in “processes”, and then tools are adjusted to follow the evolution of the process. It is important to note that “processes” have a higher level of collaboration to S&OP maturity acquisition, and “tools” have a secondary role. Because of this, companies in Group III are more susceptible to falling in a danger zone than Group II;
5.3. Application results
Table 7 presents the input values of each company evaluated. From the performance obtained, a categorization matrix was built, aiming to categorize companies in four different groups and to recommend actions to raise the maturity level. Results obtained from the fuzzy inference process are shown in Table 7.
Table 7. Implementation results.
Company Tools Performance Processes Performance Group
X 6.90 High 6.25 Medium III
Y 7.56 High 9.10 Very High IV
Companies were classified in the following categories, according to their performance:
• Company X - Group B III. This company has average performance in “processes” dimension and high performance in “tools” dimension. Even though the company has a high performance in this last dimension, it is critical that the company seeks to improve “processes” dimension, as enablers related to “processes” are the core of S&OP, and “tools” have a supporting role. This means that efforts to guarantee enablers related to “integrated planning”, “organizational culture” and “organization of the process” in S&OP should be pursued;
• Company Y - Group IV. This organization has demonstrated best performance, as it achieved very high performance in “processes” dimension and high performance in “tools” dimension. Company Y is a good example of a successful organization in S&OP implementation, so enablers present in this company should be studied further in order to discover which elements are providing greater process maturity. Therefore, only actions in terms of close monitoring are necessary.
From the results it can be seen that improvements must be made, especially in company X. For the purpose of overcoming low maturity levels, companies should examine more closely, through a critical evaluation of the S&OP process, which enablers (sub criteria) are absent in each dimension analyzed. After identifying the missing S&OP enablers, companies should-implement them with fidelity and observe how this implementation affects their process maturity.
6. Conclusions
Through this study, it was possible to analyze the S&OP maturity level and to identify which S&OP enablers should be prioritized in order to leverage the process maturity gaining. A fuzzy theory based model was proposed to assess and to categorize different S&OP maturity levels and to propose strategies to increase S&OP maturity. Thus, an application of the model was conducted in two manufacturing organizations that already had the S&OP process implemented. The model presented has the advantage to analyze in detail the maturity level reached and to identify which actions should be taken to increase the maturity level. Proposed actions are related to the incorporation of enablers that are essential for S&OP implementation be successful and mature.
The advantages of the approach presented in this paper are threefold. First, it employs a quantitative model based on fuzzy theory that enables quantifying qualitative, imprecise, and vague information. This is a valuable means of analyzing the process evolution, as decision-makers’ opinions can be captured more accurately. Second, this study presents a real life application in order to illustrate how this approach can be applied in different scenarios. Empirical applications are limited in S&OP literature, in general (McCormack & Lockamy, 2005; Thomé et al., 2012a, b; 2014; Tuomikangas & Kaipia, 2014; Ivert et al., 2015a, b; Swaim et al., 2016) and even scarcer considering maturity models, with few studies existing on the subject (Hulthén et al., 2016). Third, the utilization of S&OP enablers to measure the process maturity make it easier to visualize gaps in the process and to discover which actions (in terms of S&OP enablers) should be taken. This can help companies identify their current status, discover gaps in the process, and prioritize strategies for overcoming weaknesses. In addition, categorization involved in this approach allows an easier and more visual understanding of the current S&OP maturity level and the poor areas that need improvements.
information. In addition, “cultural” element is again highlighted as it was in other previous studies (Lapide, 2005a; 2007; McCormack & Lockamy, 2005; Wagner et al., 2014; Hulthén et al., 2016), but from now it is formally incorporated in the proposed maturity model. With regard to practical contributions, this research has the intention to assist companies with S&OP process implementation, providing insights through an orientation that enables organizations to discover the actual level of S&OP maturity. One of the main contributions of this research is to make-clear which enablers should be prioritized based on the S&OP maturity level reached. In general, companies struggle to identify their actual S&OP maturity level, and it is not clear which actions companies should take to leverage the process maturity. Thus, organizations can investigate gaps that make it difficult to gain maturity in the S&OP process and implement actions in terms of ensuring enablers will close these gaps and increase process maturity.
This study does not aim to promote generalization of results but to provide insights to companies that have implemented the S&OP process and want to progress in its implementation. One limitation of this study is the fact that only one interviewee’s opinion was captured in the pilot application. As it is known, S&OP is a cross-functional process that requires participation of a wide range of functional areas (Lapide, 2007; Goh & Eldridge, 2015). For future research it is suggested to carry out a study that considers group decision-making to S&OP related problems, in order to solve conflicts of divergent opinions of decision makers. Another research suggestion would be to conduct a cross-industry investigation in order to analyze whether there are significant discrepancies regarding the process maturity between different economic sectors. Studies of metrics in the S&OP context are also needed.
References
Abdullah, S., Aslam, M., Khan, T. A., & Naeem, M. (2013). A new type of fuzzy normal subgroups and fuzzy cosets. Journal of Intelligent
& Fuzzy Systems, 25(1), 37-47.
Affonso, R., Marcotte, F., & Grabot, B. (2008). Sales and operations planning: the supply chain pillar. Production Planning and Control, 19(2), 132-141. http://dx.doi.org/10.1080/09537280801896144.
Alvekrans, A. L., Lantz, B., Rosén, P., Siljemyr, L., & Snygg, J. (2016). From knowledge to decision: a case study of sales and operations planning in health care. Production Planning and Control, 27(12), 1019-1026. http://dx.doi.org/10.1080/09537287.2016.1174892. Association for Operations Management. (2009). Sales and operations planning: the secret to world class supply chain. Retrieved in
2017, March 29, from http:/www.apics-fraservalley.org/
Bellman, R. E., & Zadeh, L. A. (1970). Decision making in a fuzzy environment. Management Science, 17(4), 141-164. http://dx.doi. org/10.1287/mnsc.17.4.B141.
Bower, P. (2005). Twelve most common threats to sales and operations planning process. Journal of Business Forecasting, 24(3), 4-14. Boyer, J. E. (2009). Ten proven steps to successful S&OP. Journal of Business Forecasting, 28(1), 4-10.
Calfa, B. A., Agarwal, A., Bury, S. J., Wassick, J. M., & Grossmann, I. E. (2015). Data-driven simulation and optimization approaches to incorporate production variability in sales and operations planning. Industrial & Engineering Chemistry Research, 54(29), 7261-7272. http://dx.doi.org/10.1021/acs.iecr.5b01273.
Cecere, L., Barrett, J., & Mooraj, H. (2009). Sales and operations planning: transformation from tradition. industry value chain strategies. Boston: AMR Research.
Chen Ritzo, C. H., Ervolina, T., Harrison, T. P., & Gupta, B. (2010). Sales and operations planning in systems with order configuration uncertainty. European Journal of Operational Research, 205(3), 604-614. http://dx.doi.org/10.1016/j.ejor.2010.01.029.
Chen, Z., & Sarker, B. R. (2015). Aggregate production planning with learning effect and uncertain demand. Journal of Modelling in Management, 10(3), 296-324. http://dx.doi.org/10.1108/JM2-12-2012-0044.
Crosby, P. B. (1979). Quality is free: the art of making quality certain. New York: McGraw-Hill Companies.
Denyer, D., & Tranfield, D. (2009). Producing a systematic review. In D. A. Buchanan & A. Bryman (Eds.), The sage handbook of organizational research methods. London: Sage Publications.
Denzin, N. K. (1978). Sociological methods: a sourcebook. New York: McGraw-Hill Companies.
Dougherty, J., & Gray, C. (2006). Sales & operations planning: best practices, partners for excellence. Belmont: Trafford Publishing. Feng, Y., D’Amours, S., & Beauregard, R. (2010). Simulation and performance evaluation of partially and fully integrated sales and
operations planning. International Journal of Production Research, 48(19), 5859-5883. http://dx.doi.org/10.1080/00207540903232789. Feng, Y., D’Amours, Y. S., & Beauregard, R. (2008). The value of sales and operations planning in oriented strand board industry with make-to-order manufacturing system: cross functional integration under deterministic demand and spot market recourse. International Journal of Production Economics, 115(1), 189-209. http://dx.doi.org/10.1016/j.ijpe.2008.06.002.
Fraser, P., Moultrie, J., & Gregory, M. (2002). The use of maturity models/grids as a tool in assessing product development capability. In Proceedings of the 2002 IEEE International Engineering Management Conference (Vol. 1, pp. 244-249). USA: IEEE International. http://dx.doi.org/10.1109/IEMC.2002.1038431.
Gilmore, D. (2005). Integrated supply chain require effective sales and operations planning. Retrieved in 2017, May 05, from www. scdigest.com/accessed
Grimson, J. A., & Pyke, D. F. (2007). Sales and operations planning: an exploratory study and framework. International Journal of Logistics Management, 18(3), 322-346. http://dx.doi.org/10.1108/09574090710835093.
Hahn, G. J., & Kuhn, H. (2012). Value-based performance and risk management in supply chains: a robust optimization approach. International Journal of Production Economics, 139(1), 135-144. http://dx.doi.org/10.1016/j.ijpe.2011.04.002.
Herrera, F., & Martínez, L. (2001). A model based on linguistic 2-tuples for dealing with multigranular hierarchical linguistic contexts in multi-expert decision-making. IEEE Transactions on Systems, Man, and Cybernetics. Part B, Cybernetics, 31(2), 227-234. PMid:18244784. http://dx.doi.org/10.1109/3477.915345.
Hulthén, H., Näslund, D., & Norrman, A. (2016). Framework for measuring performance of the sales and operations planning process. International Journal of Physical Distribution & Logistics Management, 46(9), 809-835. http://dx.doi.org/10.1108/IJPDLM-05-2016-0139. Ivert, L. K., & Jonsson, P. (2010). The potential benefits of advanced planning and scheduling systems in sales and operations planning.
Industrial Management & Data Systems, 110(5), 659-681. http://dx.doi.org/10.1108/02635571011044713.
Ivert, L. K., Dukovska-Popovska, I., Fredriksson, A., Dreyer, H. C., & Kaipia, R. (2015a). Contingency between S&OP design and planning environment. International Journal of Physical Distribution & Logistics Management, 45(8), 747-773. http://dx.doi.org/10.1108/ IJPDLM-04-2014-0088.
Ivert, L. K., Dukovska-Popovska, I., Kaipia, R., Fredriksson, A., Dreyer, H. C., Johansson, M. I., Chabada, L., Damgaard, C. M., & Tuomikangas, N. (2015b). Sales and operations planning: responding to the needs of industrial food producers. Production Planning and Control, 26(4), 280-295.
Kahraman, C. (2008). Fuzzy multicriteria decision making: theory and applications with recent developments. Turkey: Springer Science. Lapide, L. (2004). Sales and operations planning part I: the process. The Journal of Business Forecasting, 23(3), 17-19.
Lapide, L. (2005a). An S&OP maturity model. The Journal of Business Forecasting, 24(3), 15-19.
Lapide, L. (2005b). Sales and operations planning Part III: a diagnostic model. The Journal of Business Forecasting, 24(1), 13-16. Lapide, L. (2006). Top-down & bottom-up forecasting in S&OP. The Journal of Business Forecasting, 25(2), 14-16.
Lapide, L. (2007). S&OP Psych 101. Cambridge. Supply Chain Management Review.
Lapide, L. (2011). S&OP: the linchpin planning process. The Journal of Business Forecasting, 30(3), 4-5.
Lim, L. L., Alpan, G., & Penz, B. (2014). A simulation-optimization approach for managing the sales and operations planning in the automotive industry. Les Cahiers Leibniz, 212, 1-26.
Lima Junior, F. R., & Carpinetti, L. C. R. (2013). Multicriteria decision methods for supplier selection: a literature review on the state of the art. Gestão & Produção, 20(4), 781-801. http://dx.doi.org/10.1590/S0104-530X2013005000005.
Lima Junior, F. R., Osiro, L., & Carpinetti, L. C. R. (2013). A fuzzy inference and categorization approach for supplier selection using compensatory and non-compensatory decision rules. Applied Soft Computing, 13(10), 4133-4147. http://dx.doi.org/10.1016/j. asoc.2013.06.020.
Lima Junior, F. R., Osiro, L., & Carpinetti, L. C. R. (2014). A comparison between Fuzzy AHP and Fuzzy TOPSIS methods to supplier selection. Applied Soft Computing, 21, 194-209. http://dx.doi.org/10.1016/j.asoc.2014.03.014.
Mamdani, E. H., & Assilian, S. (1975). An experiment in linguistic synthesis with a fuzzy logic controller. International Journal of Man-Machine Studies, 7(1), 1-13. http://dx.doi.org/10.1016/S0020-7373(75)80002-2.
Massey, G. R., & Dawes, P. L. (2007). The antecedents and consequence of functional and dysfunctional conflict between marketing managers and sales managers. Industrial Marketing Management, 36(8), 1118-1129. http://dx.doi.org/10.1016/j.indmarman.2006.05.017. McCormack, K., & Lockamy, A. (2005). The impact of horizontal mechanisms within sales and operations planning processes on supply chain integration and performance: a statistical study. In Proceedings of the 4th Global Conference on Business and Economics. Oxford. Mendes Junior, P., Leal, J. E., & Thomé, A. M. T. (2016). A maturity model for demand-driven supply chains in the consumer product
goods industry. International Journal of Production Economics, 179, 153-165. http://dx.doi.org/10.1016/j.ijpe.2016.06.004. Mendoza, J. D., Mula, J., & Campuzano-Bolarin, F. (2014). Using systems dynamics to evaluate the tradeoff among supply chain
aggregate production planning policies. International Journal of Operations & Production Management, 34(8), 1055-1079. http:// dx.doi.org/10.1108/IJOPM-06-2012-0238.
Moon, M. A. (2006). Breaking down barriers to forecast process improvement. The International Journal of Applied Forecasting, 4, 26-30. Muzumdar, M., & Fontanella, J. (2006). The secrets to S&OP success. Supply Chain Management Review, 10(3), 34-41.
Noroozi, S., & Wikner, J. (2017). Sales and operations planning in the process industry: a literature review. International Journal of Production Economics, 188, 139-155. http://dx.doi.org/10.1016/j.ijpe.2017.03.006.
Olhager, J., & Rudberg, M. (2002). Linking manufacturing strategy decisions on process choice with manufacturing planning and control systems. International Journal of Production Research, 40(10), 2335-2351. http://dx.doi.org/10.1080/00207540210131842. Osiro, L., Lima-Junior, F. R., & Carpinetti, L. C. R. (2014). A fuzzy logic approach to supplier evaluation for development. International
Journal of Production Economics, 153, 95-112. http://dx.doi.org/10.1016/j.ijpe.2014.02.009.
Paulk, M. (1993). Capability maturity model for software: encyclopedia of software engineering. Pittsburgh: Software Engineering Institute, Carnegie Mellon University. Technical Report.
Pedroso, C. B., Silva, A. L., & Tate, W. L. (2016). Sales and Operations Planning (S&OP): insights from a multi-case study of Brazilian organizations. International Journal of Production Economics, 182, 213-229. http://dx.doi.org/10.1016/j.ijpe.2016.08.035. Pedrycz, W., & Gomide, F. (2007). Fuzzy systems engineering: toward human-centric computing. New Jersey: Wiley. http://dx.doi.
org/10.1002/9780470168967.
Rabbani, M., Manavizadeh, N., & Hosseini Aghozi, N. S. (2015). Robust optimization approach to production system with failure in rework and breakdown under uncertainty: evolutionary methods. Assembly Automation, 35(1), 81-93. http://dx.doi.org/10.1108/ AA-05-2014-038.
Rocco, T. S., Bliss, L. A., Gallagher, S., & Pérez-Prado, A. (2003). Taking the next step: mixed methods research in organizational systems. Information Technology, Learning and Performance Journal, 21(1), 19.
Rowley, J., & Slack, F. (2004). Conducting a literature review. Management Research News, 27(6), 31-39. http://dx.doi. org/10.1108/01409170410784185.
Santos, A. V. N., Felix, L. B., & Vieira, J. G. V. (2012). Estudo da logística de distribuição física de um laticínio utilizando lógica fuzzy. Revista Produção, 22(3), 576-583. http://dx.doi.org/10.1590/S0103-65132012005000036.
Sheldon, D. H. (2006). World class sales & operations planning: a guide to successful implementation and robust execution. Fort Lauderdale: J. Ross Publishing.
Swaim, J. A., Maloni, M., Bower, P., & Mello, J. (2016). Antecedents to effective sales and operations planning. Industrial Management
& Data Systems, 116(6), 1279-1294. http://dx.doi.org/10.1108/IMDS-11-2015-0461.
Taşkın, Z. C., Ağralı, S., Ünal, A. T., Belada, V., & Gökten-Yılmaz, F. (2015). Mathematical programming-based sales and operations
planning at vestel Electronics. Interfaces, 45(4), 325-340. http://dx.doi.org/10.1287/inte.2015.0793.
Thomas, P., Thomas, A., & Suhner, M. C. (2011). A neural network for the reduction of a Product Driven System emulation model. Production Planning and Control, 22(8), 767-781. http://dx.doi.org/10.1080/09537287.2010.543560.
Thomé, A. M. T., Scavarda, L. F., Fernadez, N., & Scavarda, A. J. (2012a). Sales and operations planning: a research synthesis. International Journal of Production Economics, 138(1), 1-13. http://dx.doi.org/10.1016/j.ijpe.2011.11.027.
Thomé, A. M. T., Fernadez, N., & Scavarda, A. J. (2012b). Sales and operations planning and the firm performance. International Journal of Productivity and Performance Management, 61(4), 359-381. http://dx.doi.org/10.1108/17410401211212643.
Thomé, A. M. T., Sousa, R. S., & Carmo, L. F. R. R. S. (2014). Complexity as contingency in sales and operations planning. Industrial Management & Data Systems, 114(5), 678-695. http://dx.doi.org/10.1108/IMDS-10-2013-0448.
Tranfield, D., Denyer, D., & Smart, P. (2003). Towards a methodology for developing evidenceinformed management knowledge by means of systematic review. British Journal of Management, 14(3), 207-222. http://dx.doi.org/10.1111/1467-8551.00375. Tranfield, D., Denyer, D., Marcos, J., & Burr, M. (2004). Co-producing management knowledge. Management Decision, 42(3-4),
375-386. http://dx.doi.org/10.1108/00251740410518895.
Tuomikangas, N., & Kaipia, R. A. (2014). Coordination framework for sales and operations planning (S&OP): Synthesis from the literature. International Journal of Production Economics, 154, 243-262. http://dx.doi.org/10.1016/j.ijpe.2014.04.026.
Ventana Research. (2006). Sales and operations planning: measuring maturity and opportunity for operational performance management. San Mateo: Ventana Research.
Viswanathan, N. (2009). Sales and operations planning solutions. Aberdeen: Aberdeen AXIS, Aberdeen Group.
Voluntary Interindustry Commerce Solutions. (2010). Linking CPFR and S&OP: a roadmap to integrated business planning. Retrieved in 2016, July 21, from http://vics.org
Wagner, S. M., Ullrich, K. K. R., & Transchel, S. (2014). The game plan for aligning the organization. Business Horizons, 57(2), 189-201. http://dx.doi.org/10.1016/j.bushor.2013.11.002.
Wallace, T. F. (2004). Sales and operations planning: the how-to handbook. Cincinnati: T. F. Wallace & Company.
Wang, J. Z., Hsieh, S. T., & Hsu, P. Y. (2012). Advanced sales and operations planning framework in a company supply chain. International Journal of Computer Integrated Manufacturing, 25(3), 248-262. http://dx.doi.org/10.1080/0951192X.2011.629683.
Wang, W. (2010). A fuzzy linguistic computing approach to supplier evaluation. Applied Mathematical Modelling, 34(10), 3130-3141. http://dx.doi.org/10.1016/j.apm.2010.02.002.
Wight, O. (2009). Sales and operations planning. Retrieved in 2016, July 02, from http://www.oliverwight-americas.com/our_approach/ sop/sales-operations-planning.htm/accessed
Wing, L., & Perry, G. (2001). Toward twenty first century pharmaceutical sales and operations planning. Pharmaceutical Technology, 25(11), 20-26.
Wochner, S., Grunow, M., Staeblein, T., & Stolletz, R. (2016). Planning for ramp-ups and new product introductions in the automotive industry: Extending sales and operations planning. International Journal of Production Economics, 182, 372-383. http://dx.doi. org/10.1016/j.ijpe.2016.07.008.
Zadeh, L. A. (1965). Fuzzy sets. Information and Control, 8(3), 338-353. http://dx.doi.org/10.1016/S0019-9958(65)90241-X. Zhao, S., Wang, L., & Zheng, Y. (2014). Integrating production planning and maintenance: an iterative method. Industrial Management
& Data Systems, 114(2), 162-182. http://dx.doi.org/10.1108/IMDS-07-2013-0314.
Zimmermann, H. J. (1996). Fuzzy control. In H. J. Zimmermann. Fuzzy set theory: and its applications. Netherlands: Springer. http:// dx.doi.org/10.1007/978-94-015-8702-0_11.
Zimmermann, H. J. (2001). Fuzzy set theory and its application. 4th ed. Boston: Kluwer Academic Publishers. http://dx.doi.org/10.1007/978-94-010-0646-0.
Appendix A. Topics covered during interview. • S&OP implementation process
• Benefits gained
• Enablers
• Performance evaluation
• Metrics used
• Current S&OP maturity situation in general terms
• S&OP maturity situation regarding to:
▪ Metrics ▪ Technology ▪ Integrated planning