Cop
yright
© ABE&M t
odos os dir
eit
os r
eser
vados
.
Metabolic syndrome in the
1982 Pelotas cohort: effect of
contemporary lifestyle and
socioeconomic status
Síndrome metabólica na coorte de 1982 da cidade de Pelotas: efeito do estilo de vida contemporâneo e situação socioeconômica
Vera Maria Freitas da Silveira1,2, Bernardo L. Horta1,
Denise P. Gigante1, Mario Renato Azevedo Junior1
absTRacT
Objectives: Describe the prevalence of metabolic syndrome, and its association with contem-porary lifestyle factors. Subjects and methods: In 2004-2005, 4,296 subjects of the 1982 Pelotas Birth Cohort were evaluated, and metabolic syndrome (MetS) was assessed in 3,599 according to the ATP III and IDF criteria. Results: Prevalence of MetS was 5.9% and 6.7% for NCEP-ATPIII and IDF, respectively. Smoking, alcohol intake, and physical activity were not associated with MetS. Among men, the body mass index (BMI) was associated with MetS – overweight [RR: 3.14 (95% CI, 1.97-5.00)] and obese subjects [RR: 17.41 (95% CI, 11.85-25.60)]. In women, family income and schooling were inversely associated with MetS, overweight increased the risk of MetS 7.73 (95% CI, 3.65-16.38) times and obesity 40.67 (95% CI, 20.85-79.33) times. Con-clusions: MetS was more prevalent among men according to NCEP-ATP III criteria, and obesity was the main risk factor. Arq Bras Endocrinol Metab. 2010;54(4):390-7
Keywords
Metabolic syndrome; risk factors; birth cohort
Resumo
Objetivos: Descrever a prevalência de síndrome metabólica e sua associação com estilo de vida contemporâneo. Sujeitos e métodos: Em 2004-2005, foram avaliados 4.296 participantes da Coorte de nascidos em 1982 de Pelotas, e a presença de síndrome metabólica (MetS) pelos critérios do NCEP-ATP III e da IDF foi pesquisada em 3.599 deles. Resultados: A prevalência de MetS foi de 5,9% e 6,7% pelo NCEP-ATP III e IDF, respectivamente. Fumo, ingesta de álcool e ati-vidade física não foram associados com a MetS. Entre os homens, o índice de massa corporal (IMC) foi associado com a MetS – sobrepeso [RR: 3,14 (IC 95 %, 1,97-5,00)], e obesos [RR: 17,41 (95% IC, 11,85-25,60)]. Entre as mulheres, a renda familiar e a escolaridade foram associadas inversamente com MetS; o sobrepeso aumentou o risco de MetS 7,73 vezes (IC 95%, 3,65-16,38) e a obesidade aumentou 40,67 vezes (IC 95%, 20,85-79,33). Conclusões: MetS foi mais preva-lente entre os homens pelo critério do NCEP-ATP III e a obesidade foi o principal fator de risco.
Arq Bras Endocrinol Metab. 2010;54(4):390-7
Descritores
Síndrome metabólica; fatores de risco; coortes de nascimento
1 Programa de Pós-graduação
em Epidemiologia, Universidade Federal de Pelotas (UFPel), Pelotas, RS, Brazil
2 Departamento de Clínica Médica,
UFPel, Pelotas, RS, Brazil
Correspondence to: Vera Maria Freitas da Silveira Rua Félix da Cunha, 614/303 96010-000 − Pelotas, RS, Brazil [email protected]
Received on Aug/13/2009 Accepted on Mar/1/2010
inTRoDucTion
T
he metabolic syndrome (MetS) is characterized by the presence of a set of cardiovascular risk factors related to resistance to insulin. Prevalence of MetSCop
yright
© ABE&M t
odos os dir
eit
os r
eser
vados
.
the increase in prevalence of obesity MetS began to be reported also among children and adolescents (2).
In Brazil, among 12 to 18-year-old girls from public schools in Niteroi, Rio de Janeiro State, the prevalence of MetS according to NCEP-ATPIII was 3.2% and in-creased to 21.4% (95% CI, 9.86-33.00) among obese subjects (3). In the Ribeirão Preto cohort which used the same criteria prevalence was of 10.7% among men and 4.8% among women aged 23-25 years (4).
The pathogenesis of metabolic syndrome is multi-factorial; insulin resistance and obesity are the major risk factors. Physical inactivity, advanced age, hormonal changes, and genetic alterations are known to exacerba-te prevalence, but the role of each of these factors may vary according to ethnicity (1).
Prevalence of MetS is higher among low socioeco-nomic status subjects (5-8) and this association is me-diated by differences in diet, physical activity, obesity, and smoking, in addition to the greater deposition of abdominal fat related to high emotional stress (7).
This study was aimed at assessing the prevalence of MetS according to NCEP-ATPIII (9) and IDF (10) crite-ria in the 1982 Pelotas birth cohort at age 22-23 years, and to evaluate its association with contemporary risk factors.
subJecTs anD meTHoDs
In 1982, all children born alive in hospitals in the city of Pelotas, Southern Brazil, and whose family lived in the urban area of the city were examined (n = 5,914), and mothers were interviewed on socioeconomic, de-mographic and health-related variables. Weight at birth was measured by the hospital staff using pediatric scales that were calibrated weekly. Gestational age was esti-mated from the maternal recall of their date of the last menstrual period. The subjects have been followed-up and examined on several occasions and the study me-thodology has been described elsewhere (11).
Between August 2004 and August 2005, a cen-sus was taken in the city in search of residents born in 1982. In addition to the census other tracing strategies were also employed (11). Following the interview, in-dividuals were invited to donate blood which was col-lected at an outpost set by the research team. Those subjects who did not show up were visited at home. At the time of collection, blood glucose was measured from ingertip blood using an Accu-Check Advantage (Roche) glucose meter which is accepted worldwide in community based diabetes screening (12,13).
Information on the time of the last meal and of blood collection were recorded so that the time elapsed since the last meal could be estimated. Blood samples (5 mL) were collected from each subject by venous puncture. Colorimetric enzymatic methods were used for determining triglycerides (TG); HDL-cholesterol was measured using an ultrasensitive direct method, both using a Selectra 2 analyzer (Merck).
In the 2004-2005 visits, weight was measured using a portable scale (Seca UNICEF) with 100 g precision. Weight of clothing was subtracted from the obtained va-lue based on a table of weights of clothing items. Height was assessed using a standardized aluminum anthropo-meter, with the subject’s head in the Frankfurt plan (14).
Abdominal circumference was measured with the subject standing, arms relaxed alongside the body, and the tape measure placed at the level of the natural waist, at the narrowest part of the trunk, between the lowest rib and the iliac crest, at the end of a normal expira-tion, and without compressing the skin. Measurements were taken using a thin inextensible measure tape, with 0.1 cm precision. Blood pressure was measured twice, at the beginning and at the end of the interview, using a digital wrist sphygmomanometer (Omron HEM 629). In the present analysis we used the mean value of these two measurements.
The following criteria were used to deine metabolic syndrome:
NCEP-ATP III (National Cholesterol Education Program (NCEP)-Adult Treatment Panel III), deined by the presence of at least three of the following fac-tors: abdominal circumference > 102 cm for men and > 88 cm for women; triglycerides ≥ 150 mg/dL; blood pressure ≥ 130/85 mmHg; HDL-cholesterol < 40 mg/ dL for men and < 50 mg/dL for women; fasting blood glucose ≥ 110 mg/dL (> 100 mg/dL may be used).
International Diabetes Federation (IDF): abdomi-nal circumference ≥ 94 cm for men and ≥ 80 cm for women, in addition to two of the following: triglyceri-des ≥ 150 mg/dL or under treatment; blood pressure ≥ 130/85 mmHg or under treatment; HDL-choleste-rol < 40 mg/dL for men or < 50 mg/dL for women or under treatment, fasting blood glucose ≥ 100 mg/dL, or glucose intolerance or diabetes (10).
The following risk factors were evaluated in 2004-2005:
Obesity: deined as body mass index ≥ 30 kg/m2.
Cop
yright
© ABE&M t
odos os dir
eit
os r
eser
vados
.
Current diet: based on the frequency of intake (dai-ly, weekly and monthly) of 70 food items. Block score was used for assessing the consumption of iber and fat (15). Low iber consumption was considered if the amount of iber in the diet was less than 20 g a day. Scores of 25 or higher were considered as high for fat. Carbohydrate (CH) intake, expressed as a percentage of total daily or annual kilocalories was another mea-sure of diet pattern. The percentage of total caloric in-take from CH was categorized as high (> 60%), middle (50%-60%), and low (< 50%).
Physical activity: leisure time physical activity was evaluated using the International Physical Activi-ty Questionnaire long version (16).Weekly scores of physical activity were estimated by the sum of time of walking and moderate physical activity plus time spent on vigorous activities multiplied by two. Those subjects whose scores were lower than 150 minutes of leisure time were classiied as sedentary (17).
Family income: the total income of the family mem-bers in the month before the interview (in minimum wages).
Achieved schooling: the highest school grade succes-sfully completed by the subject, divided into 4 catego-ries: < 4 years, 5 to 8 years, 9 to 11 years, and ≥ 12 years.
Smoking: those subjects who reported smoking every day in the last week were considered as smokers.
Alcohol consumption: reported as number of doses of alcoholic beverages a day.
Skin color: the subjects self-referred their skin color after hearing the options: white, black, mixed, Asian or indigenous. As the number of subjects was too small in the last two groups, they were mixed in the analysis.
Data analysis was carried out using Stata 9.0 software. In the bivariate analysis, the chi-squared test was used. Since the prevalence of some outcomes was higher than 10%, and in this situation the odds ratio overestimates the prevalence rate, we used the Poisson regression with robust adjustment of the variance in the multivariate analysis to estimate the prevalence ratio (18). Multivaria-te analysis was done according to a hierarchical model in which socioeconomic and demographic factors determi-ne diet and habits (alcohol intake, smoking, and physical activity) and those habits interfere with current BMI and in the outcome metabolic syndrome. Backward selection of the variables was used; variables with p ≤ 0.20 were maintained in the model. Fasting time was not associated with metabolic syndrome, and therefore estimates were not controlled for fasting time.
The study protocol was approved by the Federal University of Pelotas Research Ethics Committee; all subjects provided written consent for the interview and for blood collection and analysis.
ResuLTs
In 2004-2005, we interviewed 4,296 subjects (77.4% followed-up, including the 282 registered deaths). Of the interviewed subjects, 3,832 provided a blood sample (71% of the original cohort, and 91% of interviewed sub-jects). Compared to the original cohort, subjects in the extreme income groups were less likely to be traced (19). We excluded from the metabolic syndrome analysis 103 women who were pregnant at the time of the interview. Prevalence of metabolic syndrome was 5.9% (N = 213) according to NCEP-ATPIII and 6.7% (N = 240) according to IDF.
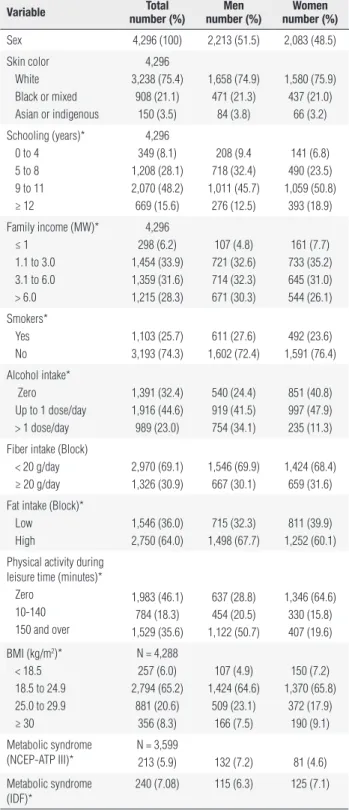
Table 1 shows the characteristics of the studied sam-ple, stratiied by sex. Approximately 75% of the subjects were white; 48% had between 9 and 11 years of scho-oling; about one-third of the families had incomes be-tween one and three minimum wages (MW), and other third between 3.1 and 6.0 MW. Prevalence of smoking was 26.0%; low iber intake was reported by 69% of subjects, while high fat intake was reported by 64%, the latter being greater among men. Consumption of more than one dose of alcohol per day was reported by 23% of the sample (11% of women and 34% of men). Sixty-four percent of the subjects were considered as sedenta-ry during leisure time. Prevalence of obesity was 8.3%, and of overweight, 21%.
Cop
yright
© ABE&M t
odos os dir
eit
os r
eser
vados
.
Table 1. Characteristics of the population of the 1982 Pelotas Birth Cohort, Brazil, at age 23
Variable number (%)Total number (%)men number (%)Women
Sex 4,296 (100) 2,213 (51.5) 2,083 (48.5)
Skin color White Black or mixed Asian or indigenous
4,296 3,238 (75.4)
908 (21.1) 150 (3.5)
1,658 (74.9) 471 (21.3)
84 (3.8)
1,580 (75.9) 437 (21.0)
66 (3.2)
Schooling (years)* 0 to 4 5 to 8 9 to 11 ≥ 12
4,296 349 (8.1) 1,208 (28.1) 2,070 (48.2) 669 (15.6)
208 (9.4 718 (32.4) 1,011 (45.7)
276 (12.5)
141 (6.8) 490 (23.5) 1,059 (50.8)
393 (18.9)
Family income (MW)* ≤ 1
1.1 to 3.0 3.1 to 6.0 > 6.0
4,296 298 (6.2) 1,454 (33.9) 1,359 (31.6) 1,215 (28.3)
107 (4.8) 721 (32.6) 714 (32.3) 671 (30.3)
161 (7.7) 733 (35.2) 645 (31.0) 544 (26.1)
Smokers* Yes No
1,103 (25.7) 3,193 (74.3)
611 (27.6) 1,602 (72.4)
492 (23.6) 1,591 (76.4)
Alcohol intake* Zero Up to 1 dose/day > 1 dose/day
1,391 (32.4) 1,916 (44.6) 989 (23.0)
540 (24.4) 919 (41.5) 754 (34.1)
851 (40.8) 997 (47.9) 235 (11.3)
Fiber intake (Block) < 20 g/day ≥ 20 g/day
2,970 (69.1) 1,326 (30.9)
1,546 (69.9) 667 (30.1)
1,424 (68.4) 659 (31.6)
Fat intake (Block)* Low
High
1,546 (36.0) 2,750 (64.0)
715 (32.3) 1,498 (67.7)
811 (39.9) 1,252 (60.1)
Physical activity during leisure time (minutes)*
Zero 10-140 150 and over
1,983 (46.1) 784 (18.3) 1,529 (35.6)
637 (28.8) 454 (20.5) 1,122 (50.7)
1,346 (64.6) 330 (15.8) 407 (19.6)
BMI (kg/m2)* < 18.5 18.5 to 24.9 25.0 to 29.9 ≥ 30
N = 4,288 257 (6.0) 2,794 (65.2)
881 (20.6) 356 (8.3)
107 (4.9) 1,424 (64.6)
509 (23.1) 166 (7.5)
150 (7.2) 1,370 (65.8)
372 (17.9) 190 (9.1)
Metabolic syndrome (NCEP-ATP III)*
N = 3,599
213 (5.9) 132 (7.2) 81 (4.6)
Metabolic syndrome (IDF)*
240 (7.08) 115 (6.3) 125 (7.1)
NCEP-ATP III-National Cholesterol Education Program III – IDF-International Diabetes Federation. * p < 0.05 MW: Monthly minimum wage.
Because there was interaction between income and sex (p = 0.002), the analyses were stratiied according to sex. Table 4 presents crude and adjusted prevalence ratio for MetS based on the NCEP-ATP III criteria, stratiied by sex. In the crude analysis, males had a PR of
MetS of 1.56 (95% CI, 1.19-2.05) according to NCEP-ATP III, and 0.88 (95% CI, 0.69-1.13) according to IDF. Among males, skin color, income, and schooling were not associated with MetS. Family income reached the signiicant threshold for being considered as a con-founder and was maintained in the model. None of the behavioral variables (smoking, alcohol intake, diet, and physical activity) was associated with MetS (p > 0.05), both in crude and adjusted analyses BMI was the only variable associated with MetS among men.
In women, family income and schooling were in-versely associated with prevalence of MetS. Smoking, iber, fat and alcohol intake, and physical activity were not signiicantly associated with MetS. In the last level, overweight showed a PR of 7.73 (p < 0.001) and obe-sity of 40.67 (p < 0.001) after adjustment for family income and schooling.
The model using MetS as an outcome, as deined by the IDF classiication, showed no appreciable diffe-rences (Table 5). Among women, higher income and schooling remained as a protective factor, and a higher iber intake was signiicantly associated with MetS.
Discussion
The high prevalence of cardiovascular risk factors among young adults is alarming, and similar results have been described in other studies (4,20,21). In the present study, using NCEP criteria, MetS was more prevalent among men. This is similar to what has been reported in other Latin-American studies with young adults (4,21,22).
signii-Cop
yright
© ABE&M t
odos os dir
eit
os r
eser
vados
.
Table 2. Distribution of prevalence of metabolic syndrome and its components defined based on NCEP-ATP III, according to sex, skin color, obesity, and socioeconomic indicators in the 1982 Pelotas cohort, at age 23
sex skin color family income (terciles) obesity
female male White nonwhite 1 2 3 yes no
Blood glucose 12.9 20.9* 16.6 18.0 18.4 15.8 16.7 24.4* 16.3
HDL-cholesterol 25.9* 13.0 19.2 19.7 27.4* 16.9 13.4 31.7* 18.2
Triglycerides 10.1 22.9* 18.3* 12.0 14.8 17.2 18.2 39.9* 14.6
Abdominal circumference 10.9* 4.2 6.7 9.4& 9.8* 7.7 4.7 67.7* 2.0
Systolic blood pressure 13.2 35.5* 24.1 27.8& 23.3 26.8 24.8 47.7* 23.0
Metabolic syndrome 4.6 7.2* 5.9 6.1 6.3 5.9 5.6 39.3* 2.9
* p ≤ 0.001; & p ≤ 0.05.
Table 3. Distribution of prevalence of metabolic syndrome and its components defined based on IDF, according to sex, skin color, obesity, and socioeconomic indicators in the 1982 Pelotas cohort, at age 23
sex skin color family income (terciles) obesity
female male White nonwhite 1 2 3 yes no
Blood glucose 30.1 43.2* 36.4 37.5 38.4 35.8 35.9 46.2* 35.8
HDL-cholesterol 25.9* 13.0 19.2 19.7 27.4* 16.9 13.4 31.7* 18.2
Triglycerides 10.1 22.9* 18.3* 12.0 14.8 17.2 18.2 39.9* 14.6
Abdominal circumference 24.5* 10.2 16.3 19.0& 19.7* 18.6 12.6 94.1* 10.1
Systolic blood pressure 13.2 35.5* 24.1 27.8& 23.3 26.8 24.8 47.7* 23.0
Metabolic syndrome 7.1 6.3 6.5 7.1 7.8& 6.9 5.3 51.7* 2.6
*p ≤ 0.001; & p ≤ 0.01.
cance of interaction was reduced (p = 0.11). Another possible explanation would be the higher parity found among women of lower socioeconomic level, since hi-gher parity has been associated with greater abdominal obesity (27).
Contemporary diet, smoking, alcohol use, and phy-sical activity were not associated with MetS, contrary to what has been reported in other studies (28-31), with the exception of higher risk in those women with higher iber consumption. A possible explanation for these results is the fact that ours is a young popula-tion, who may not have been exposed to these factors long enough to have had an effect on the components of MetS. Non-differential information bias is another potential explanation for the lack of an association, gi-ven that diet was measured indirectly. Moreover, rever-se causality may have minimized the impact of physi-cal activity, with more obese individuals having been more physically active. On the other hand, even within a small sample in which physical activity was evaluated during adolescence (N = 227, data not shown), this variable was not associated with MetS, thus suggesting that reverse causality is not the most plausible explana-tion for this lack of associaexplana-tion.
One of the weaknesses of the present study is that blood collection did not follow a period of prolonged fasting: on average, subjects had eaten their last meal 3.7 hours before blood collection, with a median pe-riod of 3 hours. In our sample, there was no associa-tion between duraassocia-tion of fasting and altered HDL (p = 0.33) but this variable was associated with altered blood glucose levels (p < 0.001) and triglycerides (p < 0.001). However, the prevalence of metabolic syndro-me was not associated with tisyndro-me of fasting (p = 0.13). Therefore, we do not believe that our indings were biased by fasting time.
Cop
yright
© ABE&M t
odos os dir
eit
os r
eser
vados
.
Table 4. Poisson regression of RR for metabolic syndrome according to NCEP-ATP III criteria; crude and adjusted for demographic, socioeconomic, and behavioral factors, stratified by sex in the 1982 Pelotas cohort at age 23
men Women
crude adjusted crude adjusted
Variable RR RR RR RR Skin color
White Nonwhite
p = 0.98 1.00 0.99 (0.68-1.45)
p = 0.98¹ 1.00 0.99 (0.68-1.45)
p = 0.64 1.00 1.12 (0.69-1.81)
p = 0.67¹ 1.00 0.90 (0.56-1.45) Family income (terciles) Lower Middle Upper
p = 0.18 1.00 1.16 (0.76-1.79)
1.32 (0.87-2.00)
p = 0.08¹ 1.00 1.24 (0.79-1.95)
1.54 (0.95-2.48)
p = 0.001 1.00 0.69 (0.43-1.11)
0.38 (0.21-0.70)
p = 0.02¹ 1.00 0.78 (0.48-1.25) 0.52 (0.28-0.96) Schooling (years)
0 to 4 5 to 8 9 to 11 ≥ 12
p = 0.48 0.90 (0.45-1.83) 1.01 (0.61-1.70) 0.71 (0.42-1.19) 1.00
p = 0.17¹ 1.20 (0.55-2.59) 1.23 (0.70-2.17) 0.78 (0.46-1.32) 1.00
p = 0.001 3.31 (1.13-9.63) 3.60 (1.51-8.59) 2.38 (1.027-5.55) 1.00
p = 0.06¹ 2.26 (0.77-6.61) 2.53 (1.03-6.21) 1.94 (0.82-4.58) 1.00 Smoking p = 0.42
0.85 (0.58-1.25)
p = 0.24² 0.77 (0.50-1.19)
p = 0.94 0.98 (0.59-1.62)
p = 0.37² 0.79 (0.47-1.33) Alcohol intake
Zero Up to 1 dose/day > 1 dose/day
p = 0.67 1.00 0.99 (0.65-1.52)
1.09 (0.71-1.69)
p = 0.56² 1.00 1.04 (0.67-1.60)
1.14 (0.72-1.83)
p = 0.29 1.00 0.96 (0.62-1.50)
0.59 (0.25-1.38)
p = 0.80² 1.00 1.13 (0.72-1.78)
0.73 (0.31-1.73) Higher fiber intake p = 0.10
1.33 (0.94-1.86)
p = 0.09² 1.35 (0.950-1.92)
p = 0.86 1.04 (0.66-1.64)
p = 0.75² 1.06 (0.67-1.68) High fat intake p = 0.99
1.00 (0.70-1.42)
p = 0.69² 0.93 (0.64-1.34)
p = 0.13 0.72 (0.47-1.10)
p = 0.44² 0.85 (0.54-1.33) Physical activity
during leisure time (minutes) Zero 10-140 150 or more
p = 0.34 1.18 (0.80-1.73)
1.31 (0.87-1.98)
1.00
p = 0.22² 1.25 (0.84-1.87)
1.38 (0.91-2.10)
1.00
p = 0.32 1.52 (0.80-2.88)
1.91 (0.91-4.02)
1.00
p = 0.73² 1.24 (0.64-2.39)
1.56 (0.72-3.35)
1.00 BMI (kg/m2)
Normal Overweight Obese
p < 0.001 1.00 3.06 (1.90-4.95)
17.87 (11.75-27.17)
p < 0.001³ 1.00 3.14 (1.97-5.00)
17.41 (11.85-25.60)
p < 0.001 1.00 7.99 (3.72-17.19)
42.65 (21.68-83.92)
p < 0.0014
1.00 7.73 (3.65- 16.38)
40.67 (20.85-79.33)
1: adjusted for variables in the first level (skin color, schooling and family income); 2: adjusted for
schooling, family income and variables of the second level (smoking, alcohol intake, higher fiber and fat intake and physical activity; 3: Adjusted for schooling, family income, higher fiber intake
and BMI; 4: Adjusted for schooling, family income and BMI.
Table 5. Poisson regression of RR for metabolic syndrome according to IDF criteria; crude and adjusted for demographic, socioeconomic, and behavioral factors, stratified by sex in the 1982 Pelotas cohort at age 23
men Women
crude adjusted crude adjusted
Variable RR RR RR RR Skin color
White Nonwhite
p = 0.39 1.00 0.83 (0.54-1.28)
p = 0.471
1.00 0.85 (0.55-1.32)
p = 0.10 1.00 1.36 (0.95-1.96)
p = 0.721
1.00 1.07 (0.74-1.55) Family income (terciles) Lower Middle Upper
p = 0.15 1.00 1.51 (0.95-2.40)
1.42 (0.89-2.26)
p = 0.161
1.00 1.59 (0.97-2.62)
1.46 (0.86-2.49)
p < 0.001 1.00 0.62 (0.42-0.91)
0.34 (0.21-0.56)
p = 0.0051
1.00 0.72 (0.49-1.06) 0.53 (0.31-0.90) Schooling (years)
0 to 4 5 to 8 9 to 11 ≥ 12
p = 0.89 0.88 (0.42-1.83) 0.79 (0.46-1.38) 0.72 (0.43-1.23) 1.00
p = 0.561
1.13 (0.51-2.53) 0.89 (0.48-1.63) 0.75 (0. 43-1.31) 1.00
p < 0.001 5.67 (2.18-14.75) 5.65 (2.44-13.10) 3.74 (1.64-8.57) 1.00
p = 0.011
3.60 (1.29-10.07) 3.78 (1.55-9.21) 2.98 (1.27-7.00) 1.00 Smoking p = 0.35
0.82 (0.54-1.24)
p = 0.302
0.79 (0.51-1.23)
p = 0.86 0.97 (0.65-1.44)
p = 0.384
0.82 (0.53-1.27) Alcohol intake
Zero
Up to 1 dose/day > 1 dose/day
p = 0.34 1.00 0.98 (0.62-1.57)
1.22 (0.76-1.95)
p = 0.322
1.00 0.98 (0.61-1.58)
1.27 (0.77-2.08)
p = 0.009 1.00 0.80 (0.56-1.13)
0.40 (0.18-0.85)
p = 0.104
1.00 0.94 (0.66-1.33)
0.48 (0.22-1.05) Higher fiber intake p = 0.48
1.15 (0.79-1.69)
p = 0.482
1.14(0.78-1.67)
p = 0.05 1.42 (1.01-2.01)
p = 0.044
1.31 (1.01-2.00) High fat intake p = 0.48
1.15 (0.79-1.67)
p = 0.802
1.05 (0.69-1.60)
p = 0.008 0.63 (0.45-0.89)
p = 0.094
0.75 (0.53-1.05) Physical activity
during leisure time (minutes) Zero 10-140 150 or more
p = 0.33 1.20 (0.79-1.81)
1.33 (0.85-2.07)
1.00
p = 0.172
1.31 (0.85-2.00)
1.41 (0.90-2.20)
1.00
p = 0.68 0.96 (0.62-1.48)
1.19 (0.69-2.04)
1.00
p = 0.184
0.76 (0.50-1.17)
0.94 (0.54-1.62)
1.00 BMI (kg/m2)
Normal Overweight Obese
p < 0.001 1.00 35.69 (8.47-150.45) 403.68 (100.46-1622.10)
p < 0.00013
1.00 35.76 (8.8-150.75) 406.98 (101.26-1635.74)
p < 0.001 1.00 18.74 (9.86-35.63) 48.47 (26.14-89.87)
p < 0.0015
1.00 17.67 (9.30- 33.56) 42.53 (22.67-79.80)
¹: adjusted for variables in the first level: skin color, family income, and schooling; ²: adjusted for second level variables: alcohol intake, smoking, low fiber, high fat intake, and leisure time physical activity; ³: adjusted for smoking, alcohol intake, physical activity and BMI; 4: adjusted for
family income, schooling and second level variables; 5: adjusted for family income, schooling,
Cop
yright
© ABE&M t
odos os dir
eit
os r
eser
vados
.
necessarily insurmountable and the inal decision about their use will depend on resources and related practical considerations” (13). The mean blood glucose level in this study was 97.3 ± 15.1 mg/dL and the median was 95.0 mg/dL, similar to a study performed in Vitória, ES, with mean fasting blood glucose of 98.9 ± 19.9 and 95.1 ± 13.7 in men and women without MetS, respectively (26).
Despite this being a young population, obesity was strongly associated with risk of MetS. Countless studies have detected associations between obesity and MetS (32,33); in the Bogalusa Heart Study, childhood obesi-ty was the strongest predictor of MetS in adult life (34) as well as the most important risk factor for cardiovas-cular disease (35,36), which remains as the major cause of death worldwide, especially in developing countries. The indings in the present study conirm the need for early intervention against obesity so as to prevent its impact on cardiovascular risk factors. It is necessary that health workers be alerted as to the need for measuring blood pressure, BMI, and abdominal circumference, in addition to metabolic parameters, especially among the obese, at earlier ages. It will also be necessary that health workers orient patients as to leading a healthy lifestyle, by means of adequate nutrition and physical activity. This may help delay or prevent the progression of MetS to diabetes mellitus, cardiovascular disease, and other complications that can affect the survival of future generations.
This article is based on data from the study “Pelo-tas Birth Cohort, 1982” conducted by a Postgraduate Program in Epidemiology at Universidade Federal de Pelotas. The 1982 Birth Cohort study is currently su-pported by the Wellcome Trust initiative entitled “Ma-jor Awards for Latin America on Health Consequences of Population Change”. Previous phases of the study were supported by the International Development Re-search Center, The World Health Organization, Over-seas Development Administration, European Union, National Support Program for Centers of Excellence (PRONEX), the Brazilian National Research Council (CNPq) and Brazilian Ministry of Health.
Disclosure: no potential conlict of interest relevant to this article was reported.
RefeRences
1. Eckel RH, Grundy SM, Zimmet PZ. The metabolic syndrome. Lan-cet. 2005;365:1415-28.
2. Boney CM, Verma A, Tucker R, Vohr BR. Metabolic syndrome in childhood: association with birth weight, maternal obesity, and gestational diabetes mellitus. Pediatrics. 2005;115:e290-6. 3. Alvarez MM, Vieira AC, Moura AS, da Veiga GV. Insulin resistance
in Brazilian adolescent girls: association with overweight and me-tabolic disorders. Diabetes Res Clin Pract. 2006;74:183-8. 4. Barbieri MA, Bettiol H, Silva AA, Cardoso VC, Simoes VM,
Gu-tierrez MR, et al. Health in early adulthood: the contribution of the 1978/79 Ribeirao Preto birth cohort. Braz J Med Biol Res. 2006;39:1041-55.
5. Brunner EJ, Marmot MG, Nanchahal K, Shipley MJ, Stansfeld SA, Juneja M, et al. Social inequality in coronary risk: central obesity and the metabolic syndrome. Evidence from the Whitehall II stu-dy. Diabetologia. 1997;40:1341-9.
6. Hidvegi T, Hetyesi K, Biro L, Jermendy G. Education level and clustering of clinical characteristics of metabolic syndrome. Dia-betes Care. 2001;24:2013-5.
7. Rosmond R, Bjorntorp P. Occupational status, cortisol secretory pattern, and visceral obesity in middle-aged men. Obes Res. 2000;8:445-50.
8. Park YW, Zhu S, Palaniappan L, Heshka S, Carnethon MR, Heyms-ield SB. The metabolic syndrome: prevalence and associated risk factor indings in the US population from the Third National Health and Nutrition Examination Survey, 1988-1994. Arch Intern Med. 2003;163:427-36.
9. Executive Summary of The Third Report of The National Choles-terol Education Program (NCEP) Expert Panel on Detection, Eva-luation, and Treatment of High Blood Cholesterol in Adults (Adult Treatment Panel III). JAMA. 2001;285:2486-97.
10. Alberti KG, Zimmet P, Shaw J. The metabolic syndrome − a new worldwide deinition. Lancet. 2005;366:1059-62.
11. Barros FC, Victora CG, Horta BL, Gigante DP. [Methodology of the Pelotas birth cohort study from 1982 to 2004-5, Southern Brazil]. Rev Saude Publica. 2008;42 Suppl 2:7-15.
12. Somannavar S, Ganesan A, Deepa M, Datta M, Mohan V. Random capillary blood glucose cut points for diabetes and pre-diabetes derived from community-based opportunistic screening in India. Diabetes Care. 2009;32:641-3.
13. Screening for Type 2 Diabetes − Report of a World Health Organi-zation and International Diabetes Federation meeting. 2003. 14. Physical status: the use and interpretation of anthropometry.
Re-port of a WHO Expert Committee. World Health Organ Tech Rep Ser. 1995;854:1-452.
15. Thompson FE, Byers T. Dietary assessment resource manual. J Nutr. 1994;124:2245S-317S.
16. Craig CL, Marshall AL, Sjostrom M, Bauman AE, Booth ML, Ainsworth BE, et al. International physical activity question-naire: 12-country reliability and validity. Med Sci Sports Exerc. 2003;35:1381-95.
17. Haskell WL, Lee IM, Pate RR, Powell KE, Blair SN, Franklin BA, et al. Physical activity and public health: updated recommendation for adults from the American College of Sports Medicine and the Ame-rican Heart Association. Med Sci Sports Exerc. 2007;39:1423-34. 18. Barros AJ, Hirakata VN. Alternatives for logistic regression in
cross-sectional studies: an empirical comparison of models that directly estimate the prevalence ratio. BMC Med Res Methodol. 2003;3:21.
19. Victora CG, Barros FC. Cohort proile: the 1982 Pelotas (Brazil) birth cohort study. Int J Epidemiol. 2006;35:237-42.
20. Ford ES, Giles WH, Dietz WH. Prevalence of the metabolic syndro-me among US adults: indings from the third National Health and Nutrition Examination Survey. JAMA. 2002;287:356-9.
Cop
yright
© ABE&M t
odos os dir
eit
os r
eser
vados
.
22. Florez H, Silva E, Fernandez V, Ryder E, Sulbaran T, Campos G, et al. Prevalence and risk factors associated with the metabolic syndrome and dyslipidemia in White, Black, Amerindian and Mi-xed Hispanics in Zulia State, Venezuela. Diabetes Res Clin Pract. 2005;69:63-77.
23. Langenberg C, Kuh D, Wadsworth ME, Brunner E, Hardy R. Social circumstances and education: life course origins of social inequa-lities in metabolic risk in a prospective national birth cohort. Am J Public Health. 2006;96:2216-21.
24. Silventoinen K, Pankow J, Jousilahti P, Hu G, Tuomilehto J. Educa-tional inequalities in the metabolic syndrome and coronary heart disease among middle-aged men and women. Int J Epidemiol. 2005;34:327-34.
25. Loucks EB, Magnusson KT, Cook S, Rehkopf DH, Ford ES, Berk-man LF. Socioeconomic position and the metabolic syndrome in early, middle, and late life: evidence from NHANES 1999-2002. Ann Epidemiol. 2007;17:782-90.
26. Salaroli LB, Barbosa GC, Mill JG, Molina MC. [Prevalence of me-tabolic syndrome in population-based study, Vitoria, ES-Brazil]. Arq Bras Endocrinol Metabol. 2007;51:1143-52.
27. Castanheira M, Olinto MT, Gigante DP. [Socio-demographic and lifestyle factors associated with abdominal fat distribution in adults: a population-based survey in Southern Brazil]. Cad Saude Publica. 2003;19 Suppl 1:S55-65.
28. McKeown NM, Meigs JB, Liu S, Saltzman E, Wilson PW, Jacques PF. Carbohydrate nutrition, insulin resistance, and the prevalence
of the metabolic syndrome in the Framingham Offspring Cohort. Diabetes Care. 2004;27:538-46.
29. Lee WY, Jung CH, Park JS, Rhee EJ, Kim SW. Effects of smoking, al-cohol, exercise, education, and family history on the metabolic syn-drome as deined by the ATP III. Diabetes Res Clin Pract. 2005; 67:70-7. 30. Djousse L, Arnett DK, Eckfeldt JH, Province MA, Singer MR, Elli-son RC. Alcohol consumption and metabolic syndrome: does the type of beverage matter? Obes Res. 2004;12:1375-85.
31. Steemburgo T, Dall’Alba V, Gross JL, Azevedo MJ. [Dietary factors and metabolic syndrome]. Arq Bras Endocrinol Metabol. 2007; 51:1425-33.
32. Fernandez ML. The metabolic syndrome. Nutr Rev. 2007;65:S30-4. 33. Meigs JB. Epidemiology of the metabolic syndrome, 2002. Am J
Manag Care. 2002;8:S283-92; quiz S93-6.
34. Srinivasan SR, Myers L, Berenson GS. Predictability of childhood adiposity and insulin for developing insulin resistance syndrome (syndrome X) in young adulthood: the Bogalusa Heart Study. Dia-betes. 2002;51:204-9.
35. Haffner SM, Despres J-P, Balkau B, et al. Waist circumference and body mass index are both independently associated with car-diovascular disease: The International Day for the Evaluation of Abdominal Obesity (IDEA) survey. J Am Coll Cardiol. 2006;47(4 suppl A):358A.