Cop
yright
© ABE&M t
odos os dir
eit
os r
eser
vados
.
Fasting ghrelin but not PYY
(3-36)is associated with
insulin-resistance independently of
body weight in Wistar rats
A grelina, mas não PYY(3-36), está associada com a resistência
à insulina independente do peso corporal em ratos Wistar
Luciana da Conceição Antunes1, Manoela Neves da Jornada1, Jessica
Lorenzzi Elkfury1, Kelly Carraro Foletto1, Marcello Casaccia Bertoluci1
ABSTRACT
Objective: The objective of this study was to evaluate the association between insulin-resistance and fasting levels of ghrelin and PYY in Wistar rats. Materials and methods: A total of 25 male Wistar rats, weighing 200-300 g, was included in this study. The animals were maintained in ca-ges with a 12/12h light-dark cycle and fed standard chow and water ad libitum. After 12-h overni-ght fasting, ghrelin, PYY, insulin and glucose values were determined. Insulin resistance was as-sessed by means of the HOMA-IR, which was ranked and the median was used as a cut-off value to categorize resistance. HOMA-IR values equal and above 2.62 were considered insulin--resistant (IR) while values below 2.62 were considered insulin sensitive (IS). Differences betwe-en means were determined using the Studbetwe-ent t-test. Multiple regression and Pearson’s corre-lation test were used to evaluate the association between variables. Results: HOMA-IR median IQ range values for IS and IR groups were, respectively, 1.56 (0.89 – 2.16) vs. [4.06 (3.50 – 4.61);
p < 0.001]. The IR group presented increased levels of fasting ghrelin, PYY and insulin respectively: [50.35 (25.99 – 74.71) pg/mL vs. 12.33 (8.77 – 15.89) pg/mL; p = 0.001]; [54.38 (37.50 – 71.26) pg/mL vs.
33.17 (22.34 – 43.99) pg/mL; p = 0.016]; [18.04 (14.48 – 21.60) uU/mL vs. 7.09 (4.83 – 9.35) uU/mL; p = 0.001]. Ghrelin, but not PYY, correlated linearly and positively with HOMA-IR: ghrelin vs. HOMA-IR (r = 0.52; p = 0.008), and PYY vs. HOMA-IR (r = 0.22; p = 0.200). This correlation was independent of body weight. Conclusion: Fasting ghrelin and PYY serum levels are increased in lean, relatively insulin resistant Wistar rats, and this increase is independent of weight. Arq Bras Endocrinol Metab. 2014;58(4):377-81
Keywords
Ghrelin; PYY; insulin resistance; HOMA-IR
RESUMO
Objetivo: O objetivo deste estudo foi avaliar a associação entre a resistência à insulina e os ní-veis de grelina e PYY em jejum em ratos Wistar. Materiais e métodos: Um total de 25 ratos Wis-tar machos, pesando 200-300 g, foi usado neste estudo. Os animais foram mantidos em gaiolas com um ciclo de luz escuro de 12/12h e alimentados com ração padrão e água ad libitum. Depois de um jejum de 12h, os valores de grelina, PYY, insulina e glicose foram determinados. A resis-tência à insulina foi avaliada pelo HOMA-IR que foi ordenado e a mediana utilizada como valor de corte para categorizar a resistência à insulina. Os valores de HOMA-IR iguais ou acima de 2,62 foram considerados resistentes à insulina (RI), enquanto valores abaixo de 2,62 foram conside-rados sensíveis (SI). As diferenças entre as médias foram determinadas usando-se o teste t de Student. A análise de regressões múltiplas e o teste de correlação de Pearson foram usados para se avaliar a associação entre as variáveis. Resultados: A mediana e a variação IQ do HOMA-IR para os grupos RI e SI foram, respectivamente, 1,56 (0,89 – 2,16) contra [4,06 (3,50 – 4,61); p < 0,001]. O grupo RI apresentou níveis aumentados de grelina, PYY e insulina em jejum, respecti-vamente, [50,35 (25,99 – 74,71) pg/mL contra 12,33 (8,77 – 15,89) pg/mL; p = 0,001]; [54,38 (37,50 – 71,26) pg/mL contra 33,17 (22,34 – 43,99) pg/mL; p = 0,016]; [18,04 (14,48 – 21,60) uU/mL contra 7,09 (4,83 – 9,35) uU/mL; p = 0.001]. A grelina, mas não PYY, se correlacionou de forma linear e positiva com o HOMA-IR: a grelina contra HOMA-IR (r = 0,52; p = 0,008), e PYY contra HOMA-IR (r = 0,22; p = 0,200). Essa correlação foi independente do peso corporal. Conclusão: Os níveis séricos de jejum de grelina e PYY estão aumentados em ratos Wistar magros relativamente re-sistentes à insulina, e esse aumento é independente do peso. Arq Bras Endocrinol Metab. 2014;58(4):377-81
Descritores
Grelina; PYY; resistência à insulina; HOMA-IR
1 Faculdade de Medicina, Universidade Federal do Rio Grande do Sul (UFRGS), Porto Alegre, RS, Brazil
Correspondence to:
Marcello Casaccia Bertoluci Serviço de Medicina Interna, Hospital de Clínicas de Porto Alegre, Universidade Federal do Rio Grande do Sul
Rua Ramiro Barcelos, 2350 90035-903 – Porto Alegre, RS, Brazil [email protected]
Received on Ago/12/2013 Accepted on Jan/24/2014
Cop
yright
© ABE&M t
odos os dir
eit
os r
eser
vados
.
INTRODUCTION
I
nsulin resistance is a life-long condition associated with increased abdominal adiposity, overfeeding, type 2 diabetes, and cardiovascular disease. Gastrointes-tinal peptides have been recently associated with con-trol of hunger and satiety, but the link between these peptides and insulin-resistance has not been completely determined.Ghrelin is the only known circulating orexigenic peptide, primarily produced in stomach, but also in smaller concentrations in the small intestine, liver, pan-creas, kidney, lung, pituitary, hypothalamus, placenta and testes (1). Under physiological conditions, ghrelin is secreted in a rhythmic pattern of expression with cir-cadian light-dark cycles, and a unique secretory pattern with surges preceding meals (2).
Ghrelin secretion mechanisms occur in part by means of the GHS-R receptor, depending on growth hormone effect (3), which is not completely under-stood yet, with potential regulation by insulin (4). Re-cent studies show that cultured newborn rat stomach cells can express the insulin receptor, suggesting that insulin may play an important role in this regulation. Indeed, ghrelin secretion is inhibited when the animal
is exposed tolow and moderate concentrations of
in-sulin, but this inhibitory effect seems to be lost in the presence of very high concentrations of insulin (4). Moreover, in obese hyper-insulinemic patients with diabetes, fasting ghrelin is suppressed, suggesting that adiposity and insulin-resistance can interfere in ghrelin regulation (5). Thus, it is important to understand the relationship between ghrelin and insulin resistance out-side the context of obesity.
Peptide YY (PYY) is a satiety peptide mainly secreted by L cells at the distal intestine and colon in response to food intake. It is rapidly metabolized to its active form, PYY(3-36), by means of the action of dipeptidyl peptidase IV (DPP-IV) (6). PYY(3-36) has been implicated as a sa-tiety peptide inhibiting food intake in both humans (7) and rodents (8), and its fasting levels have been shown to be reduced in human obesity, suggesting that it is re-lated to adiposity (9). The association of these peptides and insulin-resistance has not been studied outside the context of obesity and hyperglycemia.
In the present study, we evaluated fasting plasma ghrelin and PYY in relation to weight and relative in-sulin-resistance determined by HOMA-IR in lean non-diabetic Wistar rats.
MATERIALS AND METHODS
Protocol
In a cross-sectional study, we examined 25 male Wistar rats to determine serum PYY, insulin, ghrelin and glu-cose. Rats weighing 200-300 g were included in this study. The animals were kept in a 12/12h light-dark cycle, and fed standard chow and water ad libitum. All experimental procedures were performed in accordance with the animal welfare guidelines of the institution and were approved by the Ethics Committee in Animal Re-search at Hospital de Clinicas de Porto Alegre, Porto Alegre, RS, Brazil.
Sample collection
After 12-hour overnight fasting, blood was collected from the retro-orbital artery in a glass cannula directly into an eppendorf tube. Simultaneously to the blood collection, Pefabloc® SC (AEBSF) (Roche®, Mannheim, Germany) was added to ghrelin at 1 mg/mL of total blood. Samples were not pre-acidiied. Blood was mixed with Pefabloc® less than 30 s after collection. Then it was immediately placed in an ice-bath and centrifuged at 1,000 xg for 10 minutes at room temperature, ac-cording to the manufacturer’s instructions. Serum was stored at -80°C until the assay was performed.
Hormone and biochemistry measurements
Total Ghrelin, PYY(3-36), and insulin were determined by
Luminex® using kits purchased from Linco Research®
(Millipore®, Billerica, MA). Acylated ghrelin is the
bioac tive form of ghrelin; however, total ghrelin seems to be a good surrogate for the acylated form because the ratio of the two molecular forms is constant un-der a wide variety of conditions that affect this peptide (5,10,11). Respective limits of detection for ghrelin, PYY and insulin were: 2, 16, and 28 pg/mL. Capillary blood collected from the tail was used to determine
blood glucose values using a glucometer (Medisense®
Optium Xceed Meter).
Statistical analysis
HOMA-IR was ranked apriori to determine the
Cop
yright
© ABE&M t
odos os dir
eit
os r
eser
vados
.
were presented as means and standard deviations. Dif-ferences between IR and IS groups were determined using the Student t-Test. For the study of correlations, we used multiple linear regression and Pearson’s cor-relation test for all variables. SPSS version 17 was used. A p value of 0.05 was considered signiicant.
RESULTS
According to HOMA-IR rank, we determined insulin resistant (IR group) (n = 13) and insulin sensitive (IS group) (n = 12) rats. HOMA-IR median cut-off for insulin resistance was 2.62. Median HOMA-IR and interquartile range values for IS and IR groups were respectively: [1.56 (0.89-2.16) and 4.06 (3.50 – 4.61);
p < 0.001] (Table 1).
We veriied that the IR group presented signiicantly higher levels of fasting ghrelin, PYY and insulin than the IS group: [50.35 (25.99 – 74.71) pg/mL vs. 12.33
(8.77 – 15.89) pg/mL; p = 0.001], [54.38 (37.50 –
71.26) pg/mL vs. 33.17 (22.34 – 43.99) pg/mL; p =
0.016], [18.04 (14.48 – 21.60) uU/mL vs. 7.09 (4.83
– 9.35) uU/mL; p = 0.001] (Table 1).
The IR and IS groups did not differ in body weight
and fasting glucose values: [292.90 ± (10.84) g vs.
289.95 ± (10.32) g; p = 0.495], [97 ± (10.48) mg/dL
vs. 91 ± (12.45) mg/dlL; p = 0.201] (Table 1). Fasting ghrelin, but not PYY, correlated directly with
HOMA IR: (r = 0.52; p = 0.008) and (r = 0.22; p =
0.200) (Figures 1A and 1B, respectively). Fasting ghre-lin was signiicantly correlated with body weight (Figure 1C) and fasting insulin: (r = 0.54; p = 0.005) and (r =
0.51; p = 0.009). Fasting PYY did not correlate with
insulin: (r = 0.32; p = 0.119) or body weight (r = 0.2;
p = 0.921) (Figure 1D). Fasting ghrelin and PYY peptides did not correlate with each other. (r = 0.37; p = 0.069).
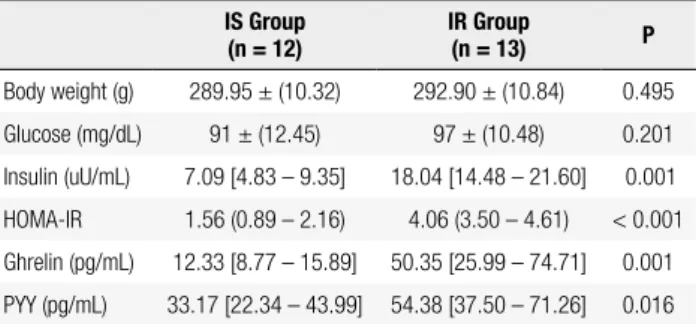
Table 1. Sample characteristics*
IS Group (n = 12)
IR Group
(n = 13) P
Body weight (g) 289.95 ± (10.32) 292.90 ± (10.84) 0.495
Glucose (mg/dL) 91 ± (12.45) 97 ± (10.48) 0.201
Insulin (uU/mL) 7.09 [4.83 – 9.35] 18.04 [14.48 – 21.60] 0.001
HOMA-IR 1.56 (0.89 – 2.16) 4.06 (3.50 – 4.61) < 0.001
Ghrelin (pg/mL) 12.33 [8.77 – 15.89] 50.35 [25.99 – 74.71] 0.001
PYY (pg/mL) 33.17 [22.34 – 43.99] 54.38 [37.50 – 71.26] 0.016
* Comparison between groups by t- test for two independent samples. Body weight and glucose are expressed in mean and standard deviation. HOMA-IR values are shown in median and interquartile ranges. Other variables are expressed in mean and Conidence Interval. IS group = insulin sensitive group; IR group = insulin resistant group.
A. Ghrelin
Log Ghrelin
Log HOMA-IR
4
3
2
1
0
-1 0 1 2
r = 0.52
p = 0.008
* Pearson's correlation between Ghrelin and HOMA-IR
B. PYY
Log PYY
Log HOMA-IR
3
2
1
-1 0 1 2
r = 0.22
p = 0.200
* Pearson's correlation between PYY and HOMA-IR
C. Ghrelin
Log Ghrelin
Weight (g)
4
2
0 3
1
300 350 400
r = 0.54
p = 0.005
* Pearson's correlation between Ghrelin and body weight
D. PYY
Log PYY
Weight (g)
3
2
1
300 350 400
r = 0.02
p = 0.921
* Pearson's correlation between PYY and body weight
Cop
yright
© ABE&M t
odos os dir
eit
os r
eser
vados
.
DISCUSSION
The present study shows that, in Wistar rats, fasting ghrelin is associated with insulin-resistance, indepen-dently of body weight. The same effect was not ob-served for PYY(3-36). This inding suggests that ghrelin-secreting cells may be up-regulated in the fasting state by the presence of insulin-resistance without the inter-ference of weight.
So far, few studies have evaluated the association between ghrelin and insulin-resistance. In newborn rat X/A stomach cells, the secretion of ghrelin is progres-sively inhibited by increasing concentrations of insulin. However, this effect is abolished by higher concentra-tions of insulin by the inhibition of phospho-inositol-3 kinase, thus suggesting that cellular insulin resistance can impair the suppressive effect of insulin in fasting ghrelin (4). In another study, the ablation of the ghre-lin receptor (growth hormone secretagogue recep-tor – GHS-r) in knockout Ghsr-/- mice, compared with wild type mice, improved the natural age-related insulin-resistance, reinforcing a role of ghrelin in the insulin-resistant state (12). Moreover, in healthy over-weight subjects receiving ghrelin infusions over 2 hours along with endovenous insulin and somatostatin, an acute muscle insulin resistance was produced by ghrelin (13). On the other hand, when evaluating fasting ghre-lin levels in cross-sectional studies with insughre-lin-resistant hyperinsulinemic obese patients, ghrelin levels are de-creased, indicating a possible suppressive effect of insu-lin in ghreinsu-lin secretion in the presence of obesity (5). In the present study, we observed a signiicant positive association between ghrelin and insulin-resistance and an independent association between ghrelin and weight, which is in accordance with the above indings and rein-force the concept that insulin resistance may up-re gulate fasting ghrelin secretion in the absence of obesity.
The relationship between PYY and insulin-resistance has been controversial. In relatives of type 2 diabetic patients, fasting serum PYY has been shown to be low and to correlate negatively with insulin resistance (14). However, in a larger recent study of type 2 diabetic patients with coronary artery disease, the serum active form of PYY(3-36) in the fasting state was positively cor-related with serum insulin levels and to body mass index (9). This study also showed that abdominal adiposity was an important determinant of PYY(3-36) concentra-tion in type 2 diabetic subjects, and the higher PYY(3-36) levels could be due to the higher adiposity of the
pa-tients. However, the authors found that the association between high fasting PYY(3-36) did not depend on total or regional adiposity. It was then speculated that the two forms of PYY may have different effects on insulin metabolism, with PYY(1-36) having a more potent role in insulin secretion than PYY(3-36), while PYY(3-36) may have an increased impact on insulin-resistance than PYY
(1-36). Our results did not conirm an association between insulin-resistance and fasting PYY levels in the pres-ent model, suggesting that mild insulin-resistant states could be insuficient to inluence the increase in fast-ing ghrelin and PYY(3-36) in lean animals. We cannot ex-clude, however, that the response of PYY to food over-load would be altered in the setting of insulin resistance.
The present study has clear limitations because of the cross-sectional design, which does not enable infer-ring causality between insulin-resistance and the secre-tion of both peptides. We believe, however, that insu-lin-resistance may be the most logical causative factor because of the presence of insulin receptors in stomach cells. Longitudinal studies are necessary to further clari-fy the natural history of insulin-resistance and the regu-lation of fasting ghrelin in this experimental model.
In conclusion, these results support a role of fast-ing ghrelin in the pathogenesis of insulin-resistance in Wistar rats, and the hypothesis of a possible gastro-intestinal role of insulin-resistance. We speculate that the loss of insulin inhibitory effect may be an adaptive metabolic adjustment. Further studies are necessary to investigate whether insulin resistance may inluence sa-tiety and food intake by means of the effect on these peptides.
Contributor statements: Luciana da Conceição Antunes designed the study, wrote the protocol, reviewed studies, drafted the arti-cle, conducted part of the statistical analysis and interpreted the data. Manoela Neves da Jornada designed the study, wrote the protocol, reviewed studies and drafted the article. Kelly Carraro Foletto participated in the experimentation and conducted part of the statistical analysis. Marcello Casaccia Bertoluci participated in study design, wrote the protocol, interpreted the data, drafted the article and was responsible for the inal approval of this version.
Acknowledgments: this study was supported by Fundo de Incentivo à Pesquisa – FIPE/HCPA, Porto Alegre/Brazil. The authors also thank Hospital de Clínicas de Porto Alegre, Post-Graduation Research Group (GPPG), Luciano Guimaraes, Animal Experimentation Unity (UEA/HCPA), Marta Cioato and Fabiola Meyer. We are in debt to Dr. Eurico Camargo Neto for the special assistance with the PYY and Ghrelin determinations.
Cop
yright
© ABE&M t
odos os dir
eit
os r
eser
vados
.
REFERENCES
1. Kojima M, Hosoda H, Date Y, Nakazato M, Matsuo H, Kangawa K. Ghrelin is a growth-hormone-releasing acylated peptide from stomach. Nature. 1999;402(6762):656-60.
2. Cummings DE, Purnell JQ, Frayo RS, Schmidova K, Wisse BE, Weigle DS. A preprandial rise in plasma ghrelin levels suggests a role in meal initiation in humans. Diabetes. 2001;50(8):1714-9. 3. Fukumori R, Mita T, Sugino T, Hasegawa Y, Kojima M, Kangawa K,
et al. Effects of intravenous ghrelin injection on plasma growth hormone, insulin and glucose concentrations in calves at wean-ing. Anim Sci J. 2013;84(4):310-5.
4. Gagnon J, Anini Y. Insulin and norepinephrine regulate ghrelin secretion from a rat primary stomach cell culture. Endocrinology. 2012;153(8):3646-56.
5. McLaughlin T, Abbasi F, Lamendola C, Frayo RS, Cummings DE. Plasma ghrelin concentrations are decreased in insulin-resistant obese adults relative to equally obese insulin-sensitive controls. J Clin Endocrinol Metab. 2004;89(4):1630-5.
6. Batterham RL, Bloom SR. The gut hormone peptide YY regulates appetite. Ann N Y Acad Sci. 2003;994:162-8.
7. Steinert RE, Feinle-Bisset C, Geary N, Beglinger C. Secretion of gastrointestinal hormones and eating control. J Anim Sci. 2013;91(5):1963-73.
8. Batterham RL, Cowley MA, Small CJ, Herzog H, Cohen MA, Dakin CL, et al. Gut hormone PYY(3-36) physiologically inhibits food in-take. Nature. 2002;418(6898):650-4.
9. Ukkola OH, Puurunen VP, Piira OP, Niva JT, Lepojärvi ES, Tulppo MP, et al. High serum fasting peptide YY (3-36) is associated with obesity-associated insulin resistance and type 2 diabetes. Regul Pept. 2011;170(1-3):38-42.
10. Murakami N, Hayashida T, Kuroiwa T, Nakahara K, Ida T, Mondal MS, et al. Role for central ghrelin in food intake and secre-tion proile of stomach ghrelin in rats. J Endocrinol. 2002; 174(2):283-8.
11. Ariyasu H, Takaya K, Hosoda H, Iwakura H, Ebihara K, Mori K, et al. Delayed short-term secretory regulation of ghrelin in obese animals: evidenced by a speciic RIA for the active form of ghre-lin. Endocrinology. 2002;143(9):3341-50.
12. Lin L, Saha PK, Ma X, Henshaw IO, Shao L, Chang BH, et al. Ablation of ghrelin receptor reduces adiposity and improves insulin sensitivity during aging by regulating fat metabolism in white and brown adipose tissues. Aging Cell. 2011;10(6):996-1010.
13. Vestergaard ET, Gormsen LC, Jessen N, Lund S, Hansen TK, Moller N, et al. Ghrelin infusion in humans induces acute insulin resistance and lipolysis independent of growth hormone signal-ing. Diabetes. 2008;57(12):3205-10.