Assessing the Independent Contribution of
Maternal Educational Expectations to
Children
’
s Educational Attainment in Early
Adulthood: A Propensity Score Matching
Analysis
Jean Baptiste Pingault1, Sylvana M. Côté2,3,4*, Amélie Petitclerc5, Frank Vitaro2, Richard E. Tremblay2,3,4,6,7,8,9
1Division of Psychology and Language Sciences, University College London, London, United Kingdom, 2Research Unit on Children’s Psychosocial Maladjustment, University of Montreal and Sainte–Justine Hospital, Montreal, Quebec, Canada,3International Laboratory for Child and Adolescent Mental Health Development, University of Montreal, Montreal, Quebec, Canada,4Institute of Genetic, Neurobiological and Social Foundations of Child Development, Tomsk State University, Tomsk, Russian Federation,5Teachers College, Columbia University, New York, New York, United States of America,6School of Public Health, Physiotherapy and Population Science, University College Dublin, Dublin, Ireland,7Department of Pediatrics, University of Montreal, Montreal, Quebec, Canada,8Departments of Psychiatry, University of Montreal, Montreal, Quebec, Canada,9Departments of Psychology, University of Montreal, Montreal, Quebec, Canada
Abstract
Background
Parental educational expectations have been associated with children’s educational attain-ment in a number of long-term longitudinal studies, but whether this relationship is causal has long been debated. The aims of this prospective study were twofold: 1) test whether low maternal educational expectations contributed to failure to graduate from high school; and 2) compare the results obtained using different strategies for accounting for confounding variables (i.e. multivariate regression and propensity score matching).
Methodology/Principal Findings
The study sample included 1,279 participants from the Quebec Longitudinal Study of Kin-dergarten Children. Maternal educational expectations were assessed when the partici-pants were aged 12 years. High school graduation–measuring educational attainment– was determined through the Quebec Ministry of Education when the participants were aged 22–23 years. Findings show that when using the most common statistical approach (i.e. multivariate regressions to adjust for a restricted set of potential confounders) the contribu-tion of low maternal educacontribu-tional expectacontribu-tions to failure to graduate from high school was statistically significant. However, when using propensity score matching, the contribution of maternal expectations was reduced and remained statistically significant only for males.
OPEN ACCESS
Citation:Pingault JB, Côté SM, Petitclerc A, Vitaro F, Tremblay RE (2015) Assessing the Independent Contribution of Maternal Educational Expectations to Children’s Educational Attainment in Early Adulthood: A Propensity Score Matching Analysis. PLoS ONE 10(3): e0119638. doi:10.1371/journal.pone.0119638
Academic Editor:Andrew H Kemp, Hospital Universitário, BRAZIL
Received:May 22, 2014
Accepted:February 2, 2015
Published:March 24, 2015
Copyright:© 2015 Pingault et al. This is an open access article distributed under the terms of the Creative Commons Attribution License, which permits unrestricted use, distribution, and reproduction in any medium, provided the original author and source are credited.
Data Availability Statement:The data cannot be made publicly available because of an ethical restriction. Readers may contact the GRIP (Research unit on children psychosocial maladjustment) to request the data at the following email address: [email protected].
Conclusions/Significance
The results of this study are consistent with the possibility that the contribution of parental expectations to educational attainment is overestimated in the available literature. This may be explained by the use of a restricted range of potential confounding variables as well as the dearth of studies using appropriate statistical techniques and study designs in order to minimize confounding. Each of these techniques and designs, including propensity score matching, has its strengths and limitations: A more comprehensive understanding of the causal role of parental expectations will stem from a convergence of findings from studies using different techniques and designs.
Introduction
Educational expectations
’
role in educational attainment
Parental educational expectations have been associated with children’s educational attainment in a number of long-term longitudinal studies [1–7]. All but one [4] found a positive statistical-ly significant contribution of expectations to educational outcomes. Whether this consistent re-lationship between parental expectations and children’s educational attainment is causal has long been debated (see [8], and [9]). The issue of causality is of paramount importance in order to determine if expectations are valuable targets for intervention. Although we cannot draw strict causal inferences from observational studies, several authors have recently emphasized the need to build on research designs and "statistical innovations that allow for stronger causal inference" [10] as a crucial complement to experimental studies [11]. The purpose of this study was to build on one such tool, propensity score matching, to examine the relationship between low maternal educational expectations, assessed when the children were aged 12 years, to high school graduation 10 years later. To simplify, the term propensity score matching is used here to refer to the large family of methods used to equate the distribution of covariates in the treat-ed and control groups.
Educational expectations and selection bias
Selection bias is an important problem when trying to assess the contribution of maternal ex-pectations to the child’s educational attainment. Maternal expectations are far from being dis-tributed at random in the population. For instance, maternal expectations are influenced by social characteristics such as the mother’s own level of education [12,13]. In turn, maternal ed-ucation is a key predictor of the child’s educational attainment [6,13,14]. Mothers with higher levels of education are thus likely to have higher educational expectations for their children, and their children are more likely to succeed in school. Hence, maternal expectations may con-stitute a by-product of maternal education and, consequently, retains no causal role in predict-ing children’s educational attainment. Failing to take into account maternal education would thus seriously bias the estimation of the contribution of maternal expectations to educational attainment. A number of variables are likely to play such a confounding role. Socioeconomic characteristics of the family strongly predict both expectations and educational outcomes [12–
19]. Similarly, family structure or changes in the family (e.g. intact versus non-intact family, house moving) and parenting variables may also represent a source of bias [12,14,19,20]. It is also important to account for two sets of child characteristics highly correlated with
Program/ Canadian Institutes of Health Research); grant SES–9911370 from the US National Science Foundation; grant RO1 MH65611–01A2 from the US National Institute of Mental Health; and a grant from the National Consortium on Violence Research (which is supported by grant SBR–9513040 from the National Science Foundation). Dr Pingault received a post–doctoral fellowship from the Research Unit on Children’s Psychosocial Maladjustment via a grant from the Fonds de la Recherche et de la Santé du Québec (#16031) attributed to Dr. Côté.
educational outcomes and maternal expectations such as child’s school performance [3,9,14,21,22] or children’s behaviors, in particular inattention [6,23,24].
To assess the long-term contribution of parental expectations to a range of education out-comes, several studies utilized longitudinal designs controlling for a restricted number of the confounding variables outlined above [2,3,5–7]. All of these studies [2,3,5–7] reported a statis-tically significant long-term contribution of parental expectations to educational outcomes. However, the contribution of parental expectations to educational outcomes may have been overestimated as important control variables were omitted.
Two studies stand out [1,4] as they controlled for many more potential confounders. Alex-ander et al. [1] still detected a statistically significant beneficial contribution of parental expec-tations to school outcomes. Ou and Reynolds [4], who included the largest range of variables, examined the contribution of parental expectations, measured at 10 years, in a series of models with different blocks of predictors and several high school outcomes, including high school graduation. Parental expectations made a statistically significant contribution when first intro-duced in their models, along with control variables and blocks of predictors measured mostly before age 10 years. However, they became non-significant after the inclusion of additional var-iables mostly measured at age 10 years or later. Therefore, the non-significant contribution of parental expectations in the final model may reflect mediational processes (i.e. there is a true causal chain from parental expectations to attainment but through later intervening variables). In sum, the contribution of parental expectations to educational outcomes may have been over-estimated since most studies included a limited number of control variables; yet, in the study with the largest number of control variables [4], their contribution may have been underesti-mated because of the inclusion of later intervening variables.
A propensity score approach
As outlined above, including only a restricted set of potential confounders may overestimate ef-fects. However, including a large set of potential confounders in multivariate regressions (as in [1], and [4]) is also problematic. First, as emphasized by Rubin [25]:“regression analysis can-not reliably adjust for differences in observed covariates when there are substantial differences in the distribution of these covariates in the two groups”(for instance substantially different mean levels of income in a high expectation group versus a low expectation group). When re-gression approaches cannot remove all or nearly all the bias, alternative strategies such as pro-pensity score matching can be used [25]. Second, propensity score matching also deals with additional problems encountered in regression models: multicollinearity, modeling choices and specifications as, for instance, choosing a linear model over a quadratic one [26]. Multicol-linearity in particular may be an issue when using a large number of confounders as covariates in multivariate regressions.
generalization of this procedure to the multivariate case: after matching, the two groups should be balanced on a set of confounders (i.e. for each confounder, the mean should be very similar in the two groups). Thepropensity score, generated for each participant and used to match them, is the probability of belonging to the exposed group conditional on a set of confounders. For instance, in this study, children in the low maternal expectation group have a high proba-bility of belonging to this group given a set of confounders (e.g. lower income and maternal ed-ucation); however, in the high expectation group, some participants also have a high
probability of belonging to the low expectation group but, nevertheless, belong to the high ex-pectation group (e.g., children whose mothers have low income and education, yet have high educational expectations for their children). The matching procedure aims to reduce the dis-tancebetween the two groups, i.e. the propensity score standardized mean difference between the two groups. The standardized mean difference must be reduced for the propensity score but also for each confounder. As a general rule, it is important that the confounders included in the propensity score are measured before exposure [25,26]. For instance, in the present case, a variable measured after, (i.e. school achievement at a later period) may already have been influenced by low maternal expectations, so that the level of this variable may be legitimately lower in the group with low maternal expectations.
In the present study, we implemented the approaches used in the literature (i.e. small or large set of confounders) to compare their results with those obtained using propensity score matching. The aim was two-fold: 1) test whether we could replicate the results found in most previous studies (i.e. the significant association between educational expectations and educa-tional outcomes); 2) test if the use of propensity score matching changed the results.
Finally, the role of expectations may not be equal across the entire population. In particular, sex may moderate the association between expectations and educational attainment. Several authors have highlighted the need to consider sex differences more systematically in studies on expectations and their consequences [3,13]. Whether the contribution of parental expectations to educational outcomes differs between males and females, has been examined by very few studies [28,29] with mixed results. We thus tested the interaction between maternal expecta-tions and sex.
Methods
The study has been approved by the University of Montreal Ethics Committee. After complete description of the study, written consent was obtained from the mothers at each wave of data collection (including consent regarding teachers’reports).
Participants
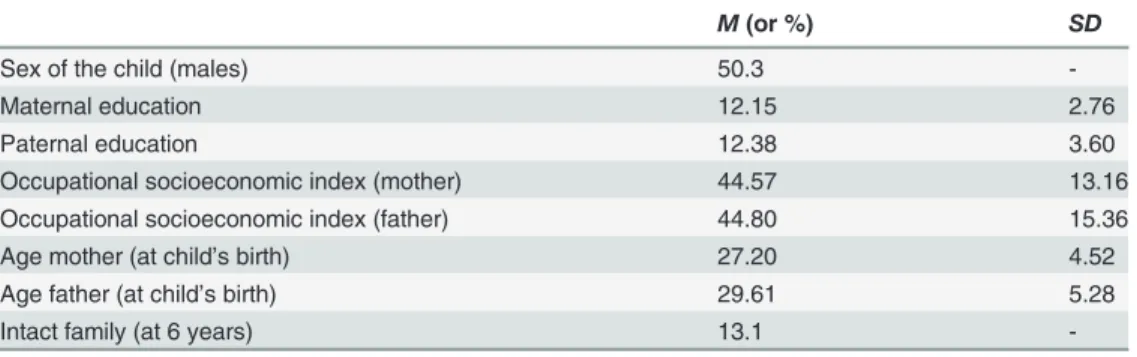
The study sample included 1,279 participants belonging to the Quebec Longitudinal Study of Kindergarten Children (presented in detail in [30]). In this cohort, 3,007 children were first as-sessed in 1986–1987 when they were in kindergarten in Quebec’s French-speaking public schools (Canada) and followed thereafter. A total of 1,776 participants had data for both mater-nal educatiomater-nal expectations–assessed when the children were 12 years–and educational at-tainment at age 22–23 years. We selected the 1,279 participants with low and high maternal expectations (see details below).Table 1presents the demographic characteristics of the study sample.
Measures
Outcome variable. In 2003, when the participants were aged 22–23 years old, information
with permission from the Québec Data Access Board. The measure differentiated between par-ticipants who had a high school diploma (coded zero) and parpar-ticipants who did not (coded one, which included those who dropped out and those who were still attending school).
Independent/exposure variable. When the child was 12 years old, the mother answered
the following question: At what level do you want your child to finish studying? The answer was (1) to finish high school or a lower level (N = 211); (2) to terminate Cegep (N = 497); and (3) to obtain a university degree (N = 1068). The colleges (Cegep) provide a program that is a requirement for entry to university. Students who complete high school (after 11 years of schooling) must complete two years of the colleges and then proceed to university for comple-tion of their program.
Although matching techniques in multi-group cases are being developed (called nonbipar-tite matching), most existing matching methods in the literature focus on two groups (called bipartite matching) [31] and software applications such methods [32] have richer features (e.g. matching algorithms and options). We thus only considered children whose mother had low or high expectations and discarded children whose mother had intermediate expectations, leading to the study sample of 1,279 children.
Maternal educational expectations represent how far mothersthinkor expect their child will go, whereas maternal educational aspirations represent how far motherswanttheir child to study. Although distinct at the conceptual level and, somewhat, at the empirical level [9,33], expectations and aspirations are highly correlated and the two concepts have often been used as proxies for one another [34]. We adopted this approach and used our question about what mothers want for their child educational attainment as a proxy of maternal expectations.
Potential confounders. Multicollinearity is less of a problem when using propensity score
matching than when using multivariate regression [26]. It is thus possible to be more liberal in the inclusion of potential confounders and, therefore, reduce the potential bias due to unob-served confounding variables. We selected variables that represented a well-documented source of bias as well as variables that could represent a potential source of bias even in the ab-sence of extensive literature on the topic. We then tested whether these variables were associat-ed with the prassociat-edictorand/orthe outcome [27]. A total of 60 potential confounders were tested for inclusion in the propensity score. 54 variables were retained and are listed inTable 2.
Family characteristics and parenting. Maternal and paternal education were measured
by the number of years of schooling assessed when the child was 6–7 years old.Occupational socioeconomic indexof the mother and the father were assessed when the child was aged 6 years, based on Blishen et al. [35].Annual incomeof the whole family was assessed when the child was 7 years old and divided into categories (from 1 to 13) of $5,000 (Canadian), with cate-gory 1 being<$5,000 and category 13 being>$60,000.Age of the motherandof the father
Table 1. Demographic Characteristics of the Study Sample.
M(or %) SD
Sex of the child (males) 50.3
-Maternal education 12.15 2.76
Paternal education 12.38 3.60
Occupational socioeconomic index (mother) 44.57 13.16
Occupational socioeconomic index (father) 44.80 15.36
Age mother (at child’s birth) 27.20 4.52
Age father (at child’s birth) 29.61 5.28
Intact family (at 6 years) 13.1
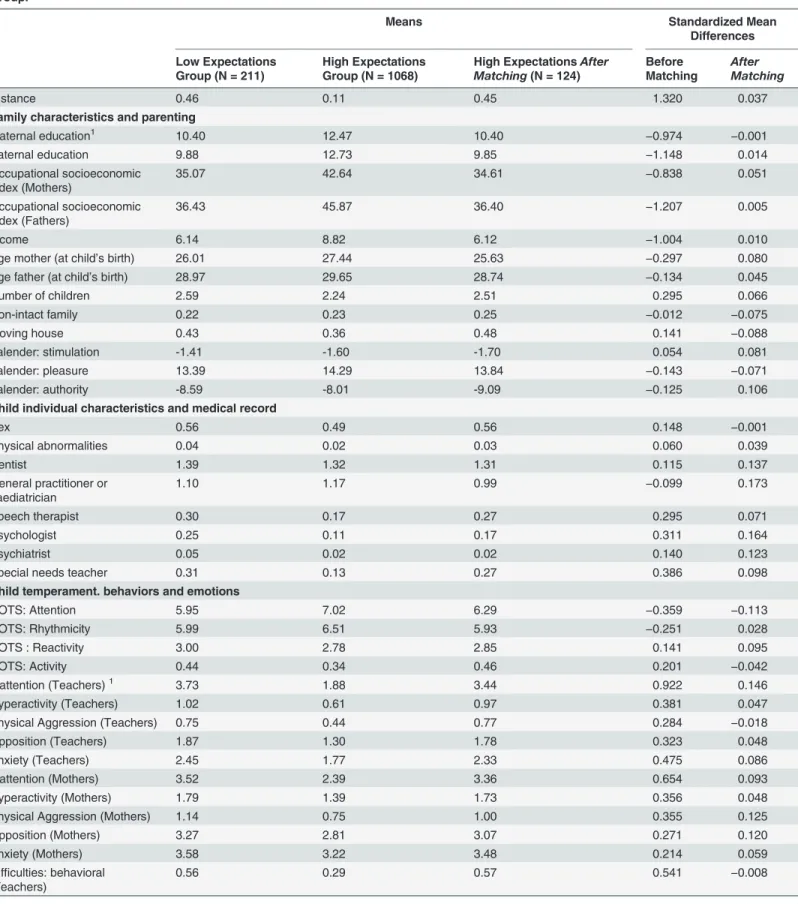
Table 2. Balance in Covariates Before and After Matching between the Low Maternal Expectations Group and the High Maternal Expectations Group.
Means Standardized Mean
Differences
Low Expectations Group (N = 211)
High Expectations Group (N = 1068)
High ExpectationsAfter Matching(N = 124)
Before Matching
After Matching
Distance 0.46 0.11 0.45 1.320 0.037
Family characteristics and parenting
Maternal education1 10.40 12.47 10.40 −0.974 −0.001
Paternal education 9.88 12.73 9.85 −1.148 0.014
Occupational socioeconomic index (Mothers)
35.07 42.64 34.61 −0.838 0.051
Occupational socioeconomic index (Fathers)
36.43 45.87 36.40 −1.207 0.005
Income 6.14 8.82 6.12 −1.004 0.010
Age mother (at child’s birth) 26.01 27.44 25.63 −0.297 0.080
Age father (at child’s birth) 28.97 29.65 28.74 −0.134 0.045
Number of children 2.59 2.24 2.51 0.295 0.066
Non-intact family 0.22 0.23 0.25 −0.012 −0.075
Moving house 0.43 0.36 0.48 0.141 −0.088
Falender: stimulation -1.41 -1.60 -1.70 0.054 0.081
Falender: pleasure 13.39 14.29 13.84 −0.143 −0.071
Falender: authority -8.59 -8.01 -9.09 −0.125 0.106
Child individual characteristics and medical record
Sex 0.56 0.49 0.56 0.148 −0.001
Physical abnormalities 0.04 0.02 0.03 0.060 0.039
Dentist 1.39 1.32 1.31 0.115 0.137
General practitioner or paediatrician
1.10 1.17 0.99 −0.099 0.173
Speech therapist 0.30 0.17 0.27 0.295 0.071
Psychologist 0.25 0.11 0.17 0.311 0.164
Psychiatrist 0.05 0.02 0.02 0.140 0.123
Special needs teacher 0.31 0.13 0.27 0.386 0.098
Child temperament. behaviors and emotions
DOTS: Attention 5.95 7.02 6.29 −0.359 −0.113
DOTS: Rhythmicity 5.99 6.51 5.93 −0.251 0.028
DOTS : Reactivity 3.00 2.78 2.85 0.141 0.095
DOTS: Activity 0.44 0.34 0.46 0.201 −0.042
Inattention (Teachers)1 3.73 1.88 3.44 0.922 0.146
Hyperactivity (Teachers) 1.02 0.61 0.97 0.381 0.047
Physical Aggression (Teachers) 0.75 0.44 0.77 0.284 −0.018
Opposition (Teachers) 1.87 1.30 1.78 0.323 0.048
Anxiety (Teachers) 2.45 1.77 2.33 0.475 0.086
Inattention (Mothers) 3.52 2.39 3.36 0.654 0.093
Hyperactivity (Mothers) 1.79 1.39 1.73 0.356 0.048
Physical Aggression (Mothers) 1.14 0.75 1.00 0.355 0.125
Opposition (Mothers) 3.27 2.81 3.07 0.271 0.120
Anxiety (Mothers) 3.58 3.22 3.48 0.214 0.059
Difficulties: behavioral (Teachers)
0.56 0.29 0.57 0.541 −0.008
when the target child was born, as well as thenumber of childrenin the family (assessed when the target child was 9 years).Intact familywas coded 1 when the mother reported at least once that the child lived in a non-intact or step-family between ages 6 and 11 years (reporting was available every year); it was coded 0 otherwise.Residential move: a similar coding was adopted to reflect whether the mother reported a residential move between ages 6 and 11 years. Mothers completed a French version of a parent child-rearing attitude questionnaire when the child was age 6 and 7 years [36]. Mothers responded to each item on a 4-point scale ranging from“very false”to“very true”. Three dimensions were assessed:Pleasure(18 items, alphas for the two years: 0.81, 0.83),Stimulation(12 items, alphas: 0.51, 0.51),and Discipline(16 items, alphas: .63, .60). The scores were averaged across the two years.
Child individual characteristics and medical records. Thesexof the child was coded 1
for boys and 0 for girls. When the child was 11 years, the mother was asked whether the child hadphysical abnormalitieswhen he/she was born (0 = no; 1 = yes). Each year between 6 and 11
Table 2. (Continued)
Means Standardized Mean
Differences
Low Expectations Group (N = 211)
High Expectations Group (N = 1068)
High ExpectationsAfter Matching(N = 124)
Before Matching
After Matching
Difficulties: relational (Teachers) 0.46 0.30 0.44 0.319 0.044
Difficulties: behavioral (Mothers) 0.41 0.25 0.41 0.329 0.009
Difficulties: relational (Mothers) 0.28 0.17 0.25 0.241 0.062
Emotional troubles (Mothers) 0.48 0.38 0.50 0.208 −0.030
Get along with family 1.84 1.68 1.78 0.236 0.096
Child academic record
Grade retention2 0.34 0.08 0.34 0.539 0.00
Reading 2.54 3.59 2.59 −1.159 −0.056
Writing 2.45 3.45 2.47 −1.081 −0.024
Maths 2.76 3.63 2.86 −1.013 −0.114
Global performance1 2.58 3.56 2.64 −1.144 −0.069
Get along with teachers 1.59 1.35 1.56 0.359 0.049
Like school 2.18 1.81 2.15 0.487 0.042
Difficulties: academic performance (Teachers)
0.64 0.24 0.64 0.835 0.006
Difficulties: motivation (Teachers)
0.68 0.29 0.67 0.833 0.018
Difficulties: diligence (Teachers) 0.16 0.08 0.21 0.232 −0.142
Difficulties: academic performance (Mothers)
0.47 0.19 0.44 0.547 0.046
Difficulties: motivation (Mothers) 0.60 0.27 0.59 0.665 0.024
Difficulties: diligence (Mothers) 0.12 0.06 0.13 0.198 −0.015
Average Absolute Standardized
Mean Differences3 - - - 0.438 0.063
Note. Each standardized mean difference is obtained by: mean in the low expectation group minus mean in the high expectation group, divided by the standard deviation in the low expectation group.
1Mahalanobis distance used. 2Exact matching used.
3The average absolute standardized mean difference is the average of the absolute values of standardized mean differences for all covariates.
years, the mother was asked if the child had gone to ageneral practitioner or pediatrician:
“Never”(= 0),“one or two times”(= 1),“several times”(= 2),“regularly”(= 3). The variable was averaged over the 6 years. The same question was asked for visits to adentistand was coded in the same way. The same question was also asked for the following four specialties:
speech therapist,psychologist,psychiatristandspecial needs teacher. Few mothers reported that their child had consulted such specialists between 6 and 11 years; these 4 variables were thus recoded 1 when the mother ever reported that her child had consulted and 0 otherwise.
Child temperament, behaviors and emotions. At age 6 years, mothers rated the child’s
temperament with a French version of the Dimensions of Temperament Survey (DOTS) [37], with each item coded 0 for“rather false”and 1 for“rather true”. The original scale score was used for the first four dimensions:attention span(11 items, alpha: .80);adaptability(6 items, alpha: .67);rhythmicity(8 items, alpha: .70);reactivity(6 items, alpha: .59). Few children ob-tained a non-null score on theactivityscale (3 items) so we recoded it with 0 when only zero scores were reported and 1 when a non-null score was reported.
A different teacher each year rated behavioral characteristics of the child between ages 6 and 11 years, with the Social Behavior Questionnaire (SBQ [38]). Each item was rated on a three-point scale (0–2, from‘never applies’to‘frequently applies’). The five scores corresponding to the five behaviors were averaged between ages 6 and 11 years. Rated behaviors were: inatten-tion(4 items, alphas range: .85-.90),hyperactivity(2 items, alphas range: .83-.88),physical ag-gression(3 items, alphas range: .81-.86),opposition(5 items, alphas range: .79-.84),anxiety(5 items, alphas range: .70-.75). Mothers also rated behavioral characteristics of the child using the same SBQ items at the same ages. Rated behaviors were:inattention(alphas range: .70-.82),
hyperactivity(alphas range: .76-.79),physical aggression(alphas range: .57-.67),opposition (al-phas range: .62-.69),anxiety(alphas range: .60-.67).
Both mothers and teachers reported each year between the 1stand the 5thgrade if the child hadbehavioral or emotional difficultiesas well asrelational difficulties(yes = 1; no = 0). The four resulting variables were coded similarly: 1 when the informant answered yes at least once during the 5 years; 0 when the informant answered a no at least once but no yes. Mothers also answered a similar question regarding whether the child hademotional troublesduring the same period; this variable was coded in the same way. Mothers also rated from 1 (“very well”) to 5 (“not well at all”) how well the child wasgetting along with his/her familyfrom 7 to 11 years. The score was averaged across the 5 years.
Child academic background. Teachers rated child achievement each year from the age of
7 to 11 years (the kindergarten assessment was not available) with three questions on child’s performances inwriting,readingandmathematics. Each question was coded on a 5-point scale, from markedly below the mean (1) to markedly above the mean (5). Each of these 3 scores was averaged across the 5 years. Teachers also rated theglobal performanceof the child on the same 5-point scale. From the 2ndto the 5thgrade teachers reported grade retention. The
binary variable was coded 1 when any retention was reported between these grades. Both mothers and teachers rated each year between the 1stand the 5thgrade if the child was having
difficulties inacademic performance;motivation; and diligence(yes = 1; no = 0). The six result-ing variables were coded similarly: 1 when the informant answered yes at least once durresult-ing the 5 years; 0 when the informant answered‘no’at least once and never answered yes. Mothers rated from 1 (“likes a lot”) to 4 (“does not like at all”) if the childliked schoolat ages 10 and 11 years. The score was averaged across the 2 years. Mothers rated from 1 (“very well”) to 5 (“not well at all”) how well the child wasgetting along with his/her teacherfrom 7 to 11 years. The score was averaged across the 5 years.
birth, whether the child was hospitalized at age 7 or 8 years, the adaptation score of the afore-mentioned DOTS scale, and whether the child saw an occupational therapist or another doctor besides all the previously mentioned specialists.
Data analysis
Propensity score matching. We tested the bivariate relationships between each potential
confounder and maternal educational expectationsorhigh school graduation, (with logistic re-gressions). The aforementioned 54 variables were significantly associated (p<.05) with either
maternal educational expectations or high school graduation, or both, and were therefore re-tained to create the propensity score. Several matching options should be tested to find the one that best reduces the distance between the two groups [26,27]. We tested nearest neighbor and full matching because they use different algorithms to match participants.Nearest neighbor matching: for each participant in the exposed group, the participant with the closest propensity score (i.e. the smallest distance) is found in the control group. Several options can be used and combined including: 1) using several matched controls for every exposed participant; 2) exact matching for important categorical variables, leading for example to exactly the same propor-tion of children having grade retenpropor-tion between the two groups; 3) the Mahalanobis distance measure which enables closer matching for a small number of important continuous variables (e.g. maternal education); 4) matching with replacement i.e. a given control can be matched to several exposed participants; 5) a discard option for participants outside common support, i.e. the overlapping range of propensity scores between the two groups [26,27,32].Full matching
[39] is a technique which enables a flexible matching: within subclasses, an exposed participant can be matched with several controls but, also, several exposed participants can be matched with one control. Restrictions can be specified to avoid an excessive number of controls being matched with one exposed participant and vice versa. Although full matching can be used to keep all controls, it is also possible to specify how many controls should be kept in the match-ing procedure (e.g. use 2 participants with high expectations to match each participant with low expectations) and the aforementioned discard option is also available.
Assessing the balance between the two groups after matching can be achieved with the stan-dardized mean differences (also referred as“standardized bias”or“effect sizes”) for the pro-pensity score as well as for each of the confounders included in the model [27]. While recognizing that there is no consensus cut-off, some authors suggested using a standardized mean difference smaller than 0.05 after matching [40]. Other authors suggested to analyze standardized mean differences as effect sizes (i.e. 0.2 considered small, 0.5 medium and 0.8 large) and compare them before and after matching for all variables in order to assess the suc-cess of the matching procedure [41].
Multiple imputation. The percentage of missing data was less that 10.0% for most of the
60 potential confounders, with the following exceptions: physical abnormalities (13.1); intact family (14.2); incubator (14.4); birth weight (16.7); number of children in the family when the child was 9 years (49.9). Given the large number of potential confounding variables, an analysis restricted to complete cases would have yielded an important bias. We thus used multivariate imputation by chained equations and imputed 30 data sets [42,43]
Contributions of low maternal expectations to failure to graduate
Regression estimates. We present both odds ratios (ORs) and risk ratios (RRs) as
instance, when an outcome is rare, e.g. 1%, ORs and RRs agree; however, serious distortions start even at 10% [44]. ORs are thus a potential source of bias to estimate the effect of low ex-pectations on a common outcome such as graduation failure. Furthermore, contrary to RRs, ORs are not collapsible, meaning that the ORs will change even when adjusting for a variable that is not a confounder, complicating their interpretation [44].
To enable comparison with available literature, we present three sets of regression estimates of the contribution of low expectations to failure to graduate from high school:
1. Unadjusted estimates with no confounding variable;
2. Adjusted estimates, using a small set of important confounding variables. We selected a small set of variables that have been controlled for in most of the available studies (see intro-duction), regarding the family’s socioeconomic characteristics, the child’s previous achieve-ment and the child’s sex; we also added variables regarding family structure as well as the child’s inattention, which has been shown to be an important behavioral predictor of educa-tional outcomes [12,23,24]. Variables included in this second model are: income, maternal education, teacher rated global academic performance, grade retention, child’s sex, moving house, intact family, teacher rated inattention. These estimates were computed using the multiply-imputed data sets.
3. Fully adjusted estimates with all the variables included in the propensity score matching. These estimates were computed using the multiply-imputed data sets.
Propensity score matching estimates. Each matching procedure was repeated across the
30 imputed data sets and the one that best balanced the low and high expectation groups was retained. Then, the estimates of the contribution of low maternal educational expectations to high school graduation failure were combined across data sets [32,45,46]. Finally, in order to verify the robustness of the results, we conducted complementary analyses which are presented under the Complementary analyses heading in the Results section.
Analyses were conducted within the R software [47] using packagesmiceto generate imput-ed data sets [43],MatchItfor propensity score analyses [32], andZeligfor final model estima-tions using the imputed data sets [46].
Results
Propensity score matching
Table 2shows the means for each variable: (1) in the exposed group (low expectations), (2) in the control group before matching (high expectations) and (3) in the control group after matching (matched participants with high expectations); it also shows the standardized mean differences before and after matching. For instance, before matching, mothers in the low expec-tation group had 10.4 years of education in average, two years fewer than in the high expecta-tions group (12.5, for a standardized mean difference of−0.97); after matching, mothers of the
matched participants in the high expectations group also had an average education of 10.4 years (for a standardized mean difference of 0.00). Standardized mean differences between the two groups before matching were large (.80) for 12 variables including socioeconomic vari-ables, teacher rated school performance and teacher rated inattention. Most of the other differ-ences were medium (0.50) or small size (0.20). After matching, none of the standardized mean differences reached the small effect size threshold; absolute values were all between 0.00 and 0.17. Therefore, although some variables were above the more stringent 0.05 cut-off [40], the matching procedure considerably reduced the bias. Finally, the differences in empirical dis-tributions of variables in the two groups were greatly reduced after matching, in particular for important confounding variables identified in the literature (i.e. maternal education, teacher rated global academic performance and teacher rated inattention).
Effect of exposure to low maternal expectations on failure to graduate
Regression estimates. Table 3presents ORs and RRs for the unadjusted, adjusted and
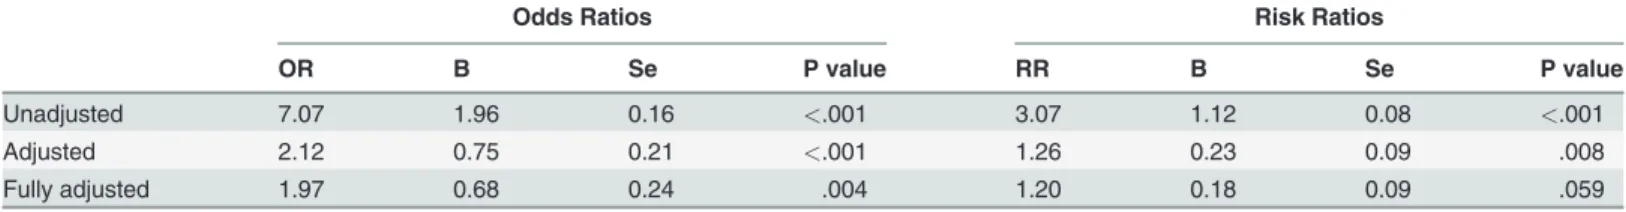
fully adjusted regression models. A total of 65.9% participants failed to graduate from high school by age 22–23 years in the low maternal expectations group against only 21.4% in the high expectation group, corresponding to an unadjusted RR of 3.07 (p<.001). Graduation
fail-ure was thus 3 times more frequent in the low expectation group. In the adjusted model includ-ing a restricted set of key confoundinclud-ing variables (income, maternal education, teacher rated global academic performance, grade retention, child’s sex, moving house, intact family, teacher rated inattention), the role of maternal expectations was greatly reduced but was still statistical-ly significant (RR: 1.26, p = .008). In the fulstatistical-ly adjusted model, the RR was further reduced and was only marginally significant (RR: 1.20, p = .059). The interaction between expectations and sex was positive and marginally significant in the unadjusted model; it was positive but not sta-tistically significant in the adjusted and fully adjusted models. Of note is that ORs not only were much larger than RR (e.g. unadjusted OR of 7.07 against RR of 3.07) but also led to a dif-ferent conclusion, as all ORs were statistically significant, including for the fully adjusted model (OR: 1.97, p = .004). Thus, the sole consideration of ORs resulting from multivariate
Table 3. Contribution of Maternal Low Expectations to Failure to Graduate from High-School in Multivariate Regression Models.
Odds Ratios Risk Ratios
OR B Se P value RR B Se P value
Unadjusted 7.07 1.96 0.16 <.001 3.07 1.12 0.08 <.001
Adjusted 2.12 0.75 0.21 <.001 1.26 0.23 0.09 .008
Fully adjusted 1.97 0.68 0.24 .004 1.20 0.18 0.09 .059
Note. The coefficients presented in thefirst four columns were obtained from logistic regressions: Odds Ratios (OR), estimate (B), standard error (Se), and p values. Poisson regressions with robust sandwich estimator of variance were used to obtain the estimates in the last four columns, including unadjusted and adjusted risk ratios (RR) [44]. OR and RR are exponential of their respective estimate (B). In the unadjusted model, no confounder was entered. In the adjusted model, 8 essential confounders were considered (seeMethodsection). In the fully adjusted model, all 56 variables were included as confounders.
regressions would be that low expectations make a highly statistically significant contribution to graduation failure.
Propensity score matching estimates. After matching, the risk ratio was further reduced
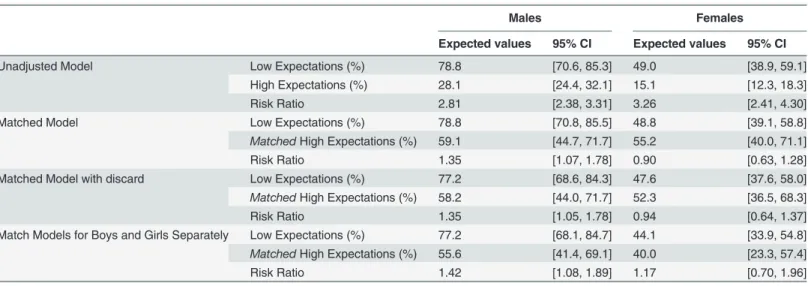
compared to the fully adjusted model and was not statistically significant, RR = 1.16, 95% CI [0.94, 1.44]. However, in the matching model, sex and low maternal expectations interacted positively and significantly (p = .023) in the prediction of graduation failure, so that the analy-ses must take this interaction into account. To visualize the interaction,Fig. 1presents the per-centage of participants failing to graduate from high-school according to sex and maternal expectation status, using both the unadjusted and the propensity score matching models. A large majority of males experiencing low maternal expectations failed to graduate (78.8%), much more than for males experiencing high maternal expectations (28.1%), with a difference of more than 50% between the two groups. However, after matching, the rate of failure in those participants with high maternal expectations who were matched to participants with low ma-ternal expectations was much higher (59.2%), showing that a large part but not all of the contri-bution of maternal expectations is due to confounding variables (seeFig. 1). For females, the difference between the two groups before matching was large (more than 30 percentage points) even though smaller than the difference for males. The difference was eliminated after match-ing, suggesting that the association of maternal expectations to graduation for females is entire-ly due to confounding variables.Table 4presents the expected percentages and risk ratios as well as 95% CIs. The Matched Model row indicates that the contribution of maternal expecta-tions after matching was still significant only for males.
Finally, regarding sex differences in maternal educational expectation levels, mothers had somewhat lower educational expectations for their boys (18.5% of low expectations) than for their girls (14.5%), although the difference was only marginally significant (χ2= 3.5, df = 1, p =
.06). Conversely, clearly more males than females were not high-school graduates at age 22–23 years (37.5% vs 20.0%,χ2= 47.0, df = 1, p<.001).
Fig 1. Predicted percentages of failure to graduate from high school according to sex and maternal expectations.
Complementary analyses
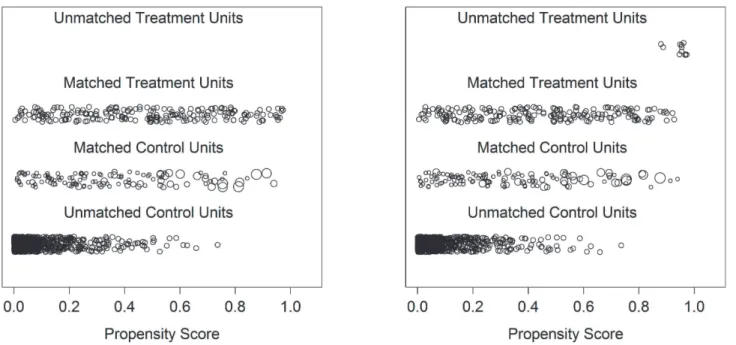
Discard option. As a complementary analysis, we tested the usefulness of discarding
par-ticipants in the high and in the low expectation group who are outside common support (i.e. the overlapping range of propensity scores between the two groups). When we used this op-tion, the distance was reduced from 0.037 to 0.021. The average number of controls used still remained 124 but, on average, 11 participants with low maternal expectations were discarded. The difference between the two procedures can be visualized inFig. 2. The fact that only 124 controls were matched from the large pool of potential control children and that some children exposed to low maternal expectations were out of common support demonstrates that there was only a restricted overlap between the two groups. Therefore, estimating the role of expecta-tions in children’s educational outcomes is subject to considerable selection bias. When we re-estimated the contribution of maternal expectations with the discard option, the interaction be-tween sex and expectations was still significant; the risk ratios for males and females were virtu-ally unchanged (seeTable 4).
Separate analyses for males and females. Because the matching was done on the whole
sample and not separately for males and females, it is possible that it was more efficient for one sex, thus introducing a bias in the results for the other one. We therefore re-run the last match-ing model (nearest neighbor with replacement and discard option) separately for males and fe-males and re-estimated the results. Again, the contribution of maternal expectations was statistically significant for males but not for females (seeTable 4).
Discussion
The aim of this study was to verify whether low maternal educational expectations when the child was 12 years had a plausible causal contribution to graduation failure in early adulthood. Using propensity score matching to reduce confounding, we found that the contribution of low maternal expectations was not significant when males and females were considered
Table 4. Risk Ratios and Expected Percentages of Graduation Failure According to Low/High Maternal Educational Expectations and Sex in Match Models.
Males Females
Expected values 95% CI Expected values 95% CI
Unadjusted Model Low Expectations (%) 78.8 [70.6, 85.3] 49.0 [38.9, 59.1]
High Expectations (%) 28.1 [24.4, 32.1] 15.1 [12.3, 18.3]
Risk Ratio 2.81 [2.38, 3.31] 3.26 [2.41, 4.30]
Matched Model Low Expectations (%) 78.8 [70.8, 85.5] 48.8 [39.1, 58.8]
MatchedHigh Expectations (%) 59.1 [44.7, 71.7] 55.2 [40.0, 71.1]
Risk Ratio 1.35 [1.07, 1.78] 0.90 [0.63, 1.28]
Matched Model with discard Low Expectations (%) 77.2 [68.6, 84.3] 47.6 [37.6, 58.0]
MatchedHigh Expectations (%) 58.2 [44.0, 71.7] 52.3 [36.5, 68.3]
Risk Ratio 1.35 [1.05, 1.78] 0.94 [0.64, 1.37]
Match Models for Boys and Girls Separately Low Expectations (%) 77.2 [68.1, 84.7] 44.1 [33.9, 54.8] MatchedHigh Expectations (%) 55.6 [41.4, 69.1] 40.0 [23.3, 57.4]
Risk Ratio 1.42 [1.08, 1.89] 1.17 [0.70, 1.96]
Note. The expected values–percentages and risk ratios–in each sub-group are obtained from logistic regressions with 10000 simulations using an asymptotic normal approximation [46]. Confidence intervals (95% CI) are provided.
together; when considered separately, its contribution was statistically significant for males but not females.
Whether educational expectations have a causal role in the prediction of educational attain-ment has been a central issue since the early literature on the topic [8]. Our results show that the strategy used in most of the available literature, i.e. adjusting for a restricted set of impor-tant confounding variables, does remove a large part of the bias but not all of it and, as such, may not accurately estimate the contribution of expectations to attainment. The results of this study are consistent with the possibility that extant research may have overestimated the tribution of parental expectations to educational attainment. Researchers might want to con-sider a wider range of potential confounding variables as well as use designs to strengthen causal inferences whenever possible. Reviews of these designs and statistical innovations are available elsewhere [10]. Each of these approaches has its strengths and limitations. For in-stance, although we included a large set of potential confounders, the existence of unobserved confounders is still possible (taking them into account would likely further reduce the role of maternal expectations). Therefore, although propensity score matching is utilized to minimize confounding it does not guarantee, by itself, a definitive evidence of the presence or the absence of a causal relationship. A comprehensive understanding of the causal role of parental expecta-tions will stem from a convergence of findings from studies using different techniques and de-signs. In particular, successfully manipulating maternal expectations is crucial. However, a direct manipulation of maternal expectations is not possible as they cannot be randomly as-signed to mothers. An alternative would be to: first, design an intervention that significantly impact maternal expectations; second, randomly assign mothers to the intervention and test whether the rise in maternal expectations translates into better educational outcomes; third,
Fig 2. Distributions of the propensity score.Treatment Units correspond to children with low maternal expectations whereas Control Units correspond to children with high maternal expectations. The left part of the figure shows the overlap between the Matched Treatment Units versus the Matched Control Units. The Unmatched Control Units correspond to children with high maternal expectations who were discarded from the analyses (note the high density of children with low propensity scores in this group, meaning that, given their characteristics, these children had a very low probability of having a mother with low expectations and thus represented poor matches). The right part of the figure represents the matching procedure when the discard Treatment Units option was used (seeDiscard option, in theComplementary analysessection): some Matched Treatment Units had a propensity score close to one, which made it hard to find equivalent Controls. As such, they were discarded in this complementary analysis and are plotted as Unmatched Treatment Units.
formally test whether maternal expectations mediate the impact of the intervention on educational outcomes.
It should be noted that our results do not necessarily apply to all contexts. Indeed, educa-tional expectations are highly sensitive to historical and social contexts, which may also be the case for their effect on educational attainment. For instance, the role of educational expecta-tions in the prediction of educational attainment seems to vary according to countries’ educa-tional system [34]. In addition, following the sharp increase in youth educational expectations between the 1970s and the 1990s, the strength of the prediction of educational attainment by youth expectations dropped by half [48]. Similarly, the predictive role of parental expectations may have lessened with time.
The role of sex
One of the most intriguing findings of this study was that maternal expectations made a statis-tically significant contribution for males but not for females when using propensity score matching. In this section, we discuss the relationships between sex, educational expectations and attainment.
The sex ratio for educational attainment has changed in favor of girls in recent decades [5]. The putative role of maternal expectations in explaining this difference between sexes in educa-tional attainment can be twofold: 1) a difference between sexes in the levels of maternal expec-tations; 2) a stronger contribution of maternal expectations to educational attainment for girls. In this study, boys were more likely to experience graduation failure, which is consistent with the trend observed in recent decades [5]. Moreover, low maternal expectations were more com-mon for boys but the difference was only marginally significant; this is in line with previous studies, which have reported no difference or higher parental expectations for females
[6,12,16,49]. Therefore, it is unlikely that the sex difference in attainment is due to different lev-els of maternal expectations between sexes in the present study. Maternal expectations could have contributed to explain sex differences in attainment in another way: a stronger contribu-tion of maternal expectacontribu-tions in females. However, after matching, maternal expectacontribu-tions made a significant statistical contribution to the failure to graduate from high school for males but not for females.
Very few studies have tested the interaction between sex and parental expectations in the prediction of educational attainment. In one study [29], parents’expectations in 8th grade were associated with students’own expectations in12th grade for boys more so than for girls. However, the same was not true for the contribution of parental expectations to achievement. Mello [28] reported that the association between youth occupational expectations at age 14 years and occupational attainment at 26 years was significantly higher for males than for fe-males. However, the effect size was small and the same was not true for the association between educational expectations and educational attainment. Methods used may partly explain these discrepancies. Of significance is that we detected the interaction between sex and maternal ex-pectations only when we used propensity score matching; the interaction term was also positive but not statistically significant in the unadjusted and the adjusted models. Another study also yielded similar findings with interactions being statistically significant only with the use of pro-pensity score matching [50]. This suggests that, in the presence of a strong selection bias, re-gression techniques may conceal group differences.
expectations of their peers are more elevated [51]. Therefore, the lack of an association between high school graduation and maternal educational expectations for girls may be related to the fact that they are exposed to other sources of influences on educational attainment, like peers or teachers. Conversely boys may be more sensitive to low maternal expectations in the absence of buffering processes at school.
Strengths and limitations
It should be noted that we used aspirations as a proxy of expectations. As discussed previously, both concepts have been shown to be highly correlated and have been used as proxies for one another [34]. However, other studies have reported some empirical differences between aspira-tions and expectaaspira-tions [9]. We were unable to verify to what extent both constructs differential-ly predict educational outcomes. However, we note that the item used in the present study was strongly predictive of the outcome when we controlled for a set of variables comparable to the one utilized in the literature. Therefore, the fact that no statistically significant contribution was detected when using propensity score matching (at least for girls) is unlikely due to the item we used. Our sample was fairly large but cannot be deemed as representative of the origi-nal population because of attrition, which is a common problem in long-term longitudiorigi-nal studies. Without attrition, our sample size could have been larger, in particular for the low ma-ternal expectation group, potentially increasing the possibility of detecting a significant role for maternal expectations. In addition, the propensity score matching procedure yielded a 1.16 risk ratio of graduation failure associated with low maternal expectations, which was not signif-icant. Similar or even lower risk ratios may be significant in larger samples, leading to a some-what different conclusion (i.e. low maternal expectations are significantly associated with a small increase in graduation failure).
Among the strengths of this study were the use of a long-term longitudinal design and mea-sures from different informants (mothers, teachers and administrative data). In addition, to the best of our knowledge, it is also the first time that propensity score matching is used to mini-mize confounding when assessing the effect of maternal expectations on
educational attainment.
Acknowledgments
We thank the participants, their families, and their teachers for their long–term commitment to this project; Charles-Édouard Giguère for statistical expertise; Hélène Beaumont, the many research assistants, and the Research Unit on Children’s Psychosocial Maladjustment staff for their assistance in data collection and administration of the project.
Author Contributions
Conceived and designed the experiments: FV RET. Performed the experiments: FV RET. Ana-lyzed the data: JBP AP SMC. Contributed reagents/materials/analysis tools: FV RET SMC. Wrote the paper: JBP SMC AP FV RET.
References
1. Alexander KL, Entwisle DR, Horsey CS (1997) From first grade forward: Early foundations of high school dropout. Sociol Educ 70: 87–107.
2. Entwisle DR, Alexander KL, Olson LS (2005) First grade and educational attainment by age 22: A new story. Am J Sociol 110: 1458–1502. doi:10.1086/428444
4. Ou S-R, Reynolds AJ (2008) Predictors of educational attainment in the Chicago longitudinal study. Sch Psychol Q 23: 199–229. doi:10.1037/1045-3830.23.2.199
5. Reynolds J, Burge SW (2008) Educational expectations and the rise in women’s post-secondary attain-ments. Soc Sci Res 37: 485–499. doi:10.1016/j.ssresearch.2007.09.002PMID:19069056
6. Rutchick AM, Smyth JM, Lopoo LM, Dusek JB (2009) Great expectations: The biasing effects of re-ported child behavior problems on educational expectancies and subsequent academic achievement. J Soc Clin Psychol 28: 392–413. doi:10.1521/jscp.2009.28.3.392
7. Zhan M, Sherraden M (2003) Assets, expectations, and children’s educational achievement in female-headed households. Soc Serv Rev 77: 191–211. doi:10.1086/373905
8. Bozick R, Alexander K, Entwisle D, Dauber S, Kerr K (2010) Framing the future: Revisiting the place of educational expectations in status attainment. Social Forces 88: 2027–2052.
9. Goldenberg C, Gallimore R, Reese L, Garnier H (2001) Cause or effect? A longitudinal study of immi-grant latino parents’aspirations and expectations, and their children’s school performance. Am Educ Res J 38: 547–582. doi:10.3102/00028312038003547
10. Jaffee SR, Strait LB, Odgers CL (2012) From correlates to causes: Can quasi-experimental studies and statistical innovations bring us closer to identifying the causes of antisocial behavior? Psychol Bull 138: 272–295. doi:10.1037/a0026020PMID:22023141
11. Imai K, King G, Stuart EA (2008) Misunderstandings between experimentalists and observationalists about causal inference. J R Stat Soc Series A 171: 481–502. doi:10.1111/j.1467-985X.2007.00527.x. 12. De Civita M, Pagani L, Vitaro F, Tremblay RE (2004) The role of maternal educational aspirations in
mediating the risk of income source on academic failure in children from persistently poor families. Child Youth Serv Rev 26: 749–769.
13. Englund MM, Luckner AE, Whaley GJL, Egeland B (2004) Children’s achievement in early elementary school: Longitudinal effects of parental involvement, expectations, and quality of assistance. J Educ Psychol 96: 723–730. doi:10.1037/0022-0663.96.4.723
14. Pagani LS, Vitaro F, Tremblay RE, McDuff P, Japel C, Larose S. (2008) When predictions fail: The case of unexpected pathways toward high school dropout. J Soc Issues 64: 175–194. doi:10.1111/j. 1540-4560.2008.00554.x
15. Dubow EF, Boxer P, Huesmann LR (2009) Long-term effects of parents’education on children’s educa-tional and occupaeduca-tional success: Mediation by family interactions, child aggression, and teenage aspi-rations. Merrill Palmer Q (Wayne State Univ Press) 55: 224–249. doi:10.1353/mpq.0.0030PMID: 20390050
16. Gill S, Reynolds AJ (1999) Educational expectations and school achievement of urban African Ameri-can children. J School Psychol 37: 403–424. doi:10.1016/S0022-4405(99)00027-8
17. Jacobs N, Harvey D (2005) Do parents make a difference to children’s academic achievement? Differ-ences between parents of higher and lower achieving students. Educ Stud 31: 431–448. doi:10.1080/ 03055690500415746
18. Pirog MA, Magee C (1997) High school completion: The influence of schools, families, and adolescent parenting. Soc Sci Q 78: 710–724.
19. Wojtkiewicz RA (1993) Simplicity and complexity in the effects of parental structure on high school graduation. Demography 30: 701–717. PMID:8262288
20. Vitaro F, Brendgen M, Larose S, Tremblay RE (2005) Kindergarten disruptive behaviors, protective fac-tors, and educational achievement by early adulthood. J Educ Psychol 97: 617–629. doi:10.1037/ 0022-0663.97.4.617
21. Duncan GJ, Dowsett CJ, Claessens A, Magnuson K, Huston AC, Klebanov P, et al. (2007) School readiness and later achievement. Dev Psychol 43: 1428–1446. doi:10.1037/0012-1649.43.6.1428 PMID:18020822
22. Vitaro F, Larocque D, Janosz M, Tremblay RE (2001) Negative social experiences and dropping out of school. Educ Psychol 21: 401–415. doi:10.1080/01443410120090795
23. Pingault J-B, Tremblay RE, Vitaro F, Carbonneau R, Genolini C, Falissard B, et al. (2011) Childhood trajectories of inattention and hyperactivity and prediction of educational attainment in early adulthood: A 16-year longitudinal population-based study. Am J Psychiatry 168: 1164–1170. doi:10.1176/appi. ajp.2011.10121732PMID:21799065
24. Polderman TJC, Boomsma DI, Bartels M, Verhulst FC, Huizink AC (2010) A systematic review of pro-spective studies on attention problems and academic achievement. Acta Psychiatr Scand 122: 271– 284. doi:10.1111/j.1600-0447.2010.01568.xPMID:20491715
26. Ho DE, Imai K, King G, Stuart EA (2007) Matching as nonparametric preprocessing for reducing model dependence in parametric causal inference. Polit Analysis 15: 199–236. doi:10.1093/pan/mpl013 27. Stuart EA (2010) Matching methods for causal inference: A review and a look forward. Stat Sci 25: 1–
21. doi:10.1214/09-STS313PMID:20871802
28. Mello ZR (2008) Gender variation in developmental trajectories of educational and occupational expec-tations and attainment from adolescence to adulthood. Dev Psychol 44: 1069–1080. doi:10.1037/ 0012-1649.44.4.1069PMID:18605835
29. Zhang Y, Haddad E, Torres B, Chen C (2011) The reciprocal relationships among parents’ expecta-tions, adolescents’expectations, and adolescents’achievement: a two-wave longitudinal analysis of the NELS data. J Youth Adolesc 40: 479–489. doi:10.1007/s10964-010-9568-8PMID:20628796 30. Rouquette A, Côté SM, Pryor LE, Carbonneau R, Vitaro F, Tremblay RE (2014) Cohort profile: the
Que-bec Longitudinal Study of Kindergarten Children (QLSKC). Int J Epidemiol 43: 23–33. doi:10.1093/ije/ dys177PMID:23159828
31. Lu B, Greevy R, Xu X, Beck C (2011) Optimal Nonbipartite Matching and its statistical applications. Am Stat 65: 21–30. doi:10.1198/tast.2011.08294PMID:23175567
32. Ho DE, Imai K, King G, Stuart EA (2011) MatchIt: Nonparametric preprocessing for parametric causal inference. J Stat Softw 42: 1–28.
33. Beal SJ, Crockett LJ (2010) Adolescents’occupational and educational aspirations and expectations: Links to high school activities and adult educational attainment. Dev Psychol 46: 258–265. doi:10. 1037/a0017416PMID:20053022
34. Buchmann C, Dalton B (2002) Interpersonal influences and educational aspirations in 12 countries: The importance of institutional context. Sociol Educ 75: 99–122.
35. Blishen BR, Carroll WK, Moore C (1987) The 1982 socioeconomic index for occupations in Canada. Can Rev Soc Anthrop 24: 465–488.
36. Falender CA, Mehrabian A (1980) The emotional climate for children as inferred from parental attitudes: A preliminary validation of three scales. Educ Psychol Meas 40: 1033–1042.
37. Lerner RM, Palermo M, Spiro A III, Nesselroade JR (1982) Assessing the dimensions of temperamental individuality across the life span: The dimensions of temperament survey (DOTS). Child Dev 53: 149– 159.
38. Tremblay RE, Loeber R, Gagnon C, Charlebois P, Larivée S, LeBlanc M (1991) Disruptive boys with stable and unstable high fighting behavior patterns during junior elementary school. J Abnorm Child Psychol 19: 285–300. PMID:1865046
39. Stuart EA, Green KM (2008) Using full matching to estimate causal effects in nonexperimental studies: Examining the relationship between adolescent marijuana use and adult outcomes. Dev Psychol 44: 395–406. doi:10.1037/0012-1649.44.2.395PMID:18331131
40. Caliendo M, Kopeinig S (2008) Some practical guidance for the implementation of propensity score matching. J Econ Surv 22: 31–72. doi:10.1111/j.1467-6419.2007.00527.x
41. McCaffrey DF, Ridgeway G, Morral AR (2004) Propensity score estimation with boosted regression for evaluating causal effects in observational studies. Psychol Methods 9: 403–425. doi: 10.1037/1082-989X.9.4.403PMID:15598095
42. Van Buuren S, Brand JPL, Groothuis-Oudshoorn CGM, Rubin DB (2006) Fully conditional specification in multivariate imputation. J Stat Comput Simul 76: 1049–1064. doi:10.1080/10629360600810434 43. Van Buuren S, Groothuis-Oudshoorn K (2011) mice: Multivariate Imputation by Chained Equations in
R. J Stat Softw 45: 1–67.
44. Cummings P (2009) The relative merits of risk ratios and odds ratios. Arch Pediatr Adolesc Med 163: 438–445. doi:10.1001/archpediatrics.2009.31PMID:19414690
45. Imai K, King G, Lau O (2008) Toward a common framework for statistical analysis and development. J Comput Graph Stat 17: 892–913. doi:10.1198/106186008X384898
46. Imai K, King G, Lau O (2007) Zelig: Everyone’s statistical software. Available:http://GKing.harvard. edu/zelig.
47. R Development Core Team (2013) R: A language and environment for statistical computing. Vienna, Austria: R Foundation for Statistical Computing. Available:http://www.R-project.org.
48. Reynolds J, Stewart M, Macdonald R, Sischo L (2006) Have adolescents become too ambitious? High school seniors’educational and occupational plans, 1976 to 2000. Soc Probl 53: 186–206. doi:10. 1525/sp.2006.53.2.186
50. Côté SM, Doyle O, Petitclerc A, Timmins L (2013) Child care in infancy and cognitive performance until middle childhood in the millennium cohort study. Child Dev 84: 1191–1208. doi:10.1111/cdev.12049 PMID:23331073