THE EVOLUTION OF REGIONAL DISPARITIES IN THE RURAL
AREAS OF MUSCELELE ARGE
Ş
ULUI
C
Ă
T
Ă
LINA CÂRSTEA
1ABSTRACT - Regional disparities are clearly a significant challenge to the new European
construction. Disparities are often sources of instability but are also sources of antagonism and unrest. In the case of Muscelele Argeşului, in the past, it was a unitary area in terms of economic and social
development, the two Middle Ages royal capitals keeping the balance of this area. After the 50s, the situation changed radically and the uneven development of the towns and villages began to widen. Some villages were collectivized; others were industrialized, while a third category was simply omitted from the development plans. As a consequence, development disparities evolved and became common during the 80s. After 1992, around the towns of Curtea de Argeş and Câmpulung, two relatively more
developed regions emerged, while regions in the north and central part of the area were disadvantaged. Beginning with 2002, we are witnessing a reduction of disparities because the underdeveloped areas are increasing and incorporate previously developed areas. The area is starting to become a huge underdeveloped area and some of the main factors that led to this situation are the decay of the two poles of regional development and the closing of the coal mines. Today, the entire area is experiencing a rebirth and the entrepreneurial activities are playing an important role. The huge number of small hotels and accommodation establishments constructed in the west part of the area in the last five years, coupled with several investment projects in Curtea de Argeş, has led to the increased regional
importance of the town to the expense of Câmpulung. In the meantime, former mining centres that where the engines of growth for the region became rather underdeveloped. The main cause of this is the fact that the region does not have perspectives and lacks the much needed entrepreneurial activities.
Keywords: rural area, local disparities, underdeveloped areas, disadvantaged areas, entrepreneurial
activities
INTRODUCTION
One of the most important issues when talking about sustainable development is the equitable development of every human locality and the provision of the premises for the development of the entire population of a state or of a country. We must not forget either about the gaps that can exist at intraregional or inter-local level that can produce disparities within an apparently uniform space.
The inequality of spatial development can express the inequality between the social relations in the different socio-professional and economic categories, representing especially the result of the dysfunctions of the economic and social structures (Ianoş I., 2008). The numerous economic
dysfunctions in the region of Muscelele Argeşului have caused a series of disparities at inter-local
level, enlarging the gaps between the localities of this region.
The thing that triggered the inter-local unbalance, in a region known for its equilibrium, was the insertion of economic units between 1970 and 1980. This triggered a series of chain reactions that led in time to the formation of privileged and underprivileged areas within a pretty confined space.
The area taken into consideration encompasses 30 villages and 2 municipalities and also the villages whose administrative territory dose not perfectly overlap the physico-geographical limit of Muscelele Argeşului. The presence of the two municipalities has led to a certain hierarchization within
the region, their role as regional centres of economic growth being more obvious lately as they play an essential part in reducing the territorial tensions in the entire Argeş County.
DATA BASE AND METHODOLOGY
The analysis of the territorial disparities was made according to statistical indicators, differently selected for individualization and for analysis. The first category includes specially selected indicators, in accordance with the purpose of the action in order to better reveal the territorial reality. The second category of indicators was the support indicators in order to reveal in detail the dominant factors of the territorial disparities.
The indicator system used to identify the territorial disparities has four classes: the demographic state, the economic state, the infrastructure and the standard of life. Each category is considered to influence the development equally.
The demographic state was considered according to three indicators: the depopulation intensity, the percentage of the population over 60 years old and the vitality index, as the report between the total population and the population with a fixed address. The economic state was considered based on four indicators: the economic dependency, the unemployment rate within the active population, the ratio of the occupied population to the active population, the ratio of the population working in agriculture to the total active population. Infrastructure, an indispensable element for development, was analyzed based on a complete set of indicators that comprise: the living space per capita, the number of telephones per 1000 inhabitants, and also the length of the water supply and sanitation systems. The standard of life was quantified using a set of indicators that directly or indirectly detect the quality of life: the ratio of the population working in agriculture to the total active population, the net migration, the ratio of the population that completed secondary education in the total population. After the analysis of a series of data found in the statistic sheets of the villages under analysis for the time interval 1992-2002, the Statistical Yearbook of Argeş County (1992, 2002,
2008), the 1992 and 2002 Censuses of Population and Dwellings, and the Register of Companies, graphic materials were made for each group of indicators.
Depending on the resulted values, the human development index (HDI) was calculated as a Hull score, with value variations between 0 and 100. For the calculation, the indicators with direct influence were considered positive in the determination process while the ones with reverse influence were considered negative.
The hierarchization of the 30 villages revealed several limits more or less relevant, according to which 5 value classes were considered.
Due to the lack of certain support indicators such as the economic dependency ratio, the demographic dependency ratio, the percentage of the population under 60 years old, the percentage of the population that completed secondary education, in 2008, other indicators such as the number of PC/1000 inhabitants and the number of firms/1000 inhabitants were introduced.
In order to correlate the statistic data with the territorial reality, a series of direct observations were made on the field.
THE EVOLUTION OF THE ECONOMIC FACTORS AS PREMISE FOR THE EMERGENCE OF DISPARITIES
The area taken into consideration has suffered major changes ever since the past. From an economic point of view, in these villages there was a certain degree of uniformity during the interwar period. The writings of that time remind us of the prosperity of the locals that worked in fruit growing and sheepherding, of the way the dwellings have evolved becoming bigger and more durable.
After the 1950s, things changed radically and the unequal development between these villages deepened. A part of these villages underwent the process of “cooperativization”, in others industrial units emerged, while others are omitted from the development plans.
Aninoasa, Lereşti, Dragoslavele, Berevoieşti, Valea Mare Pravăţ, Nucşoara are villages that
became the focus of the 1970s development plan. Out of the desire to equally develop this region, mines were opened to exploit the coal deposits in Schitu Goleşti, Berevoieşti and Aninoasa, quarries
were opened for the exploitation of stone and limestone in Albeştii de Muscel and Valea Mare Pravăţ,
also to a general wellbeing of the locals. Therefore, the infrastructure in these villages, roads, water supply network, schools, high schools, dispensaries developed more quickly.
After 1989, this region was confronted with a series of problems due to the exhaustion of the existent resources, which led to the closing of the coal mines but also to the reduction of the limestone exploitation. Instead, the lack of investment in the industrial area led to the decay of the two economic growth poles in the region: Câmpulung and Curtea de Argeş. The bankruptcy of certain industrial units
such as ARO Câmpulung or the restructuring of others such as the Porcelain Fabric caused very serious phenomena such as the rise in unemployment among the regular travellers and the rise of the migration rate, especially the migration of the young population towards other areas of the country or abroad. Also, part of the dismissed rural population re-orientated towards the agricultural sector, where they practice subsistence agriculture.
The negative elements led, in 2005, to the designation of 21 localities as under-privileged rural areas. Consequently, these localities joined programs of fiscal facilities and regional development. Due to the closure of their industrial objectives, Aninoasa, Berevoieşti, Dragoslavele, and Stoieneşti
were included in the category of under-privileged localities.
Separately from the measures took at regional level, the local councils took a series of measures such as granting indemnities, tax deductions, granting irredeemable funds. However, the fiscal facilities did not attract too many investors, and the entrepreneurial sector is still poorly developed, although in the last few years a growth of this sector can be noticed.
In order to attract more investors, starting with 2004, the local councils began to invest in infrastructure, according to the development plan of Consiliul Judeţean Argeş (Argeş County Council)
for the period 2008-2012. Today, things are approximately the same. Many projects are blocked due to lack of funding. However, there are villages where projects are totally or partially finalized like in Dragoslavele, Lereşti, Domneşti, Valea Iaşului, Cicăneşti, Aninoasa, Brăduleţ, and Berevoieşti. These
villages focused on a complete development of infrastructure, aiming all aspects: sewerage system, water, gas, public illumination and modernization of the education, cultural and social units.
The adopted measures shortly drew investors and led to the growth of the entrepreneurial sector. The economic activities began to diversify due to the fact that in the interval 1992-2002, the entrepreneurial initiatives were limited to the opening of retail commerce units in non-specialized stores that sold mostly food, beverages, and tobacco.
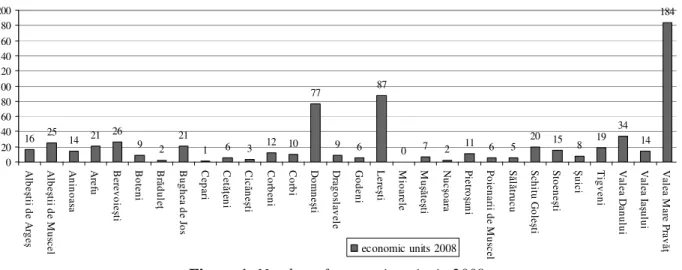
For the period 2002-2008, the trend of opening retail commerce units continued, their number becoming dominant among the SMEs (small and medium enterprises). In addition, a series of enterprises specialized in distribution and commerce, tourism, transport, food industry, wood processing, leather goods, textile industry and plastic mass processing were opened. These units led to the creation of jobs in the region but not enough to cover the deficit.
Out of the 670 commercial units in 2008 (Figure 1), approximately half of them were owned by three villages (Domneşti 11.5%, Lereşti 13%, Valea Mare Pravăţ 28%). The other 48% of firms were
divided among the 27 localities. Moreover, most of the firms were small enterprises with less than 10 employees. Only 6.4% had more than 10 employees. The percentage of medium firms with more than 50 employees was even smaller, only 1.2%, while there were only four large firms with more than 100 employees (Fuchs – Domneşti, Amplast – Lereşti, SILDVB – Berevoieşti, Marco Polo – Valea Mare
Pravăţ).
Another area that enjoyed a lot of attention was that of tourism. After 2005, the number of guest houses, especially the agritourist ones, increased suddenly from 2 to 65 at present. Most of the guest houses are in the category authorized natural person (ANP) and are not included in the SMEs category. They belong to the locals that saw in tourism a potential source of income due to the numerous tourist attractions, but also due to tourism projects such as Iezer – Portăreasa ski slope. The
65 guest houses are not distributed equally in the territory. They are located in 18 of the localities, Arefu and Corbeni owning half of them.
Private initiatives led to the transformation of Domneşti village into a local development
As a consequence of the successful privatizations and the appearance of new enterprises in the services area, constructions, food industry (Dr. Oetker and Transpacom), wood processing and furniture (Stecoplastrat), after 2002, the partial rehabilitation of the two economic growth poles also plays a major role in the economic evolution.
The extension of the economic influence of the two municipalities brought about the development of the localities in the close proximity leading to the enlargement of the gaps in the area.
16 25 14 21 26 9 2
21
1 6 3 12 10
77
9 6
87
0 7 2 11 6 5
20 15 8 19 34 14 184 0 20 40 60 80 100 120 140 160 180 200 A lb e ş tii d e A rg e ş A lb e ş tii d e M us ce l A ni no as a A re fu B ere vo ie ş ti B ot en i B r ă du le ţ B ug he a d e J os C ep ari C et ă ţ en i C ic ă ne ş ti C or be ni C or bi D om ne ş ti D ra go sla ve le G od en i L ere ş ti M io are le M u şă te ş ti N uc ş oa ra Pi etr o ş an i Po ie na rii d e M us ce l S ă l ă tru cu Sc hi tu G ol e ş ti St oe ne ş ti Ş ui ci T ig ve ni V ale a D an ul ui V ale a I a ş ul ui V ale a M are P ra v ă ţ
economic units 2008
Figure 1.Number of economic units in 2008
ANALYSIS OF THE SUPPORT INDICATORS AND THE OUTLINING OF THE PRIVILEGED AND UNDERPRIVILEGED AREAS
In order to establish the privileged and underprivileged areas in a region, a very careful and detailed analysis is required, one that includes various indicators which better characterize the socio-economic areas: economy, human potential, infrastructure, standard of life.
The analysis of the demographic state reveals that the region faces deep problems such as the
high degree of population ageing, with a major decline in the total population and the growth of the demographic dependency rate. At an individual level, there are a series of discrepancies; some of the localities are more or less affected by these phenomena.
The ageing process (quantified by the percentage of the population over 60 years old), for example in 1992, it seriously affected the villages of Nucşoara (49%), Brăduleţ (30.1%), Muşeteşti
(26.5%), Suici (22.76%), Tigveni (21.19%), and Boteni (25.10%). At the opposite side were villages such as Valea Mare Pravăţ, Albeştii de Argeş, Bughea de Jos, Corbeni, where the recorded values ranged
between 14 and 16%. These values were higher than the national average, where the percentage of the population over 60 years old was 13.3%, and higher than the average of Argeş County (13%).
In 2002, the situation changed. There was an increase in the population ageing process, the villages Brăduleţ (33.54%), Boteni (26.32%), Muşeteşti (31.4%) recorded higher values, on average
with an extra 2-3%. In other localities, the percentage of the population over 60 years old increased more, with approximately 6-8%, from 17.4 to 24.5% in Arefu village, from 14.64% to 18.32% in Schitu Goleşti village, from 20.4 to 26.31 in Cepari village. The maximum values were almost double
than the national average (19.8%) and the Argeş County average (15.18%) and the minimum values fit
into overall national average. Although values followed the national trend, the difference was too great and this reflected in the region’s economy.
In 2008, the phenomenon was probably more striking because the percentage of population over 60 increased to 19.8%, both values being higher than those in the Southeast Region of Wallachia (17%) and the national average (20%).
pensioners chose to live in the rural environment and to work in agriculture, process reflected also by the depopulation index.
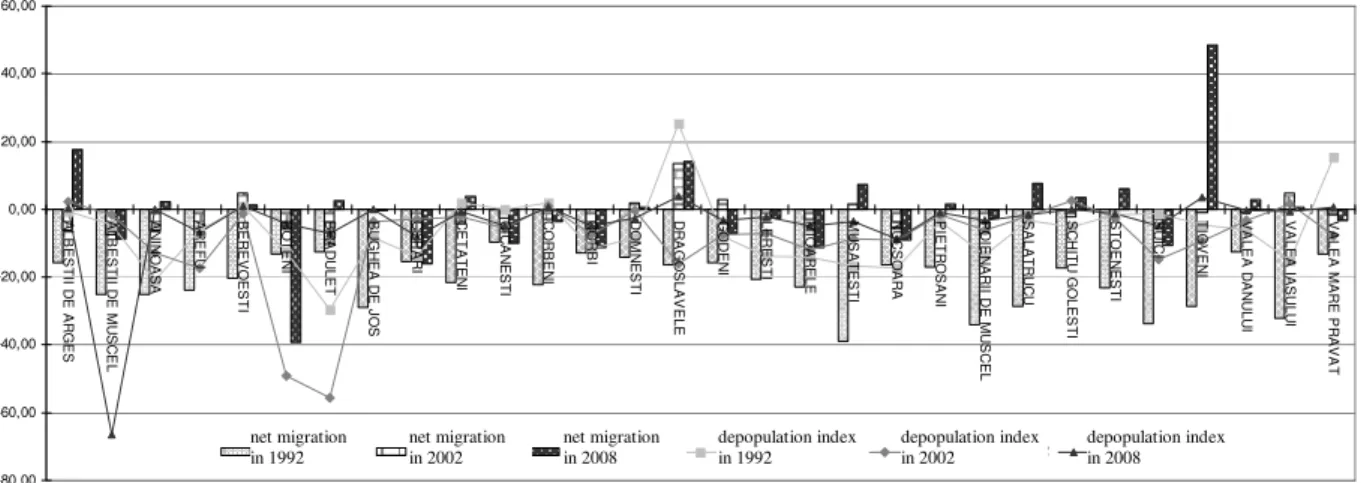
In the period 1992-2002, there is a strong and continuous depopulation (Figure 2), the most affected localities being Boteni (from -12.69% to -49.04%), Brăduleţ (from -29.5% to -55.48%) and
Dragoslavele (+25.20% to -16.04%). Although the general trend was of depopulation, the other villages generally recorded decreases in the value of this indicator from -0.75% to 2.16% in Albeştii
de Argeş, from -13.91% to 2.89% in Cepari, and from -15.2% to +1.72% in Valea Iaşului.
After 2002, in the interval 2002-2008, this phenomenon diminished as a consequence of the decrease in migration and the economic stabilization. Out of 31 localities, 17 had values below 7%, and in 10 localities there was an opposite phenomenon, with an increase in population between 0.5 and 4%. The villages that recorded rises in the population are the ones around the two municipalities. A particular case is the one of Albeştii de Muscel where the values of the depopulation index reached
60%. The reason is purely administrative, because, in 2005, the village of Bughea de Sus gained an independent administration status.
-80,00 -60,00 -40,00 -20,00 0,00 20,00 40,00 60,00 A L B E S T II D E A R G E S A L B E S T II D E M U S C E L A N IN O A S A A R E F U B E R E V O E S T I B O T E N I B R A D U L E T B U G H E A D E J O S C E P A R I C E T A T E N I C IC A N E S T I C O R B E N I C O R B I D O M N E S T I D R A G O S L A V E L E G O D E N I L E R E S T I M IO A R E L E M U S A T E S T I N U C S O A R A P IE T R O S A N I P O IE N A R II D E M U S C E L S A L A T R U C U S C H IT U G O L E S T I S T O E N E S T I S U IC I T IG V E N I V A L E A D A N U L U I V A L E A IA S U L U I V A L E A M A R E P R A V A T
migratia neta 1992 migratia neta'2002 migratie neta 2008 ind de depopulare 1992 ind de depopulare 2002 ind de depopulare 2008
Figure 2.Evolution of the depopulation intensity and the net migration between 1992 and 2008
The high percentage of the population over 60 years old, associated with the large migration of the young population to the city, generated a rise in the demographic dependency rate in the region, in the period 1992-2002, the average value rising from 70% to 73%. The most affected villages were Albeştii de Argeş (from 60.4% to 90.06%), Arefu (from 60.55% to 75.22%), Brăduleţ (from 76.4% to
92.56%). Although the general trend was that of the rise in the demographic dependency rate, especially in the central part of the region between the two local development poles, there were villages where this value dropped, for example in Sălătrucu (from 63.9% to 58.7%) or in Bughea de
Jos, where it dropped from 75.31% to 63.69%.
The correlated analysis of the presented indicators revealed two profoundly underprivileged areas from a demographic point of view, one in the northern part of the region and another in the central part, between the two growth poles.
The synthesis on the economic state of Muscelele Argeşului, based on the previously
mentioned indicators for the interval 1992-2002, reveals the presence of 21 villages that can be considered as deeply underprivileged areas, with a high unemployment rate, a low rate of occupation of the population and a high dependency rate.
At first, the localities most affected by these phenomena were those in the central and northern area but, in 2002, things completely shifted. The most affected villages were those in the proximity of the cities Câmpulung and Curtea de Argeş and in those cities where interventions were made during
the period of forced industrialization, as a consequence of the rise in unemployment. Therefore, in the villages Aninoasa, Stoeneşti, Berevoieşti, Albeştii de Muscel, Corbeni, and Tigveni, the economic
dependency rate increased on average by 2%.
net migration
The above-mentioned localities were also confronted with the highest percentages of unemployment after 1992. Thus, between the two census years, the unemployment percentage in the total active population increased in Berevoieşti (from 7.79% to 39%), Albeştii de Muscel (from
11.06% to 26.65%), Cetăţeni (from 9.64% to 22.92%), Poienarii de Muscel (from 7.75% to 22.03%),
Lereşti (from 3.79% to 10.10%) and Valea Mare Pravăţ (from 7.24% to 22.45%).
The rise in unemployment and the massive dismissals led to the reorientation of population towards the agricultural sector, the number of the population occupied in agriculture increasing by on average 10% between the two census years. The highest increases were recorded in Albeştii de Argeş
(from 15.55% to 36.337%); Cetăţeni (from 16.25% to 37.8%), Dragoslavele (from 10.62% to 31.6%),
Mioarele (from 29% to 56.46%), Muşeteşti (from 36.41% to 60.48%), Schitu Goleşti (from 4.54% to
24.27%).
After 2002, there was an economic recovery due to the entrepreneurial initiative that depended both on the existing resources and on the retail markets. The percentage of firms/1000 inhabitants is still low, ranging between 0 and 42.15 firms/1000 inhabitants. Such initiatives led to the development of a local growth centre in the area, more precisely the Domneşti locality (23.85 firms/1000
inhabitants), and also to a stronger economic development of the villages found outside the area of influence of the two municipalities: Albeştii de Muscel (16.46 firms/1000 inhabitans), Lereşti (17.76
firms/1000 inhabitants), Valea Mare Pravăţ (42.15 firms/1000 inhabitants).
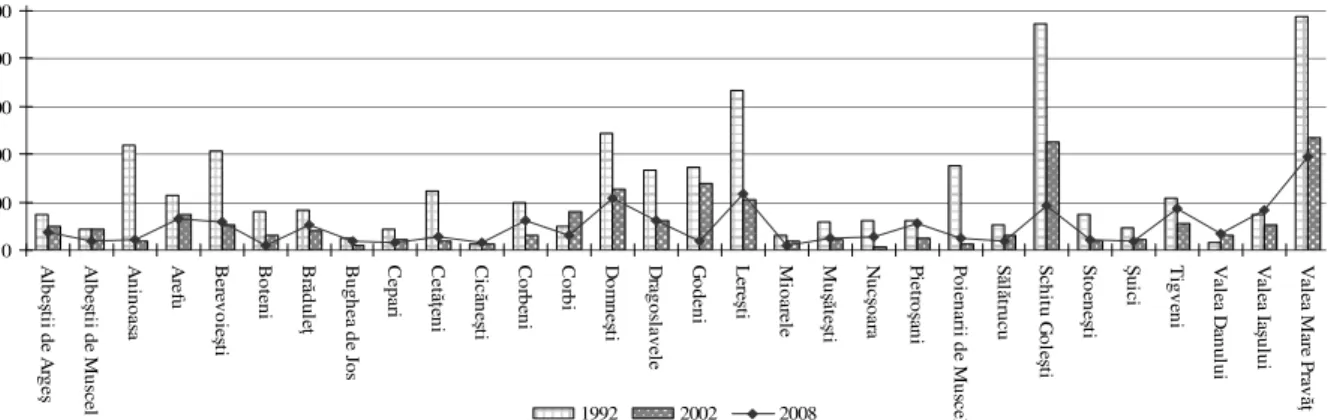
The development of the SMEs and ANPs led to the increase in the employee number (Figure 3), but still their number continues to be lower than in 1992. The reasons are, on the one hand, the growth of the number of pensioners and the decrease in the active population and, on the other hand, the possible increasing of the undeclared work force, as in the case of the day labourers.
0 500 1000 1500 2000 2500 A lb e ş tii d e A rg e ş A lb e ş tii d e M us ce l A ni no as a A re fu B ere vo ie ş ti B ot en i B r ă du le ţ B ug he a d e J os C ep ari C et ă ţ en i C ic ă ne ş ti C or be ni C or bi D om ne ş ti D ra go sla ve le G od en i L ere ş ti M io are le M u şă te ş ti N uc ş oa ra Pi etr o ş an i Po ie na rii d e M us ce l S ă l ă tru cu Sc hi tu G ol e ş ti St oe ne ş ti Ş ui ci T ig ve ni V ale a D an ul ui V ale a I a ş ul ui V ale a M are P ra v ă ţ
1992 2002 2008
Figure 3. Evolution in the number of employees between 1992 and 2008
A far as infrastructure is concerned, the area Tigveni – Suici – Sălătrucu and Aninoasa - Corbi
– Nucşoara stands out as a profoundly underprivileged area plus the south-eastern part of the area for
both census years. The main role in the transformation of these areas was played by the insufficient development of the water supply system, natural gas system and sewage system, correlated with the lack of a modern local road infrastructure and the lack of transversal lanes, with the exception of DN70 and E70C. After 2002, there was an improvement in infrastructure so that, in 2008, two underprivileged areas stood out: Muşeteşti –Corbi-Nucşoara and Arefu – Cicăneşti -Valea Danului.
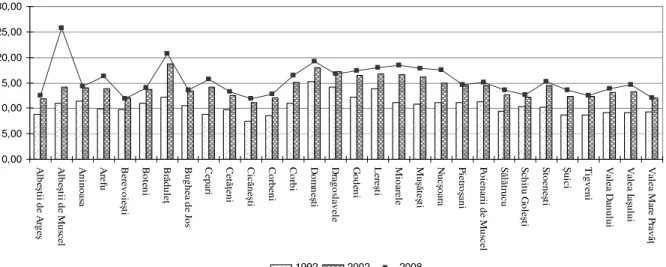
The disparities started to be more obvious, so that, if in 1992 only a few villages had water supply and sewerage, in 2008, 13 villages were connected to the water supply network, with a density of over 20 km/km², 12 villages did not even have 1m finalized and only three villages were connected to the sewerage system.
Also, in 2008, Valea Iaşului became the first village of the region with natural gas supply.
house was built, but transformed into the summer kitchen, thus probably contributing to the increase of this indicator.
0,00 5,00 10,00 15,00 20,00 25,00 30,00 A lb e ş tii d e A rg e ş A lb e ş tii d e M u sc el A ni no as a A re fu B ere vo ie ş ti B ot en i B r ă du le ţ B ug he a d e J os C ep ari C et ă ţ en i C ic ă ne ş ti C or be ni C or bi D om n e ş ti D ra go sla ve le G od en i L ere ş ti M io are le M u şă te ş ti N uc ş oa ra P ie tro ş an i P oi en ari i d e M us ce l S ă l ă tru cu S ch itu G ol e ş ti S to en e ş ti Ş ui ci T ig ve n i V ale a D an ul ui V ale a I a ş ul ui V ale a M are P ra v ă ţ
1992 2002 2008
Figure 4.Evolution of the living space per capita in 1992, 2002 and 2008
The analysis of the life standard indicators has led to the formation of two underprivileged
areas around the two urban centres during all the three years taken into account. A very important role was played by the percentage of the population over 10 years old that completed secondary education and the number of pharmacies and doctors to 1000 inhabitants. The existence of high schools only in the two urban centres led to an increase in the school abandonment rate, which was inversely proportional to the distance that had to be walked. Moreover, after 1992 many dispensaries were closed due to the lack of medical personnel. In 2008, only 8 villages had pharmacies, their percentage being of 0.32/1000 inhabitants and 14 villages had hospitals and dental offices, the average percentage being 0.42 medical and dental cabinets/1000 inhabitants. All these units were concentrated in the villages north of Câmpulung and in the proximity of the town of Curtea de Argeş, the only exception
being the village of Domneşti.
Another relevant indicator for 2008 is the number of PC/1000 inhabitants. Lately, the number of computers has increased, mostly in the localities with the most SMEs. The general average is 6 PC/1000 inhabitants, higher in Domneşti (18.2 PC/1000 inhabitants) and Albeştii de Muscel (13.8
PC/1000 inhabitants).
IDENTIFICATION OF TERRITORIAL DISPARITIES AND THE CHANGES ARISEN AT THE LEVEL OF LOCAL SYSTEMS
The quantification of the set of support indicators and their correlation with the territorial reality led to the formation of three problem areas that had slightly different territorial evolutions in the period 1992 – 2008, growing in dimension or shrinking.
In 1992, two privileged area were formed, one that encompasses 11 localities around Câmpulung and another north of Curtea de Argeş, and three underprivileged areas, one in the west,
with 8 localities, one central, on the north-south axis, with 6 localities, and another, in the south-east, with 4 localities.
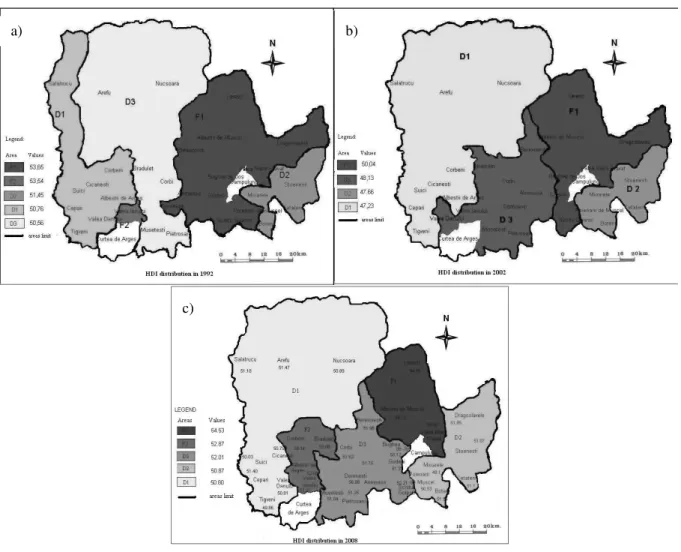
Figure 5.The map of HDI distribution in a) 1992, b) 2002 and c) 2008
The underprivileged area D2 faces problems related to the specialization of the population in mining, the low reconversion degree, the massive depopulation after 1992 due to high unemployment, the presence of brownfields in Stoeneşti, the degradation of the locative fund, the rise in the number of
the population occupied in agriculture, the degradation of the infrastructure due to the lack of investments.
The problem area D3, which has experienced the most changes, is confronted with a high percentage of the population occupied in agriculture, a poorly developed infrastructure and the high degree of population ageing. After 2002, upon the adoption of new localities and the concession of others, problems diversified. The most serious are those related to the environment due to the numerous dumps, the high percentage of unemployment and the increasing depopulation of villages.
Following the evolution of these areas between 1992 and 2002, it is clear how D1 area advances eastwards, swallowing Arefu and Nucşoara localities, while D3 is retreating southwards,
swallowing the privileged area F2 and a part of F1 (Domneşti, Aninoasa, and Berevoieşti) as a
consequence of the closure of the economic objectives in the area, the rise in unemployment, the depopulation, and the population occupied in agriculture.
Between 2002 and 2008, there was a limitation of the underprivileged areas with two privileged areas: F1 strongly restricted to 3 localities, north of Câmpulung, and F2, north of Curtea de Argeş, composed of 5 localities. The decrease of the area F1 from 12 to 3 localities was due mostly to
the economic decay of the town of Câmpulung and also due to the closure of the coal mines.
The emersion of the F2 area was due to the entrepreneurial initiatives that sprung the economic
a) b)
D3 area keeps its eastern limit but it concedes the localities Brăduleţ and Valea Iaşului to the
F2 area. The presence of Domneşti village raises the value of the HDI in this area to 52.1, bringing it
closer to F2 (52.8). Without this village, the average HDI of the other villages would be around 50.5. The village Domneşti, which, in 2008, had the highest HDI due to the development of infrastructure,
the rise of the SMEs and the foreign investments, appears in this whole disadvantaged area as a source of instability that can lead to the economic growth of the area. Unfortunately, this centre of local development is still too weak to polarize the villages in its proximity. One of the reasons is that these villages have exhausted both their human and natural resources. Therefore, their chance to re-enter in the economic circuit is very small.
The D1 area remains approximately in the same boundaries as 2002. It continues to be the most underprivileged area, losing two localities to F2 area: Corbeni and Albeştii de Argeş. With a low
quality infrastructure, a low degree of accessibility and an acute lack of medical systems, D1 remains an area with a huge potential for development. It is also the best preserved area of all the other. Excluded from the 1970s industrial development plans, this area has developed slowly in its natural pace. Today, it is the area with the highest demographic potential and with the most human, tourism and economic resources.
Area D2 extends eastwards, swallowing Dragoslavele village, which is decaying due to the high degree of the population ageing, the degradation of the fruit-growing fund and the lack of investments. This area, with ethnographic and cultural tourism potential, is confronted with a low demographic potential and with insufficient human resources. The degradation of the infrastructure with time, the exhaustion of certain resources and the lack of investments will all lead to the aggravation of these phenomena.
PERSPECTIVES
The underlying of a viable development strategy for the 32 localities that are part of the Muscelele Argeşului area requires the establishment of a set of objectives, steps, measures, and a
multidisciplinary and interdisciplinary analysis of the possibilities for implementing them, as well as the possible alternatives, the evaluation criteria, etc. In the mentioned context, an inventory of the set of concrete solutions is required, solutions that can contribute to solve the problems that these localities are facing today.
We feel that the most important solutions that can be taken into account in the following period can be found in the area of human resources and in that of the workforce (a good information of the population, provision of a continuous qualification, and requalification of the workforce), in the agricultural sector (creation of credit and finance systems appropriate to the rural environment, promotion of ecological agriculture), in the industrial sector (support for the creation of SMEs in the area, facilitation for the use of the old industrial buildings and storage halls), in tourism (a modernization of the infrastructure, support for the traditional customs, development of complementary activities), in the area of infrastructure (extension of the natural gas supply, development of an appropriate economic plan, achievement of a Zonal Urban Plan).
After the realization and the analysis of a SWOT matrix, balance was revealed both in the strong and weak points, just like in the case of opportunities and restrictions.
If, on the one hand, the studied area stands out by advantages such as the special natural conditions, tourism potential and development of the ecologic agricultural production, the conservation of architecture and customs, on the other hand, there are also some negative aspects to signal such as the presence of landslides, the lack of capital, the inappropriate road infrastructure, the numerous abandoned fields due to mining exploitation and the closure of production units, but also due to the dwellings left in decay and the authorities’ inability to finance project proposals.
attraction of young people in the economic and social life of the communities, the rise of the cultural level.
The restrictive factors are the irrational exploitation of the forest fund, the adoption by Romania of the EU acquis, the reintroduction of the quality norms and standards, safety and security, the low incomes of the Romanians and, therefore, the low demand for agritourist services, the lack of the necessary resources in co-financing certain projects (e.g. SAPARD).
The present general evolution of the economic and social life and also the industrialization policy promoted before 1990 led to the creation of a certain unbalance regarding local development. Due to the political and economic changes that took place before 1990 in the rural area of Muscele Argeşului, a series of changes occurred in the economic sector that had repercussions on the whole
territorial and functional structure, and, implicitly, in the dynamics, the structure and quality of life of the local population, fact revealed also by the synthetic situation presented above.
The entrepreneurial initiative at its turn led to the modification in the structure of the space in which it was inserted, through the resource consumption capacity, more or less selective, by the impact it has over the other components, through the creation of new spatial structures leading to the increase in discrepancies.
The attenuation of these unbalances caused by the above mentioned factors must represent a concern for the county and local administration, and also for the central administration considering the national policies for regional development.
ACKNOWLEDGEMENT
Invest in human resources! This work was supported by project: POSDRU/88/1.5/S/61150
“Doctoral Studies in the field of life and earth sciences”, project co-financed through Sectoral Operational Program for the Development of Human Resources 2007-2013 from European Social Fund.
REFERENCES
GHEORGHILAŞ, A. (2006), Bazinul hidrografic Râul Târgului. Potenţialul de dezvoltare al aşezărilor umane [The Râul Târgului Catchment Area. The Development Potential of Settlements], Editura Etnologică, Bucureşti.
IANOŞ, I. (1996), Individualizarea şi analiza disparităţilor intraregionale. Aplicaţie judeţul Alba
[Individualisation and Analysis of Intra-regional Disparities. Application on Alba County], Comunicări de Geografie, a III-a sesiune, Editura Universităţii Bucureşti, Bucureşti.
IANOŞ, I. (2004), Dinamica urbană: aplicaţii la oraşul şi sistemul urban românesc [Urban
Dynamics: Applications on the City and the Romanian Urban System], Editura Tehnică,
Bucureşti.
IANOŞ, I., HELLER W. (2006), Spaţiu, economie şi sisteme de aşezări [Space, Economy and
Settlement Systems],Editura Tehnică, Bucureşti
IANOŞ, I., PEPTENATU, D., ZAMFIR, DANIELA (2009), Respect for Environment and Sustainable Development, Carpathian Journal of Earth and Environmental Sciences, 4, 1, pp. 81-93, Baia
Mare.
IELENICZ, M., PĂTRU, ILEANA, GHINCEA, MIOARA (2003), Subcarpaţii României [The
Romanian Sub-Carpathians], Editura Universitară, Bucureşti.
PEPTENATU, D., TĂLÂNGĂ, C., PINTILII, R.-D., (2008), Rolul sectorului antreprenorial în tratamentul ariilor profund dezavantajate [The Role of the Entrepreneurial Sector in the
Treatment of Deeply Disadvantaged Areas], Comunicări de Geografie, vol. XII, Editura
Universităţii Bucureşti, Bucureşti.
*** (1992, 2002), Census of Population and Dwellings