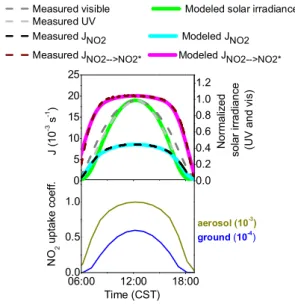
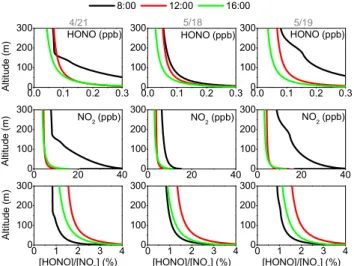
Modeling of daytime HONO vertical gradients during SHARP 2009
Texto
Imagem


Documentos relacionados
The flight altitude, temperature, RH I , and trace gas mixing ratios of NO, SO 2 and HONO as well as particle number density detected with the FSSP and extinction for particles
D., Savarino, J., Kerbrat, M., and Jourdain, B.: Large mixing ratios of atmospheric nitrous acid (HONO) at Concordia (East Antarctic Plateau) in summer: a strong source from
The decrease of CH 4 mixing ratios with height inside the canopy implies that the surface on the plateau is a net source of methane in the measurement period, i.e., methane
Measurements of HONO, NO 2 , NO, J HONO , O 3 , relative humidity, temperature, wind speed, wind direction and barometric pressure at the Harrow measurement site from 28–29 June
Motivation of investigating the influence of the number of finite elements on the results of sensitivity analysis was finding out whether the selected method depends of the
Melt No.. It allowed for the assessment of the influence of aluminium added in the quantity falling into the concerned range on both the graphitization of cast iron
Performed tests have shown that application of phosphorus in form of CuP10 and AlSr10 master alloy as an inoculant gives positive results in form of refinement of primary crystals
During daytime, a similar regression slope of 0.02 ± 0.002 between measured HONO and NO x mixing ratio was obtained for all measurement campaigns (see Fig. 6), albeit with a


