cop
yr
ight
© ABE&M todos os dir
eitos r
eser
v
ados
original
ANDRÉ F. NASCIMENTO
MÁRIO M. SUGIZAKI
ANDRÉ S. LEOPOLDO
ANA P. LIMA-LEOPOLDO
RENATA A. M. LUVIZOTTO
CÉLIA R. NOGUEIRA
ANTONIO C. CICOGNA
Departamento de Clínica Médica e Laboratório Experimental da Clínica Médica da Faculdade de Medicina de Botucatu, Universidade Estadual Paulista (Unesp).
Recebido em 4/3/2008 Aceito em 4/7/2008
ABSTRACT
The present study was carried to develop and analyze the consequences of hypercaloric pellet-diet cycle that promotes obesity in rats. Male Wistar rats were randomly distributed into two groups that received either normal diet (ND; n =32; 3,5 Kcal/g) or a hypercaloric diet (HD; n =32; 4,6 Kcal/g). The ND group received commercial Labina rat feeding while the HD animals received a cycle of five hypercaloric diets over a 14-week period. The effects of the di-ets were analyzed in terms of body weight, body composition, hormone-me-tabolite levels, systolic arterial pressure and glucose tolerance at the 5% significance level. The hypercaloric pellet diet cycle promoted an increase in body weight and fat, systolic arterial pressure and a high serum level of glu-cose, triacylglycerol, insulin and leptin. The HD group also presented an im-paired glucose tolerance. In conclusion, the results of this study show that the hypercaloric pellet-diet cycle promoted obesity in Wistar rats and displayed several characteristics that are commonly associated with human obesity, such as high arterial pressure, insulin resistance, hyperglycaemia, hyperinsu-linaemia, hyperleptinaemia and dyslipidaemia. (Arq Bras Endocrinol Metab 2008; 52/6:968-974)
Keywords: Diet induced-obesity; Hypercaloric diet; Metabolic syndrome; Rats
RESUMO
Ciclo de Dietas Hipercalóricas Induz Obesidade e Comorbidades em Ratos Wistar.
O objetivo do estudo foi desenvolver um ciclo de dietas hipercalóricas para promover obesidade em ratos. Ratos Wistar foram distribuídos em dois gru-pos: dieta normal (ND = 32; 3,5 kcal/g) e dietas hipercalóricas (HD; n = 32; 4,6 kcal/g). O grupo ND recebeu ração comercial e os animais HD um ciclo de diferentes dietas hipercalóricas, por 14 semanas. As variáveis analisadas foram peso corporal, parâmetros metabólicos e hormonais, pressão arterial sistólica e teste oral de tolerância à glicose. O nível de significância foi de 5%. O ciclo de dietas hipercalóricas promoveu aumento de peso e gordura corporal, pressão arterial sistólica e níveis séricos de glicose, triacilglicerol, insulina e leptina no grupo HD. Além disso, o grupo HD apresentou tolerân-cia à glicose diminuída. Em conclusão, os resultados deste estudo mostram que o ciclo de dietas hipercalóricas promove obesidade e exibe várias características comumente associadas com a obesidade humana, como au-mento da pressão arterial, resistência à insulina, hiperglicemia, hiperinsu-linemia, hiperleptinemia e dislipidemia. (Arq Bras Endocrinol Metab 2008; 52/6:968-974)
cop
yr
ight
© ABE&M todos os dir
eitos r
eser
v
ados
INTRODUCTION
O
BESITYISACOMPLEXmultifactor diseasecharacteri-zed by an excessive accumulation of adipose tis-sue that may impair health. It is found in both developed and developing countries, affects all ages and social classes and it is one of the major risk factors in chronic and incapacitating diseases (1).
Effective studies on the consequences of obesity in humans have ethical limitations. For this reason, genetic and dietetic experimental models have been used to stu-dy obesity. Even though genetic mutations cause obesity in animals, the occurrence is rare (2,3). The current World obesity epidemic is a consequence of the high availability and consumption of highly energetic and palliative diets along with a reduction in energy use (4,5). Thus, diet-induced obesity models may be more appro-priate to study the pathology of obesity. To this end stu-dies have been developed to obtain obese animals induced by a high fat (6,7) and high carbohydrate intake (8,9) and by cafeteria diets (10,11). In fact, it has been suggested that rats become more obese as a result of consumption of cafeteria diets rather than high-fat diets, indicating perhaps a greater hyperphagia arising from the food variety (12). However, a cafeteria diet presents some limitations, such as the difficulty in determining the consumption of dietary components and the fact that food is offered in natura and may be in deteriorated state. Therefore, the aim of this study was to develop a more controlled diet consisting of a cycle of hypercaloric pellet-dietary formulations with a different palatability to induce experimental obesity in rats. Obesity is consi-dered to be associated with numerous co-morbidities such as a systemic resistance to insulin, hyperglycaemia, dyslipidaemia, hyperleptinaemia, hyperinsulinaemia and systemic arterial hypertension (6,9,10,13,14) and these parameters were therefore investigated.
METHODS
Animals and experimental model
This study was performed on thirty-day-old male Wistar rats supplied by São Paulo State University Animal Cen-tre Universidade Estadual Paulista (UNESP), Botucatu, SP. Rats were randomly distributed into two groups which were fed on either a normal diet (ND; n=31) or a hypercaloric diet (HD; n=31). ND animals were given commercial Labina rat feeding (Purina, Paulínia, SP, Brazil) and HD animals were submitted to cycles of five
hypercaloric diets (HD1, HD2, HD3, HD4, and HD5) offered for seven days. Rats were maintained on this die-tary regimen for 14 weeks and then sacrificed. The hy-percaloric diet was standardized in our laboratory. The groups received water ad libitum. Food consumption was controlled every day and water was controlled on Mondays, Wednesdays, and Fridays. Body weight was measured weekly. The final body weight to length ratio was also calculated. Length was measured between the nose and the anus of rats, not counting the tail. The feed-ing efficiency (FE) was calculated to analyze an animal’s capacity to convert consumed food energy into body weight. This calculation used total energy ingested by the animals in each cage (Kcal) divided by the average weekly weight gain, multiplied by 100 (15). Ingested energy was calculated by multiplying ingested food quantity by the caloric value of each diet. Caudal arterial systolic pressure (ND, n=23; HD, n=15) was measured at the end of the experiment. Rats were collectively housed in four ani-mals per box, in a temperature controlled (24±2 ºC) en-vironment on a 12-12h light-dark cycle. The study protocol was approved by Botucatu School of Medicine Research Ethics Committee – UNESP and followed the
Guide for Care and Use of Experimental Animals.
Hypercaloric diets components
cop
yr
ight
© ABE&M todos os dir
eitos r
eser
v
ados
Dietary nutritional composition evaluation Dietary nutritional composition was analyzed by the Animal Nutrition and Improvement Laboratory, Scho-ol of Agronomy Sciences, UNESP. The amount of pro-tein, fat, fibre and dry material were according to Weende´s Method. The following equipment was used: Nitrogen Destilator Tecnal – 036/1, Fat Extractor Adamo® Goldfish, Fibre Determinator Tecnal – TE149
and Sterilization and Dry Oven OdontoBras.
Oral glucose tolerance test
Rats (ND: n=17; DH: n=15) were fasted overnight and blood was sampled for analysis of glucose at 0 (before), 30, 60, 120, 180 and 240 min after administration of glucose load (3.0 g/kg by gavage) using a handheld glu-cometer (Prestige Smart System®) (16). The tolerance
glucose between groups was determined according to the area under a curve of glucose (0 to 240 minutes).
Body composition
Body water, fat and protein content were also determi-ned. The percentage of water was calculated as the di-fference between pre- and post- drying body weight according to PPr–PP/PPr x 100%, where PPr = pre-drying weight, and PP = post-pre-drying weight. Bodies were dried at 100±5ºC for 72h in a ventilated Fanem®
oven. After drying, the body was wrapped in paper fil-ter and fat was extracted using a Soxhlet extractor (Corning Incorporated, USA). The percentage of body fat was calculated as PP–PSSG/PPr x 100%, where PP = post-drying weight, PSSG = dry weight after fat ex-traction, and PPr = pre-drying weight. After drying and fat extraction, the body was homogenized and nitrogen quantified by the micro-Kjeldahl method (17). Protein was determined as % nitrogen x PSSG x 6.25/100, where PSSG = dry weight after fat extraction.
Hormone and metabolite determination At the end of the treatments all animals underwent a 12 to 15h fast, were then anaesthetized with sodium pen-tobarbital (40.0 mg/kg, i.p.) and were sacrificed by decapitation. Serum was separated by centrifugation at 3000 rpm for 10 minutes and an enzymatic colorime-tric Kit (CELM, São Paulo, Brazil) was used to
mea-sure glucose (GL), triacylglycerol (TG), total cholesterol (COL), total proteins (PT), albumin (ALB), and high-density lipoprotein (HDL). Spectrophotometry was performed with a Micronal®, model B 382
spectropho-tometer. Serum insulin and leptin (ND; n=13; HD= 13) were measured by the Elisa method using assay kits from Linco Research Inc (Missouri, USA).
Statistical analysis
The results of general characteristic, body composition and biochemical analyses are expressed as means ± stan-dard deviation and were submitted to the Student’s t-test. Values of body weight evolution are shown as means and upper and lower limits of 95% confidence intervals for the mean and are compared using two-way analysis of variance for repeated measurements in inde-pendent groups. The results were interpreted using the 5% significance level.
RESULTS
General characteristics
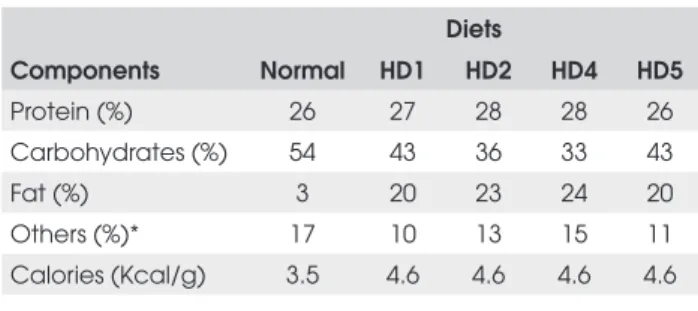
The hypercaloric diets 1, 2, 4 e 5 were calorically rich (Hypercaloric diets = 4,6 kcal/g versus normo-caloric diet = 3,5 kcal/g), due to a higher fat composition (Table 1). In the hypercaloric diet 3, the increase of the caloric value was due to sucrose addition in the water (1.2 kcal/ml).
Table 1. Composition of normal and hypercaloric diets.
Diets
Components Normal HD1 HD2 HD4 HD5
Protein (%) 26 27 28 28 26
Carbohydrates (%) 54 43 36 33 43
Fat (%) 3 20 23 24 20
Others (%)* 17 10 13 15 11
Calories (Kcal/g) 3.5 4.6 4.6 4.6 4.6
HD1, HD2, HD4, HD5: hypercaloric diets. Diet H3 is not shown above because it consisted of normal Labina diet (Purina, Paulínia, SP) plus sugared water at a concentration of 300g/L (1.2kcal/ml water). * Others: vitamins, minerals, cinders and water.
cop
yr
ight
© ABE&M todos os dir
eitos r
eser
v
ados
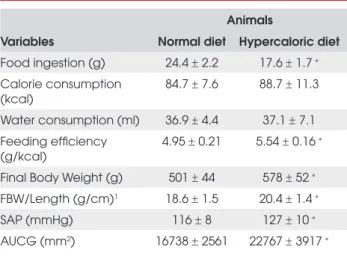
HD (ND = 4.95±0.21 and HD = 5.54±0.16g/kcal, p<0.001). Body weight/ length ratio (ND = 18.6±1.5 and HD = 20.4±1.4mmHg, p<0.001) and systolic arte-rial pressure (ND = 116±8 and HD = 127±10mmHg, p<0.001) were higher in the HD than in the ND rats. The HD rats presented a higher glucose intolerance than did the ND group (ND = 16738±2561 and HD = 22767±3917mm2, p<0.001). Although the ND and
HD groups started with a similar body weight at week 0, a significant separation of body weight between the two groups was observed at week 5 that continued throu-ghout the rest of the study.
Table 2. General characteristics of animals.
Animals
Variables Normal diet Hypercaloric diet
Food ingestion (g) 24.4 ± 2.2 17.6 ± 1.7 ∗
Calorie consumption (kcal)
84.7 ± 7.6 88.7 ± 11.3
Water consumption (ml) 36.9 ± 4.4 37.1 ± 7.1 Feeding efficiency
(g/kcal)
4.95 ± 0.21 5.54 ± 0.16 ∗
Final Body Weight (g) 501 ± 44 578 ± 52 ∗
FBW/Length (g/cm)1 18.6 ± 1.5 20.4 ± 1.4 ∗
SAP (mmHg) 116 ± 8 127 ± 10 ∗
AUCG (mm2) 16738 ± 2561 22767 ± 3917 ∗
Values are expressed as means ± standard deviation. FBW, final body weight;
SAP, systolic arterial pressure; AUCG, area under the curve of glucose (0 to 240
minutes). ∗p<0.05 versus normal diet, Student’s t-test. 1 Animal length measured
between nose and anus without the tail.
0 150 300 450 600 750
0 2 4 6 8 10 12 14
Time fed diets (wk)
B
o
d
y
w
e
ig
h
t
(g
)
* *
*
* * *
* * * *
Figure 1. Body weights (mean ± SEM) of a 14-week treat-ment of normal diet (, solid triangles) and hypercaloric diet (, solid rectangle) groups. * p<0.05 versus normal diet; ANO-VA, Tukey.
Body composition
Table 3 shows data from the body composition of the ND and HD groups. Absolute body water (ND = 225±22 and HD = 249±26g, p<0.001) and relative body fat (ND = 18.0±4.2 and HD = 25.5±4.5%, p<0.001) and absolute body fat (ND = 71±20 and HD = 121±31g, p<0.001) were higher in the HD group than in the ND group. The relative body water (ND = 57.6±3.3 and HD = 53.0±3.4%, p<0.001) and relative body protein (ND = 16.5±1.3 and HD = 14.2±1.1%, p<0.001) were smaller in the HD com-pared to the ND group.
Table 3. Body composition
Animals
Variables Normal diet Hypercaloric diet
Body water (g) 225 ± 22 249 ± 26∗
Body water (%) 57.6 ± 3.3 53.0 ± 3.4∗
Body fat (g) 71,0 ± 20,0 121 ± 31∗
Body fat (%) 18.0 ± 4.20 25.5 ± 4.45∗
Body protein (g) 63.9 ± 4,99 66.6 ± 7.38 Body protein (%) 16.4 ± 1.37 14.2 ± 1.14∗
Values expressed as means ± standard deviation. ∗p<0.05 versus normal diet
using Student’s t-test.
Hormone and metabolite determination Serum concentrations of glucose (ND = 99±19 and HD = 114±33 mg/dl, p<0.05) and triacylglycerol (ND = 143±51 and HD = 197±106 mg/dl, p<0.05) were higher in the HD than in the ND rats (Table 4). HDL was lower in the HD animals (ND = 51±10 and HD = 43±10 mg/dl, p<0.01). The total protein, albumin and total cholesterol levels were similar between the groups. The level of insulin (ND = 0,45±0,19 and HD = 1,48±0,67 ng/dl, p<0,05) and leptin (ND = 2,31±0,53 and HD = 4,82±1,34 ng/dl, p<0,05) were higher in the HD fed animals.
Table 4. Hormone and metabolite determination.
Animals
Variables Normal diet Hypercaloric diet
Total protein (g/dl) 6.66 ± 0.58 6.57 ± 0.46 Albumin (g/dl) 3.78 ± 0.53 3.91 ± 0.51 Glucose (mg/dl) 99,1 ± 18,7 114 ± 32,9* Triacylglycerol (mg/dl) 143 ± 51,2 197 ± 106* Total cholesterol (mg/dl) 66,1 ± 14,3 68,9 ± 21,5 HDL (mg/dl) 51,4 ± 9,68 42,9 ± 9,59* Insulin (ng/dl) 0,45 ± 0,19 1,48 ± 0,67* Leptin (ng/dl) 2,31 ± 0,53 4,82 ± 1,34*
Values expressed as means ± standard deviation. HDL, high density lipoprotein.
cop
yr
ight
© ABE&M todos os dir
eitos r
eser
v
ados
DISCUSSION
The cycle of pelleted hypercaloric diet used in this stu-dy was efficient in promoting obesity in rats. This con-clusion is based on the finding of increasing body weight and body fat associated with co-morbidities with impaired glucose tolerance, hyperinsulinaemia, hyperleptinaemia, hyperglycaemia, dyslipidaemia and elevated arterial pressure.
The hypercaloric diet used to promote experimen-tal obesity has been presented in either pellet form or as food in natura, the second better known as cafeteria diets(10).These latter types of diet are highly energe-tic, tasty and contain different shapes and are therefore much closer to the food consumed in general by hu-mans. However, they have some drawbacks, since they are offered in natura they may deteriorate and it is also difficult to quantify how much food animals consume. The cycle pellet-hypercaloric diet model used in this study was based on cafeteria diet since that has been suggested that rats become more obese on this fare (12). Several advantages of our pellet-diet model in re-lation to the cafeteria diet are the knowledge of food components and caloric consumption and the fact that it is stored in pellets means that is less perishable, thus helping to maintain food integrity. Hypercaloric diets 1, 2, 4, and 5 were isocaloric and had 31% more energy content than the standard diet and are in accordance with studies that have promoted diet-induced obesity (6,7,9). One objective of our cyclic pellet-hypercaloric diet model was to increase food ingestion levels by va-rying palatability, however, the HD group ingested less food. This result is in at variance with previous studies, since it has been proposed that hyper-lipid diets cause less satiation and consequently result in higher food in-gestion levels (9,18,19). The hypophagia observed in the HD group may be due to the high serum leptin level (Table 4). Leptin, a hormone synthesized and se-creted by adipose tissue, is mainly involved in the regu-lation of appetite and energy metabolism. The binding of leptin to the appropriate leptreceptor triggers in-tracellular signalling processes in the ventromedial hy-pothalamus (satiety centre), which, in turn, signals the brain that adequate food has been ingested (20).
Despite a lack of caloric excess consumption the body weight gain was increased in the HD rats. The in-crease of body weight was a consequence of the body fat storage enhancement, since the increasing caloric densi-ty was due to higher fat composition, i.e., seven times
the standard diet (Table 1), as confirmed by carcass analysis (Table 3). This interpretation is based on pre-vious studies that demonstrate a high fat accumulation when more energy comes from dietary fat than from car-bohydrate or protein (21,22). The enhanced body wei-ght gain, induced by the diet in the present work, is in agreement with some studies that used cafeteria (10,11) or hypercaloric diets (6,7,23), but not with all studies (16,24,25). However, the fact that the time to reach in-crease body weight in our diet is similar to other models (7,11) lends strength to our interpretation.
Obesity has been characterized by numerous co-morbidities in addition to elevated weight and body fat, as mentioned above, including systemic insulin resistan-ce, hyperinsulinaemia, hyperleptinaemia, hyperglycae-mia, dyslipidaemia and elevated systolic arterial pressure (6,9,10,13,14). The increase in body weight and fat, due to the hypercaloric pellet-diet cycle used in this work, was associated with these co-morbidities. The in-crease of systolic arterial pressure may be due to a num-ber of factors, including sympathetic autonomic system activation (23,26), higher activity in the renin-angioten-sin system (24,27,28), oxidative stress (26) and an incre-ase of free fatty acid (29), insulin (30) and leptin (31), all being observed in obesity. The impaired glucose toleran-ce associated to hyperglycaemia and hyperinsulinaemia in HD animals indicates that hypercaloric pellets-diet promoted insulin resistance, a state in which higher con-centrations of insulin is required to maintain normo-glycaemia (32,33). It is well established that increased availability and utilization of free fatty acids play a critical role in the development of insulin resistance. Excess adi-pose tissue has been shown to release an increased amount of free fatty acids which directly affect insulin signalling, diminishes glucose uptake in muscle, drives exaggerated triglyceride synthesis and induces gluconeo-genesis in the liver (34,35). The elevated serum levels of glycaemia and triacylglycerol associated with insulin re-sistance in this study indicate that an abundance of free fatty acids may be responsible for the co-morbidities ob-served in the hypercaloric diet model.
cop
yr
ight
© ABE&M todos os dir
eitos r
eser
v
ados
role in body weight regulation and other questions di-rectly related to obesity.
Acknowledgments: The authors would like to thank José Carlos Georgete, Mário Baptista Bruno and Sandra Fábio for technical assistance. This manu-script has been proofread and edited by native Eng-lish speakers with related background in BioMed Proofreading (Cleveland, Ohio, USA). There are no conflicts of interest in this study.
REFERENCES
1. World Health Organization – WHO [homepage on the Inter-net]. Obesity and overweight. Geneva; 2006. Available from: http://www.who.int. /mediacentre/factsheets/fs311.
2. Lubrano-Berthelier C, Cavazos M, Dubern B, Shapiro A, Stunff CL, Zhang S, et al. Molecular genetics of human obesity-asso-ciated MC4R mutations. Ann N Y Acad Sci. 2003;994:49-57.
3. Carroll J, Voisey J, Daal AV. Mouse models of obesity. Clin Dermatol. 2004;22:345-9.
4. Astrup A, Buemann B, Western P, Toubro S, Raben A. Obesity as an adaptation to a high-fat diet: evidence from a cross-sec-tional study. Am J Clin Nutr. 1994;59:350-5.
5. Lissner L, Heitmann BL. Dietary fat and obesity: evidence from epidemiology. Eur J Clin Nutr. 1995 49:79-90.
6. Woods SC, Seeley RJ, Rushing PA, D´Alessio D, Tso P. A con-trolled high-fat diet induces an obese syndrome in rats. J Nutr. 2003;133:1081-7.
7. Relling DP, Esberg LB, Fang CX, Johnson WT, Murphy EJ, Carl-son EC, et al. High-fat diet-induced juvenile obesity leads to cardiomyocyte dysfunction and upregulation of foxo3a trans-cription factor independent of lipotoxicity and apoptosis. J Hypertens. 2006;24:549-61.
8. Beltowski J, Wojcicka G, Gorny D, Marciniak A. The effects of dietary-induced obesity on lipid peroxidation, antioxidant en-zymes and total plasma antioxidant capacity. J Physiol Phar-macol. 2000;51:883-96.
9. Dourmashkin JT, Chang GQ, Gayles EC, Hill JO, Fried SK, Ju-lien C, et al. Different forms of obesity as a function of diet composition. Int J Obes. 2005;9:1-11.
10. Sclafani A, Springer D. Dietary obesity in adults rats: similari-ties to hypothalamic and human obesity syndromes. Physiol Behav. 1976;17:461-71.
11. Esteve M, Immaculada R, Fernandez-Lopez JA, Remesar X, Alemany M. Effects of a cafeteria diet on energy intake and balance in Wistar rats. Physiol Behav. 1994;56:65-71.
12. West DB, York B. Dietary fat, genetic predisposition, and obe-sity: lessons from animals models. Am J Clin Nutr. 1998;67:505S-12S.
13. Akiyama T, Tachibana I, Shirohara H, Watanabe N, Otsuki M. High-fat hypercaloric diet induces obesity, glucose intolerance and hyperlipidaemia in normal adult male wistar rat. Diab Res Clin Pract. 1996;31:27-35.
14. Jang I, Hwang D, Lee J, Chae K, Kim Y, Kang T. Physiological difference between dietary obesity-susceptible and obesity
resistant Sprague Dawley rats in response to moderate high fat diet. Exp Anim. 2003;52:99-107.
15. Surwit RS, Feinglos MN, Rodin J, Sutherland A, Petro AE, Opara EC, et al. Differential effects of fat and sucrose on the development of obesity and diabetes in C57BL/6J and A/J mice. Metabolism. 1995;44:645-51.
16. Borst SE & Conover CF. High-fat diet induces increased tissue expression of TNF-α. Life Sci. 2005;77:2156-65.
17. Kjeldahl. Official methods of analysis. 12. ed. Washington: As-sociation of Official e Agriculture Chemists. 1970.
18. Green SM, Burley VJ, Blundell JE. Effect of fat- and sucrose – containing foods on the size of eating episodes and energy intake in lean males: potential for causing overconsumption. Eur J Clin Nutr. 1994;48:547-55.
19. Blundell JE, Burley VJ, Cotton JR, Lawton CL. Dietary fat and the control of energy intake: evaluating the effects of fat on meal size and postmeal satiety. Am J Clin Nutr. 1993;57:777-8. 20. Trayhurn P, Beattie JH. Physiological role of adipose tissue:
with adipose tissue as an endocrine and secretory organ. Proc Nutr Soc. 2001;60:329-39.
21. Lean ME, James WP. Metabolic effects of isoenergetic nutrient exchange over 24-hours in relation to obesity in women. Int J Obes. 1988;12:15-27.
22. Horton TJ, Drougas H, Brachey A, Reed GW, Peters JC, Hill JO. Fat and carbohydrate overfeeding in humans: different effects on energy storage. Am J Clin Nutr. 1995;62:19-29.
23. Barnes MJ, Lapanowski K, Conley A, Rafols JA, Jen KLC, Dun-bar JC. High fat feeding is associated with increased blood pressure, sympathetic nerve activity and hypothalamic mu opioid receptors. Brain Res Bull. 2003;61:511-9.
24. Okere IC, Chandler MP, McElfresh TA, Rennison JH, Sharov V, Sabbah HN, et al. Differential effects of saturated and unsatu-rated fatty acid diets on cardiomyocyte apoptosis, adipose distribution, and serum leptin. Am J Physiol Heart Circ Phy-siol. 2006;291:39-44.
25. Pinotti MF, Silva MD, Sugizaki MM, Diniz YS, Sant’Ana LS, Ara-gon FF, et al. Effect of unsaturated fatty acids on myocardial performance, metabolism and morphology. Braz J Med Biol Res. 2006;39:305-12.
26. Pausova Z. From big fat cells to high blood pressure: a pa-thway to obesity-associated hypertension. Curr Opin Nephrol Hypertens. 2006;15:173-8.
27. Fitzgerald SM, Henegar JR, Brands MW, Henegar LK, Hall JE. Cardiovascular and renal responses to a high-fat diet in Os-borne-Mendel rats. Am J Physiol Regul Integr Comp Physiol. 2001;281:H547-52.
28. Boustany-Kari CM, Gong M, Akers WS, Guo Z, Cassis LA. Enhanced vascular contractility and diminished coronary ar-tery flow in rats made hypertensive from diet-induced obesity. Int J Obes. 2006;14:778-86.
29. Tripathy D, Mohanty P, Dhindsa S, Syed T, Ghanim H, Aljada A, et al. Elevation of free fatty acids induces inflammation and impairs vascular reactivity in healthy subjects. Diabetes. 2003;52:2882-7.
30. Defronzo RA, Cooke CR, Andres R, Faloona GR, Davis PJ. The effects of insulin on renal handling of sodium, potassium, cal-cium, and phosphate in man. J Clin Invest. 1975;55:845-55. 31. Ren J. Leptin and hyperleptinaemia – from friend to foe for
cardiovascular function. J Endocrinol. 2004;181:1-10.
cop
yr
ight
© ABE&M todos os dir
eitos r
eser
v
ados
33. Eckel RH, Grundy SM, Zimmet PZ. The metabolic syndrome. Lancet. 2005;365:1415-28.
34. Proietto J. Mechanisms of insulin resistance caused by nu-trient toxicity. Hepatol Res. 2005;33(2):87-91.
35. Mlinar B, Marc J, Janez A, Pfeifer M. Molecular mechanisms of insulin resistance and associated diseases. Clinica Chimica Acta. 2007;375:20-35.
Correspondence to:
Antonio Carlos Cicogna
Departamento de Clínica Médica – FMB-Unesp Distrito de Rubião Jr., s/n; Botucatu/SP.