Fisioter. Mov., Curitiba, v. 30, n. 2, p. 277-285, Apr./June 2017 Licenciado sob uma Licença Creative Commons DOI: http://dx.doi.org/10.1590/1980-5918.030.002.AO08
[T]
Evaluation of frequency of positive exercise-induced
bronchospasm between swimmers and sedentary individuals
Avaliação da frequência do broncoespasmo induzido por
exercício (BIE) positiva entre nadadores e sedentários
Laricy Martins da Mata[a], Regiane Coissi Sanches[a], Marceli Rocha Leite[b],
Francis Lopes Pacagnelli[a], Luiz Carlos Marques Vanderlei[c], Flávio Danilo Mungo Pissulin[a]*
[a] Universidade do Oeste Paulista (Unoeste), Presidente Prudente, SP, Brazil [b] Universidade de São Paulo (USP), São Paulo, SP, Brazil
[c] Universidade Estadual Paulista Júlio de Mesquita Filho (UNESP), Presidente Prudente, SP, Brazil
[R]
Abstract
Introduction: Despite the prevalence of prescribed asthma, there is uncertainty about the incidence of exer-cise-induced bronchospasm (EIB). Objective: Compare the frequency of EIB between swimmers and seden-tary individuals, and observe heart rate variability during bronchial activity. Methods: In total, 18 swimmers (group 1) and 18 sedentary individuals (group 2) were included. The participants rested for 30 minutes for evaluation of HRV. Blood pressure (PA), respiratory rate (RR), and pulse oxygen saturation (SpO2) were mea-sured. The volunteers remained seated for the spirometry test (maneuver of forced vital capacity - FVC). This was repeated 5, 10, 15, 20, and 30 minutes after the exercise test. The statistical analysis used the Student t, Mann Whitney, and Shapiro-Wilks tests. The significance level was p <0.05. Results: The spirometry findings showed 3 sedentary individuals and 10 swimmers with obstructive ventilatory disorder (OVD). Only 2 of the sedentary and none of the swimmer group demonstrated positive bronchial provocation. A key criterion for diagnosing OVD, the relationship between forced expiratory volume in one second and FVC (FEV1/FVC), was
* LMM: BS, e-mail: [email protected]
RCS: undergrad, e-mail: [email protected] MRL: Doctoral Student, e-mail: [email protected] FLP: PhD, e-mail: [email protected]
278
statistically lower in the swimmer group. The measures of the root mean square of the successive differences between adjacent normal RR intervals, in a time interval (RMSSD), and the standard deviation of all normal RR intervals recorded in a time interval (SDNN) were significantly higher among the athletes. Conclusion: The bronchial provocation test identified a higher prevalence of bronchospasm among sedentary individuals. However, there was a reduction in the FEV1/FVC ratio and higher HRV in the group of swimmers.
Keywords: Athletes. Asthma. Exercise-Induced Bronchospasm.
Resumo
Introdução: Apesar da prevalência da asma definida, há imprecisão sobre incidência de broncoespasmo in
-duzido por exercício (BIE). Objetivo: Comparar a freqüência de BIE entre nadadores e sedentários, e obser
-var a -variabilidade da freqüência cardíaca durante a atividade de broncoprovocação. Métodos: Incluídos 18
nadadores (grupo 1) e 18 sedentários (grupo 2). Permaneceram por 30 minutos de repouso para a avaliação da VFC. Foi aferida a pressão arterial (PA), frequência respiratória (f) e a saturação de pulso de oxigênio (SpO2). Permaneceram sentados, para o teste de espirometria (manobra da capacidade vital forçada – CVF). Essa foi repetida em 5, 10, 15, 20 e 30 minutos após o teste de esforço. A análise estatística usou os testes t de Student, Mann Whitney de Shapiro-Wilk, com nível de significância p<0,05. Resultados: A espirometria eviden
-ciou 3 sedentários e 10 nadadores com distúrbio ventilatório obstrutivo (DVO). Apenas 2 do grupo sedentário apresentaram broncoprovocação positiva e nenhum do grupo de nadadores. Um critério fundamental para diagnosticar DVO, a relação entre o volume expiratório no primeiro segundo e a CVF (VEF1/CVF) foi estatis
-ticamente menor no grupo de nadadores. As médias da raiz quadrada da média do quadrado das diferenças entre intervalos RR normais adjacentes, em um intervalo de tempo (RMSSD) e no desvio padrão de todos os intervalos RR normais gravados em um intervalo de tempo (SDNN), foram estatisticamente maiores entre os atletas. Conclusão: O teste de broncoprovocação identificou maior prevalência de broncoespasmo entre os
sedentários. Entretanto, houve redução na relação VEF1/CVF e maior VFC no grupo de nadadores.
Palavras-chave: Atletas. Asma. Broncoespasmo Induzido Por Exercício.
Introduction
Asthma is characterized by chronic inflamma -tion in the airways, and severe and acute reduc-tion in bronchial lumen, with a consequent reduction in
airflow in response to bronchoconstrictor stimuli
(1, 2, 3). The average global prevalence varies be-tween 1% and 18%, depending on the country. It av-erages 11.6% among school children (six and seven years) and 9.5% from 0 to 17 years (4, 5).
Exercise-induced bronchospasm (EIB) is gener-ated by the practice of vigorous physical activity that
induces bronchospasm. It begins with five to ten min -utes of physical activity, and normalization of bronchial tone after 30 to 60 minutes of rest. There is a higher prevalence of EIB in athletes who perform activities in cold climates (6, 7), and higher intensity activities (8), such as swimmers, cyclists and distance runners.
The perception of symptoms of EIB is low in these competitors, which inhibits diagnosis and treatment (8, 9). Among high-level swimmers reports of asthma and/or drug use reached 29.6% in one study (8).
Swimming has always been seen as a good treat-ment for asthma and bronchitis; however some in-dividuals may develop asthma attacks during and after swimming, or worsening symptoms, either due to the exercise, chlorine inhalation, or the high frequency of rhinitis and sinusitis. Swimming aims to reeducate respiratory function, especially dia-phragmatic, improving regional ventilation, in areas, which improves the ventilatory pattern. In addition,
there is improved aerobic fitness, which prepares
279
the Clinical School of Physiotherapy, Unoeste (respi-ratory therapy sector).
After verification of height and weight (Filizola®
scale), and calculation of the body mass index (BMI), subjects were instructed to remain for 10 minutes sitting at rest. Blood pressure was measured using a non-invasive method with a sphigometer, BD brand, pulse oxygen saturation (SpO2), with an oximeter,
NONIN brand, and respiratory rate (r), by observing the oscillations of the rib cage (11, 12).
Autonomic Evaluation
The Heart Rate Variability (HRV) was also deter-mined. For this, the volunteers were instructed not to consume alcoholic beverages or autonomic nervous system stimulants, such as coffee, tea, and chocolate drinks, for at least 24 hours prior to the evaluation.
The collection was initiated after the individual had remained seated for 10 minutes in a quiet place. The measurement was performed for 30 minutes and in-terrupted to perform the spirometry. When the patient began the test on the treadmill, the measurement of HRV started once again until the end of the exercise test, to verify the maximum heart rate achieved.
The capture belt was positioned at the distal third of the sternum, and the HR Polar RS800 CX RUN re-ceiver on the wrist. This equipment has been previ-ously validated to capture HR beat to beat as well as the use of the data for analysis of HRV indices (13).
The data analysis used 1000 consecutive RR
inter-vals. Digital complemented by manual filtering was
carried out to eliminate premature ectopic beats and artifacts, and only series with more than 95% of sinus beats were included in the study (13).
For HRV analysis: nonlinear methods [DFA - Total DFA, alpha 1, alpha 2 and alpha 1/alpha 2 ratio, Recurrence plot — from which was extracted the recurrence rate (REC), determinism (DET) and ap-proximate entropy (ApEn) — and the Poincaré plot, also being evaluated linear methods analyzed in the time (SDNN and RMSSD) and frequency domains (LF HF and LF/HF) and geometric methods (triangular index and TINN). The RMSSD is the root mean square of the successive differences between adjacent normal RR intervals in a time interval, expressed in ms, SDNN is the standard deviation of all normal RR intervals recorded in an interval of time expressed in ms, HF (High Frequency) and LF (Low Frequency), SD1 is the EIB can be characterized as a drop in forced
expi-ratory volume in one second (FEV1) greater than or
equal to 10%. Decreases of more than 15% are mild, 20% to 30% moderate, over 30% severe (10). High performance athletes should perform spirometry and bronchial provocation tests even when they do not present a previous history of the disease.
It is not possible to affirm that physical condi -tioning of swimmers is a trigger of bronchoconstric-tion, due to the presence of greater parasympathetic tone. However, it is well established that cholinergic stimulation induces bronchoconstriction. Greater parasympathetic tone could be an adjuvant to bron-chospasm when associated with the presence of a trigger (10). The high prevalence of asthma among adolescents together with the frequent complaints of dyspnea and “wheezing” in swimming athletes
stimulated the proposal for the current scientific
study. In this context we intend to encourage early diagnosis, so that these athletes seek preventive treatment and avoid episodes of exacerbation char-acterized by EIB.
Considering the above, it is possible that there would be a higher prevalence of EIB among swim-mers, associated with increased parasympathetic tone, when compared to sedentary individuals.
This study aimed to compare the frequency of exercise-induced bronchoconstriction (EIB) between swimmers and sedentary individuals, and observe heart rate variability during the course of bronchial provocation activity.
Methods
The present study is transversal. In total 40 in-dividuals of both genders were included, aged 13 to 25 years. The participants presented no past history of bronchial asthma and did not use bronchodilator medication. Group 1 was composed of 20 swimmers in a training regimen, often six days a week with a minimum of 3 hours. Group 2 included the same sample size, but was formed by sedentary individuals.
280
distribution between the groups, the Student's t test for unpaired data was applied, while for non-normal distribution, the Mann Whitney test was used. The
value of significance considered was p < 0.05.
Results
The present study evaluated 40 individuals. Of this total, 18 were sedentary (5 males and 13 females) and 18 were athletes, including 12 males and 6 fe-males. Two volunteers from each group refused to perform the proposed tests.
Table 1 presents the anthropometric
characteris-tics of both groups. Significant differences were ob -served in height and weight between athletes and
sed-entary individuals (p < 0.05). The spirometry findings
also showed 3 sedentary individuals with obstructive ventilatory disorder (OVD) and 10 athletes with the
same result, verified pre physical activity (Table 1),
by the reduction in the FEV1/FVC ratio (Table 3). This
table presents the values in means and therefore the reduction in the FEV1/FVC ratio is not evident.
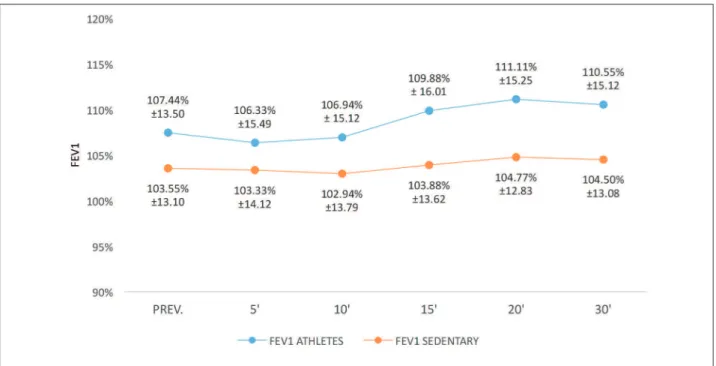
The application of the EIB test demonstrated that 2 sedentary individuals presented a decrease greater than 25% in the FEF 25-75%, as well as a reduction greater than 10% in the FEV1, comparing the values
measured pre exercise and 5 minutes after the test (Figure 1). No reduction in these parameters was observed among athletes, positive bronchoprovoca-tion did not occur in the test.
Table 2 shows the mean values of the spirometric parameters FEV1 and FEF25-75%, of sedentary
individu-als and athletes before executing the EIB test (pre) and 5, 10, 15, 20, and 30 minutes after testing. It can be seen that the mean FEV1, at all times, was higher (p < 0.05) in the athletes. The FEF 25-75% behavior
was similar in both groups.
The FEV1/FVC ratio was statistically lower in the group of athletes, at all measurement times, p < 0.05
(Table 3). Regarding the comparison between the times of the pre maximal stress test and 5, 10, 15, 20, and 30 minutes post-test, statistical difference was only ob-served in the FEF25-75% at 5 and 15 minutes in the athletes, with an increase in the time of 15 minutes (p < 0.05).
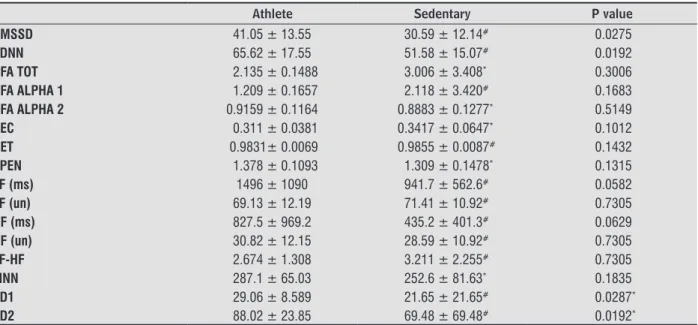
Table 4 presents the mean and standard deviation values of heart rate variability (HRV). The RMSSD
which verifies parasympathetic tone and SDNN which verifies sympathetic tone were statistically higher in the athletes (p < 0.05).
standard deviation of the instantaneous variability beat to beat, SD2 is the standard deviation in the long-term of continuous RR intervals and the TINN index is the triangular interpolation of the intervals (14).
Kubios HRV analysis software version 2.0 was used to calculate these indices (15).
Spirometry
Thirty minutes after the HRV collection the spiro-metric test was performed. The curve of the forced vital capacity was recorded (FVC) using a spirom-eter, Micro Medical MK8. The subjects performed the test in a sitting position and, after inserting the nozzle, performed a maximal inspiration followed by a maximal expiration. Spirometry was performed prior to the maximal exercise test and 5, 10, 15, 20, and 30 minutes after the stress test on the treadmill. All spirometry procedures were in accordance with the guidelines for pulmonary function tests, which in-cluded temperature and humidity control maintained between 23 and 25 degrees Celsius (3, 11, 12). The objective was to avoid large differences between the temperature of the spirometer and the body.
Test to trigger exercise-induced bronchoconstriction (EIB)
For the realization of the EIB, a treadmill, brand IMBRAMED, was used. It was programmed with a
fixed inclination of 10% and speed controlled to reach
a heart rate between 75% and 85% of maximal HR in
the first 2 minutes. HR remained in the range between
85% and 95% of the maximum value expected until the end of test, which lasted 8 minutes.
For EIB, the test was considered positive when there was a reduction greater than 10% in forced ex-piratory volume in one second (FEV1), or a decrease of 25% in forced expiratory flow between 25% and
75% of expiration (FEF25%-75%), to compare the value of
the spirometric parameter before exercise with any of the measurements taken after the stress test (10, 12).
Statistical methods
281
Table 1 - Baseline anthropometric data, lung function data, and obstructive ventilatory disorder pre spirometric and maxi-mum stress tests in athletes and sedentary individuals
Parameters Athlete Sedentary P value
Age (years) 16.28 ± 2.67 17.83 ± 3.45# 0.08
Height (cm) 173.8 ± 7.64 162 ± 7.19* < 0.0001 Weight (Kg) 66.92 ± 11.36 56.72 ± 11.41* 0.0111 BMI (Kg/m2) 22.05 ± 2.47 21.52 ± 4.26# 0.3588
OVD 10 3 0.14
Note: * signiicant difference between athlete and sedentary groups (Student's t-test for unpaired samples, p < 0.05). # Signiicant difference between athlete and sedentary groups (Mann-Whitney t test, p < 0.05), BMI (body mass index), OVD (obstructive ventilatory disorder), cm (centimeters), Kg (kilograms), Kgm2 (kilograms per square meter),% Prev (percentage of predicted), FVC (forced vital capacity), FEV
1 (forced expiratory volume in one second), FEV1/FVC ratio (ratio of forced expiratory volume in one second and forced vital capacity ) and FEF 25-75% (Forced expiratory low).
Figure 1 - Values of decrease in FEV1 in sedentary individuals and athletes pre test and 5, 10, 15, 20, and 30 minutes post EIB
Note: FEV1 (forced expiratory volume in one second), PREV (predicted value), 5 '(5 minutes), 10' ('10 mins), 15' (15 minutes), 20' (20 min-utes) and 30' (30 minmin-utes).
Table 2 - Comparison of the athletes and sedentary individuals, in the spirometric parameters FEV1, FEF 25-75, pre execu-tion of the EIB test and 5, 10, 15, 20, and 30 minutes after the maximum stress test on the treadmill
Times FEV1 A FEV1 S P value FEF25-75% A FEF25-75% S P value
Pre 4.03 ± 0.74 3.26 ± 0.61# 0.0015 3.96 ± 0.83 4.14 ± 0.95# 0.64
5 minutes 3.96 ± 0.72 3.26 ± 0.63# 0.0012 3.80 ± 0.93 4.04 ± 1.02# 0.43 10 minutes 4.10 ± 0.74 3.28 ± 0.61# 0.0004 4.06 ± 0.95 4.08 ± 1.05# 0.86 15 minutes 4.14 ± 0.74 3.28 ± 0.63# 0.0004 4.15 ± 0.93 4.12 ± 1.02# 0.92 20 minutes 4.15 ± 0.72 3.26 ± 0.65# 0.0003 4.12 ± 0.83 4.20 ± 1.05# 0.96 30 minutes 4.07 ± 0.73 3.27 ± 0.64# 0.0003 3.97 ± 0.80 4.13 ± 1.02# 0.91
Note: #Signiicant difference between the athletes and sedentary groups (Mann-Whitney t test, p < 0.05); FEV
282
Table 3 - Comparison of the athlete and sedentary groups for FEV1/FVC (%), pre execution of the EIB test and 5, 10, 15, 20, and 30 minutes after the maximum stress test on the treadmill
Times FEV1/FVC athlete FEV1/FVC sedentary P value
Pre 85 ± 6.3 91 ± 3.6* 0.0003
5 minutes 83 ± 7.5 92 ± 4* 0.0002
10 minutes 83 ± 6.8 92 ± 4.9* 0.0002
15 minutes 84 ± 6.9 92 ± 5.2* 0.0008
20 minutes 84 ± 7.2 93 ± 4.7* 0.0001
30 minutes 83 ± 6.6 92 ± 4.2* 0.0001
Note: * Signiicant difference between the athlete and sedentary groups (Student's t-test for unpaired samples, p < 0.05). FEV
1/FVC (ratio of forced expiratory volume in one second and forced vital capacity).
Table 4 - Mean and standard deviation of heart rate variability between the groups of athletes and sedentary individuals evaluated before the spirometric intervention and thirty minute stress test
Athlete Sedentary P value
RMSSD 41.05 ± 13.55 30.59 ± 12.14# 0.0275
SDNN 65.62 ± 17.55 51.58 ± 15.07# 0.0192
DFA TOT 2.135 ± 0.1488 3.006 ± 3.408* 0.3006
DFA ALPHA 1 1.209 ± 0.1657 2.118 ± 3.420# 0.1683 DFA ALPHA 2 0.9159 ± 0.1164 0.8883 ± 0.1277* 0.5149
REC 0.311 ± 0.0381 0.3417 ± 0.0647* 0.1012
DET 0.9831± 0.0069 0.9855 ± 0.0087# 0.1432
APEN 1.378 ± 0.1093 1.309 ± 0.1478* 0.1315
LF (ms) 1496 ± 1090 941.7 ± 562.6# 0.0582
LF (un) 69.13 ± 12.19 71.41 ± 10.92# 0.7305
HF (ms) 827.5 ± 969.2 435.2 ± 401.3# 0.0629
HF (un) 30.82 ± 12.15 28.59 ± 10.92# 0.7305
LF-HF 2.674 ± 1.308 3.211 ± 2.255# 0.7305
TINN 287.1 ± 65.03 252.6 ± 81.63* 0.1835
SD1 29.06 ± 8.589 21.65 ± 21.65# 0.0287*
SD2 88.02 ± 23.85 69.48 ± 69.48# 0.0192*
Note: * Signiicant difference between the athlete and sedentary groups (Student's t-test for unpaired samples, p < 0.05). # Signiicant differ-ence between the athlete and sedentary groups (Mann-Whitney t test, p < 0.05), RMSSD (root mean square of the successive differdiffer-ences between adjacent normal RR intervals in a time interval, expressed in ms); SDNN (standard deviation of all normal RR intervals recorded in an interval of time, expressed in ms); HF ( High Frequency); HL ( Low Frequency); SD1 (standard deviation of the instantaneous variability beat to beat), SD2 (standard deviation of the long-term R-R continuous intervals); TINN: (triangular interpolation of intervals); DET (determinism); ApEn (approximate entropy); REC (recurrence rate).
Discussion
The present study verified the variation in spiro -metric parameters before and after the completion of an EIB protocol, comparing athletes and sedentary individuals. Of the 40 individuals assessed, 2 in the sedentary group (11.11%) presented a positive EIB test. Among the athletes there was no positive
bron-chial provocation for the same test, verified through
spirometric parameters.
The study by Teixeira et al. found a higher prevalence of EIB in athletes in cold climates, which may be related to air inspiration in these conditions (9). Similar behav-ior was found when evaluating long distance running athletes, in the same study. However, among the athletes in the present study, EIB was not observed. Perhaps the spirometric characteristic pre exercise that determined a higher prevalence of OVD (probable > FVC in some) in
the population of athletes (10 individuals), influenced
283
75% of the exhalation. Flows present greater vari-ability in normal individuals (27). Spirometry with
abnormal flow was not related to the decrease in FEV1
in a longitudinal study (28). The recording of FEF 25-75% in series could make it more variable, as it should be determined through the same volume of the initial curve, which is not possible in the spirom-etry systems used (3). These reasons could explain the presence of a decrease in FEV1 without changing
the FEF25-75%.
The autonomic modulation, RMSSD and SD1, which characterize the parasympathetic action, were higher in athletes compared to sedentary indi-viduals, suggesting that the parasympathetic activity was increased. These results corroborate previously described studies reporting increased parasympa-thetic activity in athletes (29, 30). There was a lower resting HR in the athletes, indicating a relation of these indices with higher HRV. The increase in vagal activity may be related to the increase in the SDNN and SD2 indices observed in the athletes, indicative of overall variability.
Maladjustments in sympathetic and parasym-pathetic tone can induce disease (14). The greater parasympathetic tone found in the swimmers could be an adjuvant trigger for the OVD found in these patients. The higher the parasympathetic activation, the greater the bronchoconstriction (10). A limita-tion of this study is the limited number of swimming athletes, as it is a population of high-performance
athletes with a specific training workload.
Conclusion
It was observed that the EIB test identified, more
frequently, the presence of bronchospasm in the gen-eral population. Among the swimmers there was a reduction in the FEV1/FVC ratio. There was higher HRV in the population of swimmers studied.
References
1. FitzGerald JM, Bateman ED, Boulet LP, Cruz AA, Inoue H, Haahtela T, et al. Global Innitiative for Asthma. Global strategy for asthma management and prevention: updated 2015 [cited 2015 Jul 6]. Available from: www.ginasthma.org.
The higher prevalence of bronchial asthma found in swimmers (8), which can be seen by the reduc-tion in the FEV1/FVC ratio in those selected in this population, did not influence the incidence of posi -tive bronchoprovocation through exercise. Thus, it is concluded that the trigger mechanism for the OVD found is not exercise.
The opposite can be stated for the sedentary population. This population has a lower prevalence of asthma; however the current study found positive EIB in the sedentary group. In these cases the trig-gering mechanism of bronchospasm was exercise, which differs from the swimmers included.
Despite the absence of positive EIB among the athletes, a reduction in FEV1/FVC was identified in 5 subjects. It is not possible to state that this finding
is sensitive enough to characterize positive EIB, as well as the criteria already established by the FEV1
and FEF25-75%. It is possible that the reduction in the
FEV1/FVC ratio, after the EIB test, efficiently charac
-terized the presence of bronchospasm after exercise, through this parameter in isolation, diagnosing OVD. The reduction in FEV1/FVC in individuals
present-ing FVC > 120% of predicted, may be a physiological variant, in the absence of symptoms and a negative post-bronchodilator spirometry test (16, 17, 18, 19, 20). Therefore, despite 10 individuals (55.5%) among the athletes having been diagnosed with OVD, 8 of these (44.4%) presented FVC > 120% and of these, 5 presented a reduced FEV1/FVC ratio (62.5%).
If athletes who presented OVD and FVC >120% are ex-cluded, 3 athletes (16.6%) with OVD remain, without FVC > 120%, similar to the incidence of OVD found in the sedentary population.
Higher values of FEV1, found in the athletes were
proportional to the greater height also observed in this population, when compared with the group of sedentary individuals. Based on the age of the indi-viduals evaluated in this study, they were in a devel-opment phase. Through physiology constant changes in relation to growth and development take place, depending on genetic factors and extrinsic factors such as physical activity (21, 22, 23, 24, 25, 26).
FEV1 has increased sensitivity to determine OVD
when compared to FEF25-75%; the systems for
obtain-ing these parameters are different. There is time
veri-fication in the FVC maneuver, which determines FEV1.
The FEF25-75% is recorded by calculating the mean flux
284
13. Vanderlei LCM, Silva RA, Pastre CM, Azevedo FM, Go-doy MF. Comparison of the Polar S810i monitor and the ECG for the analysis of heart rate variability in the time and frequency domains. Braz J Med Biol Res. 2008;41(10):854-9.
14. Vanderlei LCM, Pastre CM, Hoshi RA, Carvalho TD, Go-doy MF. Noções básicas de variabilidade da frequên-cia cardíaca e sua aplicabilidade clínica. Rev Bras Cir Cardiovasc. 2009;24(2):201-17.
15. Niskanen JP, Tarvainen MP, Ranta-aho P, Karjalainen PA. Software for advanced HRV analysis. Comput Methods Programs Biomed. 2004;76(1):73-81.
16. Miller A. Spirometry and maximum expiratory flow-volume curves. Pulmonary function tests in clinical an occupational lung disease. Orlando: Grune & Stratton; 1986. p. 15-51.
17. Kivity S, Solomon A, Schwarz Y, Trajber I, Topil-sky M. Evaluation of symptomatic subjects with low forced expiratory ratios (VEF1/VC). Thorax.
1994;49(6):554-6.
18. Mickleborough TD, Stager JM, Chatham K, Lindley MR, Ionescu AA. Pulmonary adaptations to swim and inspiratory muscle training. Eur J Appl Physiol. 2008;103(6):635-46.
19. Rong C, Bei H, Yun M, Yuzhu W, Mingwu Z. Lung function and cytokine levels in professional ath-letes. J Asthma. 2008;45(4):343-8.
20. Miller MR, Hankinson J, Brusasco V, Burgos F, Casaburi R, Coates A, et al. Standardisation of spirometry. Eur Respir J. 2005;26(2):319-38.
21. Fiks IN, Albuquerque ALP, Dias L, Carvalho CRF, Carv-alho CRR. Occurrence of asthma symptoms and of air-flow obstruction in amateur swimmers between 8 and 17 years of age. J Bras Pneumol. 2012;38(1):24-32.
22. Oliveira VV, Isidório UA, Santos WM, Sousa MJS, Olivei-ra AV. Análise compaOlivei-rativa da função respiOlivei-ratória em praticantes de atividade física e indivíduos seden -tários. Enc Bioesfera. 2012;8(15):1920-30.
23. Okura RT, Schivinski CIS. Six-minute walk test in pediatrics: the relationship between performance and anthropometric parameters. Fisioter Mov. 2013;26(1):219-28.
2. IV Diretrizes Brasileiras para o manejo da asma. J Bras Pneumol. 2006;32(Supl 7):S447-74.
3. Pereira CA. Diretrizes para testes de função pulmo-nar. J Bras Pneumol, 2002;28(Supl 3):S1-221.
4. Pedersen SE, Hurd SS, Lemanske RF, Becker A, Zar HJ, Sly PD, et al. Global strategy for the diagnosis and man-agement of asthma in children 5 years and younger. Pediatr Pulmonol. 2011;46(1):1-17
5. Akinbami LJ, Jeanne E, Moorman JE, Bailey C, Zaharan HS, King M, et al. Trends in asthma prevalence, health care use, and mortality in the United States, 2000-2010. NCHS Data Brief. 2012;94:1-8.
6. Harris DJ, Atkinson G. International Journal of Sports Medicine – ethical standards in sport and exercise sci-ence research. Int J Sports Med. 2009;30(10):701-2.
7. Eliasson AH, Philips YY, Rajagopal KR, Howard RS. Sensitivity and specificity of bronchial provocation testing. An evaluation of four techiniques in exercise-induced bronchospasm. Chest. 1992;102(2):347-55.
8. Holzer K, Brukner P. Screening of athletes for exer-cise-induced bronchoconstriction. Clin J Sport Med. 2004;14(3):134-8.
9. Teixeira RN, Teixeira LR, Costa LAR, Martins MA, Mickleborough TD, Carvalho CRF. Exercise-induced bronchoconstriction in elite long-distance runners in Brazil. J Bras Pneumol. 2012;38(3):292-8.
10. Barnes PJ, Thomson NC. Neural and humoral con-trol of airways. In: Barnes PJ, Drazen JM, Rennard SI, Thomson NC. Asthma and COPD: Basic Mechanisms and Clinical Management. 2nd ed. San Diego: Elsevier; 2008. pp. 381-98.
11. Cassol VE, Trevisan ME, Moraes EZC, Portela LOC, Barreto SSM. Broncoespasmo induzido pelo exercí-cio em crianças e adolescentes com diagnóstico de asma. J Bras Pneumol. 2004;30(2):102-8.
285
29. Silva VP, Oliveira NA, Silveira H, Mello RG, Deslan-des AC. Heart rate variability indexes as a marker of chronic adaptation in athletes: a systematic review. Ann Noninvasive Electrocardiol. 2015;20(2):108-18.
30. Aubert AE, Seps B, Beckers F. Heart rate variabil-ity in athletes. Sports Med. 2003;33(12):889-919.
Received in 22/10/2015
Recebido em 22/10/2015
Approved in 07/28/2016
Aprovado em 28/07/2016 24. Orestein DM. Asthma and sports. In: Bar-Or O. The
child and the adolescent athlete. London: Wiley-Blackwell; 1996. p. 433-54.
25. Ram FS, Robinson SM, Black PN, Picot J. Physical training for asthma. Cochrane Database Syst Rev. 2005;(4):CD001116.
26. Courteix D, Obert P, Lecoq AM, Guenon P, Koch G. Ef-fect of intensive swimming training on lung volumes, airway resistance and on the maximal expiratory flow-volume relationship in prepubertal girls. Eur J Appl Physiol Occup Physiol. 1997;76(3):264-9.
27. McFadden ER, Linden DA. A reduction in maxi-mum mid-expiratory flow rate: A spirographic manifestation of small airway disease. Am J Med. 1972;52(6):725-37.