Variations in eating habits between Ecuadorian parents and children related to
excess weight
Natalia Romero - Sandoval 1
Julieta Robles 2
María José Cisneros 3
Virginia Ruiz 4
Miguel Martín 5
1,3,5Escola de Medicina. Faculdade de Ciências Médicas, da Saúdee da Vida. Universidade Internacional doEquador. Av. Jorge Fernández y Simón Bolívar s.n. Quito, Ecuador.CEP: 170113. Email: [email protected]
2Escola de Nutrição. Faculdade de Ciências Médicas, da Saúdeda Vida. Universidade Internacional do Equador. 4 Red GRAAL
Abstract
Objectives: to evaluate the concordance of food consumption habits declared by parents and by their children, and relate it to excess weight prevalence.
Methods: cross-sectional study. Concordance was analysed by Kappa and McNemar tests. The analysis of the discrepancies against excess weight was made by logistic regres-sion.
Results: we found high levels of discrepancy between parents and children: Kappa –0.02-0.31 (p≤0.01), McNemar p≤0.01. Excess weight did not vary in terms of the discrepancies, except for the affirmation of following a diet (ORadjusted: 1.79; CI95%: 1.49-2.14).
Conclusions: agreement between parents and their children demonstrated discordance, but did not influenced on excess weight.
Introduction
Excess weight (overweight and obesity) is defined as an imbalance between intake of food and consumption of the energy which it provides.1This
problem is a very complex one due to the fact that multiple etiologic factors (genetics, psychological, hormonal changes, among others) are involved.2It is
a serious public health problem, not only in medium and high income countries but also in low income countries; particularly among children and adoles-cents.3,4In Ecuador, which in the last nine years has
risen from the low income category to that of medium income and with strong investments in health and education,5 the prevalence of excess
weight in 2012 among the population aged 5 to 11 years was 29.9%, and 26.0% in those aged 12 to 19 years.6The population aged less than 19 years
repre-sents the 30% of the total of ecuadorians.7
During childhood, parents have a strong influ-ence on the food habits of their children, a situation which changes in adolescence, a period in which the individual begins to assume control of their eating. Independently of these characteristics, both periods are crucial in regard to growth and development and both children and adolescents can acquire and/or modify those eating habits which are associated with excess weight.8
Various authors coincide in the definition of eating habits as a set of customs and repetitive mani-festations which condition the way individuals consume food, and are based directly or indirectly on sociocultural practices.9,10
Feeding behavior is a complex phenomenon, based on political, economic, social and cultural conditioning factors. They reflect interactions between people as well as the influences of environ-mental, socioeconomic, cognitive and physiological circumstances. Moreover, seeking food is a biolo-gical necessity, and a response to a series of peri-pheral hormonal signals, constituting a source of pleasure. All these concepts together establish patterns of food consumption.11,12
In a cross-sectional study of school children in the 21 municipal schools in Quito, Ecuador, which included 6,964 students aged 9 to 17 years, the prevalence of excess weight was estimated, and its association with factors such as eating habits, seden-tarism and self-perceived body image. The analysis was performed assuming an error of at most 3%. Details of the study design may be found in publica-tions which derived from it.13-15The overall
preva-lence of excess weight found was 26.6% (CI95% 25.8-27.4), varying with sex and age.13Attending a
school belonging to a low-income city administra-tive district, being from a nuclear family (father, mother and children), eating alone, following a diet, not breakfasting, eating fast-foodand sedentarism were all associated with excess weight.14
Within this line of analysis, and given the funda-mental role of parents in children’s acquisition of eating habits, we invited the parents of the students to participate, with the aim of investigating agree-ments and discrepancies between them in responding to the same questions. Relatively few studies have analysed agreement over eating habits between parents and children, and the relationship of these variables to excess weight.16However, body image
perception and excess weight have been studied following this scheme, and it was found that when children self-perceived themselves as obese, their parents saw them as being of normal weight.17,18
With this background, we proposed to evaluate discrepancies between school children and their parents with respect to eating habits and food frequencies and to assess them in terms of the preva-lence of excess weight among the children. The purpose which justifies this analysis is to obtain information which can contribute to strategies for prevention of excess weight, under the assumption that parents are largely ignorant of the eating habits of their children.
Methods
Observational cross-sectional study. For the present analysis, we selected school children whose parents had completely answered the questionnaire of the aforementioned study (n=4,047/6,964; 58.1%), the parents/tutors were aged between 25 and 74 years, mean 40.0 years (SD 7.0), while the 75th percentile fell at 46 years of age for men, and 43 years for women. In total, there were 2794 mothers/tutors (70.1%), with ages ranging from 25 to 74 years, mean 39.3 years (SD 6.8).
A self-administered questionnaire was completed by parents and their children.19,20The
questionnaire was sent in a sealed envelope to the parents who answered it at home, and returned it to the school via the children, within a fortnight. The same questionnaire was answered in class by the children, in the presence of their teacher and a trained researcher. Parents and children who accepted voluntarily to participate in the study signed an informed consent, and the data were analysed anonymously.
answers being yes or no. Frequencies of consump-tion of fruit, vegetables and unhealthy foods (snacks, sugar-containing drinks, fast-food, and sweets/ cakes) were originally assessed in terms of five cate-gories (very often / often / occasionally / hardly ever / never), subsequently re-categorised into two options with the aim of obtaining a multi-dimen-sional table with an analysable number of situations, given the quantity of available data. The variable ‘discrepancy of risk’ was constructed based on the level of agreement between answers given by parents and by their children. Table 1 presents the definitions of study variables, of the level of discre-pancy considered to be of risk, and the absolute frequency of valid responses.
Excess weight was defined, based on World Health Organization criteria (≥ 85th percentile
specific to each age group and sex),21in two
cate-gories (present, absent); children were grouped into two age ranges (9 to 12 years, and 13 to 19).
The statistical analysis consisted of three parts: 1) Analysis of a possible non-response bias in terms of sex, age, excess weight, family type and siting of the school within the administrative zone. It was assumed that differences under 3%, even if statisti-cally significant, were not relevant to the present study.
2) Analysis of the discrepancies, between parents and their children, in their responses to the six varia-bles under study. Differences between two opinions about the same topic always involve random agree-ment/disagreement, and hence we conducted a
Kappa analysis, which identifies concordances
beyond what would be expected by chance.22
Similarly, discrepancies between opinions were contrasted using the McNemar exact test (exact binomial p), which determined trends in the discre-pancy, beyond what would be attributable to chance. 3) Analysis of the association between the categories of discrepancy considered to be “of risk” or other-wise, in regard to excess weight, using bivariate models. The strength of association was expressed as a crude Prevalence Ratio (PR), and crude Odds Ratio(OR). A logistic model was fitted to study the associated OR between the phenomenon of excess weight of children, and the discrepancies of risk present between parents and their children, adjusting for age and sex of the child, and for sex of the parent.
Results
Analysis of non-response bias
The non-response rate was 41.9% of the 6,964 students who had participated in the original study.
Among female students, the participation rate of parents was 60.1%, whereas among parents of males it was 55.9% (χ2= 12.0; p<0.01). Among male
students aged 9 to 12 years it was 59.5%, compared to 51.2% among those aged 13 to 17 years (χ2=
22.43; p<0.01) while among female students, the
corresponding figures for the two age groups were 60.4% and 59.7%, respectively (χ2= 0.19; p=0.67).
There were no significant differences in response rates of parents in terms of the variables excess weight, family type, whether the student ate break-fast or not, followed a diet, ate alone, ate fruit, ate vegetables or ate unhealthy foods.
Analysis of discrepancies between parents and children
The analysis of discrepancies in responses between parents and children showed that children who declared not eating breakfast while their parents declared they did was 3.7% (148/4,039) whereas the discrepancy between children who declared eating breakfast but whose parents said the opposite was 9.7% (392/4,039). Regarding children who reported following a diet while their parents said they did not, the discrepancy was 13.9% (575/4,140), whereas for the reverse situation the figure was 6.3% (260/4,140). In regard to eating alone, 21.0% of chil-dren declared they did while their parents declared the opposite (872/4,153), whereas the discrepancy between children declaring they did not eat alone while their parents declared the opposite was 9.8% (406/4,153). McNemar test results were significant for all three of these analyses (p<0.01).
Regarding consumption of fruit, the proportion of children who declared they did while their parents said they did not was 22.6% (847/3,750) and for the reverse situation the figure was 9.0% (338/3,750). For vegetables 18.2% (681/3,734) declared consuming while their parents said they did not, and 14.7% (550/3,734) of children said they did not, but their parents declared they did. Finally, 71.9% (2,722/3,787) of the children declared not consuming unhealthy foods although their parents answered that they did, whereas the figure for the reverse situation was 3.3% (126/3,787). Again, in all three situations, the McNemar test detected an asym-metry which would not be expected by chance,
p<0.01.
In the six variables studied, agreement between parents and their children in their opinions presented
Kappavalues ranging between –0.02 and 0.31, all of which were significant (p<0.01), and indicative of a
Table 1
Definitions of study variables, and absolute frequencies of valid responses for the calculation of a ‘discrepancy of risk’.
To eat some solid food before 10am, regularly
To follow some special type of diet
To eat main meals without being accompanied by other people such as friends or family
Freq. of eating edible fruits of cultivated plants
Freq. of eating edible vegetables of cultivated plants
Freq. of consuming snacks, sweetened drinks, fast food, sweets/cakes
Definition
Definition of the level of discrepancy considered
to be at risk
Absolute frequency of valid responses
(%)
Parents say yes, their child says no
Parents say no, their child says yes
Parents say no, their child says yes
Parents say yes, their child says no
Parents say yes, their child says no
Parents say no, their child says yes
4,040 (99.8)
3,901 (96.4)
3,659 (90.4)
3,750 (92.7)
3,735 (92.3)
3,787 (93.6) Eat breakfast
Follow a diet
Eat alone
Frequency of eating fruit
Frequency of eating vegetables
Frequency of eating unhealthy foods
Variable
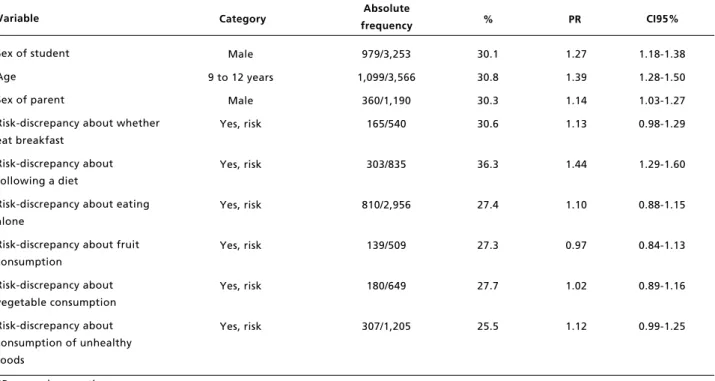
Table 2
Two-way associations between excess weight and factors under study.
PR= prevalence ratio.
Male
9 to 12 years
Male
Yes, risk
Yes, risk
Yes, risk
Yes, risk
Yes, risk
Yes, risk
Category Absolute
frequency CI95%
979/3,253
1,099/3,566
360/1,190
165/540
303/835
810/2,956
139/509
180/649
307/1,205
1.18-1.38
1.28-1.50
1.03-1.27
0.98-1.29
1.29-1.60
0.88-1.15
0.84-1.13
0.89-1.16
0.99-1.25 Sex of student
Age
Sex of parent
Risk-discrepancy about whether eat breakfast
Risk-discrepancy about following a diet
Risk-discrepancy about eating alone
Risk-discrepancy about fruit consumption
Risk-discrepancy about vegetable consumption
Risk-discrepancy about consumption of unhealthy foods
Variable % PR
30.1
30.8
30.3
30.6
36.3
27.4
27.3
27.7
25.5
1.27
1.39
1.14
1.13
1.44
1.10
0.97
1.02
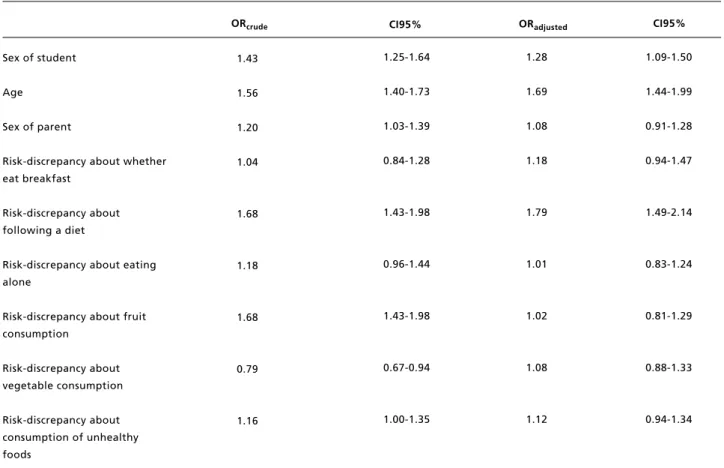
Table 3
Multivariate associations between excess weight and factors studied.
Baseline category: female student, 13-17 years, mother, no risk-discrepancy. 1.43
1.56
1.20
1.04
1.68
1.18
1.68
0.79
1.16
ORcrude CI95% CI95%
1.25-1.64
1.40-1.73
1.03-1.39
0.84-1.28
1.43-1.98
0.96-1.44
1.43-1.98
0.67-0.94
1.00-1.35
1.09-1.50
1.44-1.99
0.91-1.28
0.94-1.47
1.49-2.14
0.83-1.24
0.81-1.29
0.88-1.33
0.94-1.34 Sex of student
Age
Sex of parent
Risk-discrepancy about whether eat breakfast
Risk-discrepancy about following a diet
Risk-discrepancy about eating alone
Risk-discrepancy about fruit consumption
Risk-discrepancy about vegetable consumption
Risk-discrepancy about consumption of unhealthy foods
ORadjusted
1.28
1.69
1.08
1.18
1.79
1.01
1.02
1.08
1.12
Association between discrepancies and excess weight
Table 2 presents the results of the two-way relation-ship between discrepancies considered to be ‘at risk’ and excess weight, age, sex of students and sex of the responding parent. In this part of the analysis, we found the highest prevalence of excess weight: among male students (31.6%; PR= 1.30; CI95%=1.17-1.43), in the group aged 9 to 12 years (32.7%; PR= 1.49; CI95%= 1.35-1.66), and when the parent who responded was the mother (67.3%; PR= 1.14; CI95%= 1.03-1.27). Among the group of children who declared consuming unhealthy foods, and whose parents declared that they did not, there was a 12% higher probability of presenting excess weight (28.5%; PR= 1.12; CI95%= 0.99-1.25).
Table 3 presents the results of the multivariate analyses between the factors under study and excess weight. It may be observed that age between 9 and 12 years, male sex of the student and presence of a
‘discrepancy of risk’ regarding the child following a diet, remained significant after adjusting for the other factors, and that sex of the responding parent lost its significance.
Discussion
The analysis reported in this article, which involved a set of school children who presented a similar prevalence of excess weight to the official figures, found that participation of parents was not homoge-neous, defined in terms of the characteristics analysed in their children.
below the margin of precision (3%) defined in the original study.
The greater presence of mothers in the group of children aged 9 to 12 years could be reflecting the role of the woman as carer, taking responsibility for the child’s health and the feeding of the family,23
while with the group of older children, participation of both parents decreased, indicating an increase in the degree of independence attributed to adolescents. These initial findings were the motivation for our wanting to analyse knowledge about eating attitudes which the parents have of their children, with the purpose of studying a future improvement in obesity prevention policy, not only targeting school children but also their parents. The justification of this idea is that it has been consistently demonstrated that, compared to obesity in early childhood, obesity in adolescence is a strong predictor of obesity in adult-hood, the probability that obesity in adolescence will persist in adulthood having risen by 80%.24
Given our findings, the discrepancy regarding eating habits declared by children and what their parents believe shows, apart from a technically low concordance, a tendency in the discrepancy which conceptually represents an increased risk of obesity. In summary, considerable ignorance was found among parents with regard to whether their children eat healthily (fruit and vegetables), eat breakfast or not, follow a diet or not, and whether they eat alone or not. Without these data it would be very difficult to visualise the ignorance of parents about their chil-dren’s eating habits. This represents a prior condi-tion to accepting that there is a problem (obesity) and a proposal of solutions (public health policies, primary, secondary and tertiary preventive actions; cure and rehabilitation).25,26
In other words, the disagreement found between parents and children in studies dealing with areas such as nutrition, physical activity and eating habits at home reported by other studies, such as, for example, that parents see their obese children as normal in terms of weight and height, or dealing with disagreement between parents with respect to pressures in the feeding of their adolescent chil-dren,16,27is a complex topic, given that a preventive
focus on family eating habits should target all family members, involving them in actions to change habits and/or promote improvements.
The findings in this study, of non-existent or poor agreement, are due to the proportion attribu-table to chance of the observed concordance having been removed, since without this correction the concordance would be considered naive.
Of all discrepancies considered to be risky,
analysed here, only that of children affirming they follow a diet, without their parents knowing about it, was associated to more obesity in the children (PR= 1.44; CI95%= 1.29 – 1.60). The other discrepancies were not associated with excess weight, an aspect which is alarming since in some way it reflects the fact that risky eating behaviours declared by children are the ones that, in the end, condition the presence of excess weight.
This reality conditions the educational strategies with parents, since on one hand they do not really know how their children eat in general, something which could be considered as a lack of interest on behalf of the parents for their adolescent children’s eating habits, that the children do not follow norms (disobedience), and on the other hand it shows that it is necessary to deal with the effects of these facts on the health of their children.
In the multivariate model the significant relation-ships of child sex and age with excess weight persisted, as also found by earlier analyses which did not take parents into account. The effect of the discrepancy regarding following a diet did not change significantly after being adjusted for the remaining variables, and the only term losing signi-ficance being the sex of the participating parent (ORcrude= 1.20; CI95%= 1.03-1.39, ORadjusted= 1.08;
CI95%= 0.91-1.28).
It has been seen that eating practices and styles of parents are not associated with children’s diet quality or their weight status; however, children’s eating behaviors are found to be associated to lower BMI if they are related with parents’ eating prac-tices.28-29
This study has the following limitations: 1) we have no socio-economic information about parents which could be influencing the rate of non-response, as well as the responses themselves; 2) we do not know the marital status of the participating parent, so it is difficult to assess different situations regarding caring for children , which could arise in single-parent families, nor do we know if the parents who participated live full-time with their children; 3) finally, the ethical requirements of the study impede the identification of siblings among the children, hence in some cases it is difficult to identify parent’s responses.
other discrepancies tended to be borderline. Finally, identification of these discrepancies is fundamental in order to direct future educational and preventive
interventions, whether in academic or health settings.
Referências
1. Komaroff M. For Researchers on Obesity: Historical Review of Extra Body Weight Definitions. J Obes [periódico online]. 2016 [acesso em 23 jun 2016]; 2016. Disponível em: http://www.ncbi.nlm.nih.gov/pmc/arti-cles/PMC4904092/
2. Mathews EK, Wei J, Cunningham SA. Relationship between prenatal growth, postnatal growth and childhood obesity: a review. Eur J ClinNutr [periódico online]. 2017 [acesso em 3abr 2017]; 2017. Disponível em: http://www.nature.com/ejcn/journal/vaop/ncurrent/ full/ ejcn2016258a.html
3. Bibiloni MDM, Pons A, Tur JA. Prevalence of Overweight and Obesity in Adolescents: A Systematic Review. Hindawi Publ Corp. 2013. Doi:10.1155/2013/392747
4. Rivera J. Á, de Cossío T. G, Pedraza L. S, Aburto T. C, Sánchez T. G, Martorell, R. Childhood and adolescent over-weight and obesity in Latin America: a systematic review. Lancet Diabetes Endocrinol. 2014; 2 (4): 321-32. 5. Malo-Serrano M, Malo-Corral N. Reforma de salud en
Ecuador: nunca más el derecho a la salud como un privi-legio. Rev Peru Med Exp Salud Pública. 2014; 31 (4): 754-61.
6. Encuesta Nacional de Salud y Nutrición – ENSANUT | Ministerio de Salud Pública [periódico on line]. [acesso em 15 nov 2015]. Disponível em: http://www.salud.gob.ec/ encuesta-nacional-de-salud-y-nutricion-ensanut/
7. Censo de Población y Vivienda 2010. Instituto Nacional de Estadísticas y Censo de Ecuador. Ecuador [periódico on line]. [acesso em 24 jun 2016]. Disponível em: http://www.inec.gob.ec/cpv/
8. Moreno L. A, Rodriguez G, Fleta J, Bueno-Lozano M, Lazaro A, Bueno G. Trends of DietaryHabits in Adolescents. Crit Rev Food Sci Nutr. 2010; 50 (2): 106–12. 9. Valdés J, Rodríguez Artalejo F, Aguilar L, JaénCasquero M.
B, Royo‐Bordonada M. Á. Frequency of family meals and childhood overweight: a systematic review: Family meals and children overweight. PediatrObes. 2013; 8 (1): e1–13. 10. Rodrigo CP, Escauriaza BA, Aranceta J, Allúe IP.
Evaluación de la ingesta en niños y adolescentes: proble-mas y recomendaciones. RevEspNutr Comunitaria. 2015; 21 (Supl. 1): 72–80.
11. Macias A.I, Gordillo L.G, Camacho E.J. Hábitos alimenta-rios de niños en edad escolar y el papel de la educación para la salud. Rev Chil Nutr. 2012; 39 (3): 40–3.
12. Domínguez-Vásquez P, Olivares S, Santos J.L. Influencia familiar sobre la conducta alimentaria y su relación con la obesidad infantil. Arch Latinoam Nutr. 2008; 58 (3): 249. 13. Romero-Sandoval N, Ruiz Vinueza V, Quizanga J, Recalde
R, Anchali E, Falconí J, Flores O, Martín M. “Quito muni-cipal schools” cohortstudy: Baselineresults. Open J Epidemiol. 2012; 2 (3): 70-4.
14. Romero-Sandoval N, Guanopatin A, Gallegos G, Collaguazo A, Sáenz P, Latorre V, Egas V, Flores O, Utzet M, Martín M. Breakfast habits and family structure associa-ted with overweight and obesity in general basic students, Ecuador. Br J Med Med Res. 2013; 3 (1): 128-39. 15. Romero-Sandoval N, Flores O, Egas C, Villamar G, Larrea
Z, Cruz M, Icaza L, Martín, M. Quito Municipal Schools— Cohort Study: Self-Perception of Body Image and Factors Related with It. Open J Epidemiol. 2014; 4:122-28. 16. Hirschler V, Gonzalez C, Talgham S, Jadzinsky M. Do
mothers of overweight Argentinean preschool children perceive them as such? Pediatr Diabetes. 2006; 7 (4): 201-4.
17. Lim C.S, Schuman S.L, Crawford M.J, Silverstein J, Janicke D.M. Child and Caregiver Reports of Weight Control Behaviors in Pediatric Obesity. Child Obes Former Obes Weight Manag. 2012; 8 (5): 477-483.
18. Wen X, Hui S.S.C. Chinese parents’ perceptions of their children’s weights and their relationship to parenting behaviours: Parents’ perception of children’s weight and parenting behaviours. Child Care Health Dev. 2011; 37 (3): 343-51.
19. Manual de Instrumentos de Evaluación Dietética. Publicación INCAP No. 16. Publicación INCAP MDE/156. Guatemala: Instituto de Nutrición de Centro América y Panamá [periódico on line]. [acesso em 24 jun 2016]. Disponível em: 9http://www.incap.int/index.php/es/publi- caciones/doc_view/77-manual-de-instrumentos-de-evalua-cion-dietetica
20. Encuesta Nacional de salud-Cuestionario de Menores. España: Ministerio de Sanidad y Consumo-Instituto Nacional de Estadísticas [periódico on line]. [acesso em 24 jun 2016]. Disponívelem: http://www.msssi.gob.es/ estadEstudios/estadisticas/encuestaNacional/encuesta2011. htm
21. De Onis M, Onyango A.W, Borghi E, Siyam A, Nashidaa C, Siekmanna J. Elaboración de un patrón OMS de cre-cimiento de escolares y adolescentes. Bull World Health Organ. 2007; 85: 660-7.
22. Zidan M, Thomas RL, Slovis TL. What you need to know about statistics, part II: reliability of diagnostic and screening tests. Pediatr Radiol. 2015; 45 (3): 317-28. 23. Gil-Romo S.E.P, Coria S.D-U. Food and nutrition studies in
Mexico: a gender perspective. Salud Pública México. 2007; 49 (6): 445-53.
25. Lobstein T, Jackson-Leach R, Moodie M.L, Hall K.D, Gortmaker S.L, Swinburn B.A, James P, Wang Y, McPherson K. Child and adolescent obesity: part of a bigger picture. Lancet. 2015; 385 (9986): 2510-20. 26. Royo-Bordonada M.Á. Can the advertising and food
indus-tries help prevent childhood obesity and promote healthy lifestyles? Gac Sanit. 2013; 27 (6): 563.
27. Gordon NP, Mellor RG. Accuracy of parent-reported infor-mation for estimating prevalence of overweight and obesity in a race-ethnically diverse pediatric clinic population aged
3 to 12. BMC Pediatr. 2015; 15 (1): 1.
28. Vollmer R.L, Mobley A.R. Parenting styles, feeding styles, and their influence on child obesogenic behaviors and body weight. A review. Appetite. 2013; 71: 232-41.
29. D’Avila GL, Müller R.L, Gonsalez P.S, Vasconcelos FAG. The association between nutritional status of the mother and the frequency and location of and company during meals and overweight/obesity among adolescents in the city of Florianópolis, Brazil. Rev Bras Saúde Matern Infant. 2015;15 (3): 289-99.