A METHODOLOGY FOR IDENTIFICATION AND ANALYSIS OF CITY SHRINKAGE EFFECTS IN URBAN MORPHOLOGY AND LANDSCAPE
DOI: http://dx.doi.org/10.18509/GBP.2017.18 UDC: 711.6:911.372 Eduardo Brito-Henriques
Paulo Morgado
CEG/IGOT, Universidade de Lisboa (Centre for Geographical Studies / Institute of Geography and Spatial Planning, University of Lisbon), Portugal
ABSTRACT
Shrinking cities are one of the most topical issues in urban studies nowadays. However, studies on the consequences of urban shrinkage on landscape are not numerous. In this paper, a methodology for identifying and analyzing the effects of urban shrinkage on urban morphology and urban landscape is presented. Its purpose consists of identifying ruins and vacant lands through remote sensing operating upon open-source data. An example of application to a Portuguese shrinking city is also presented.
Keywords: Ruins, vacant lands, shrinking cities, remote sensing
INTRODUCTION
Wars and cataclysms typically have devastating effects in urban fabric. Yet, these sort of extraordinary and disrupting events are not the only motives of city ruin nowadays. Urban shrinkage is a major reason for that too: economic restructuring, social changes and political shifts have impact on land uses and may provoke abandonment, destruction and the replacement of buildings and infrastructures [1]. Dereliction and ruination have thus become fairly common realities in contemporary cities [2].
Although ruins and vacant lands are common occurences in the present-day cityscape, little attention has been devoted to their study in Human Geography and Urban Studies. Since there is no data on this topic in the census, urban planners normally do not know how many ruins and vacant lands there are, where they are, and how much area they occupy in cities [3]. The level of inacquaintance about them is noteworthy.
This paper seeks to reverse that situation by presenting a methodology for identifying ruins and vacant lands in urban areas. This methodology is remote sensing & GIS based in operating upon open-source data and technology. It has been developed under the Project NoVOID (PTDC/ATP-EUR/1180/2014), sponsored by the FCT – Fundação para a Ciência e Tecnologia, the national funding agency for science and research in Portugal, and was successfully applied to a small number of Portuguese shrinking cities.
The paper is organized as follows. The first section sets the conceptual framework and presents a brief review of related research in order to summarize the earlier conceptual and methodological approaches to derelict sites and vacant lands. It is followed by an explanation of our methodology. Special emphasis is placed on describing in detail the data collection methods. Finally, an example of its application on a Portuguese shrinking city – Barreiro – is presented and the findings are discussed.
RELATED RESEARCH AND CONCEPTUAL FRAMEWORK
As pointed out in the literature, there is no universally accepted definition for urban derelict spaces and vacant lands [4]. Concepts fluctuate among the few studies that have been published on this issue during the years. Abandoned and dilapidated buildings and infrastructures, razed constructions, unconcluded estates and empty lots have been merged under broad and rather imprecise designations such as “vacant lands”, “abandoned lands”, “wastelands”, or “TOADS” – an acronym for Temporarily Obsolete Abandoned Derelict Sites [3][5].
Wasteland is a vague term often used in scientific literature, journalism, and fiction to describe abandoned and remnant land in urban areas. The concept usually embraces the old industrial areas with contaminated soil, i.e. brownfields, but no consensus exists on this. Some authors used brownfield as synonym to unused open space in built-up areas, reserving wasteland to designate huge land areas with no use located in the outskirts of the city [6].
Dissonances also exist regarding the other concepts. While abandoned land was defined by some authors as lots or buildings that have been vacant for two years or more, others accept a vacancy for just 60 days or longer [3], and others consider as abandoned land “any parcel that previously has had an agricultural use (either arable, pasture, orchards, etc.), and has been unutilized or underutilized for more than three years” [7], which means that only lots with no buildings were considered. TOADS concept, for its part, encompasses empty lots as well as parcels where abandoned and derelict constructions exist, but other authors have preferred separating vacant lands and abandoned structures in two different subcategories [3][8].
Although vacant land has been identified by remote sensing and through land use data in the majority of previous surveys, abandoned structures have been assessed mostly through indirect sources, such as postal service information on addresses not collecting mail [3]. This situation translates, as some authors pointed out, into “inconsistent definitions, with the same kinds of structures being considered abandoned in one city and not in another” [8]. Furthermore, there is a lack of comprehensive and uniform criteria to visually identify derelict sites in the landscape.
Our proposal aims at overcoming those difficulties by defining four categories of abandoned sites in urban areas according to morphological criteria. Those four categories are: a) ruins; b) ruinyards; c) suspended/aborted projects; and d) vacant land.
Since abandoned structures may not hold discernable signals nor are easily detected in the landscape, ruins were assumed as the chief expression of dereliction in our survey. For the sake of defining them, ruins may be described as structures produced by technology and intended for human use or for other purposes that have reached an advanced state of dilapidation, being therefore incapable of performing the function for which they were originally designed. They are characterized by being partially or fully destroyed (e.g. lack of windows, doors, or other physical components, damaged roofs, broken walls) and by being abandoned (i.e. not having regular conventional use). Included in this category are boarded up buildings, even though they strictly are not in a ruinous state.
area bigger than the one of the dilapidated buildings to which they are associated; otherwise, they are considered part of the same ruin.
Suspended/aborted projects are defined as buildings whose construction work have been interrupted and remain unfinished or half-finished, as well as lots where urbanization processes were suspended, i.e. which have not been fully developed, yet present evidence of infrastructures in the form of streets, lighting poles, lift stations or others; in other words, they correspond to “ruins in reverse” [2], i.e. constructions that do not fall into ruin after they are built but rather before they are finished.
Finally, vacant land is defined in this study as unutilized, non-cultivated, non-landscaped, and non-built up land, with shrub and herbaceous covering showing signs of neglect and lack of maintenance, or presenting bare soil, rubble, and vestiges of razed buildings. Only the vacant land located inside official urban areas was contemplated in our approach. Land zoned for agricultural use and for green infrastructure was not considered vacant land.
A METHODOLOGICAL PROPOSAL TO SCAN RUINS AND VACANT LANDS IN URBAN AREAS
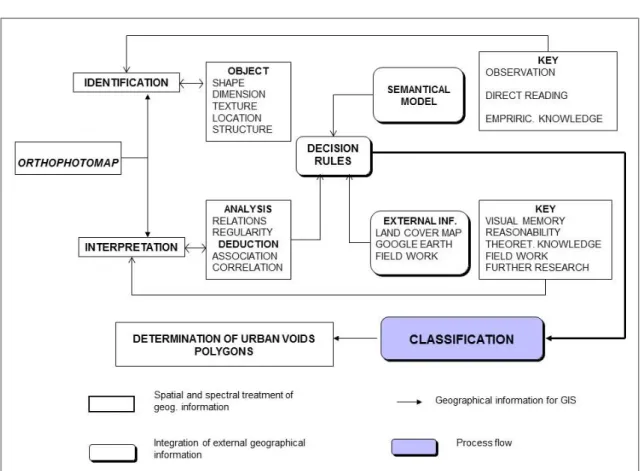
Due to the large data sets available and superpower technologies people nowadays are keen to use them, taking for granted that new technologies simply mean better technologies and therefore better results. Although, ground-based true soon or later drives researcher’s attention trough misleading results due to unsuitable methods. Different territory, different data, different subjects call for specific methods and technologies. In this article, instead of using high-resolution satellite images and supervised image classification or even object-oriented classification, to scan the four categories of abandoned sites in urban areas according to morphological criteria, we chose classic methods of photo-interpretation and photo-identification. Through a friendly graphic user interface GIS environment of a free software (Quatum GIS) and using cities’ orthophotos available on the Portuguese Directorate-General for Territory (DGT – Direcção Geral do Território) web server (fig. 1), that we have linked through url. We have come to what we consider to be very reliable results.
Many authors in the past have compared the strengths and weakness of both methods: satellite image classifications versus photo-interpretation. Some of the biggest disadvantages of photo-interpretation are the costs (we need several aerial photos to cover the same amount of territory captured by only one satellite image) and time-consuming (an unsupervised image classification, depending on the image size and machine performance is a matter of minutes; photo-interpretation for the same piece of territory can take a week). Although, with the current Open data policy (http://www.igeo.pt/) carried out by most EU governments cost are no longer the main issue, however, its time consuming nature is still our Achilles heel. When it comes to scanning for just a few classes (four categories of abandoned sites in urban areas) the balance between the two methods can easily pend to photo-interpretation. When compared, photo-interpretation results are much more fitted to reality and at this urban scale (city of Barreiro have an area of 67km2) accuracy is precious.
Figure 1. Photo-interpretation and photo-identification process
Another reason that made us decide to opt for photo-interpretation was the fact that some of the above mentioned four categories, cannot be determine by vertical observation (ruins and ruinyards). We also need horizontal observation or even 3D observation, to observe the buildings from several angles. Therefore, neither satellite classification nor classical vertical interpretations suited our needs. But, by doing photo-interpretation in a GIS environment, and due to interoperability, we were able to simultaneously use Census data and Street view to clarify most of our doubts. Finally, and whenever some tasks became impossible even by using Street view, we did some fieldwork.
Thus, the methodology we have developed comprises two steps. Step 1 consists of identifying the quarters in city were empty homes and dilapidated residential buildings exist according to Census data. Census data informs on the quarters where these situations occur but do not detail which buildings are ruins. Besides, no information exists on vacant lands in Census. Step 2, finally, corresponds to the identification of derelict sites and to the polygon digitalization combining aerial and horizontal photo-interpretation.
As previously said data is critical. Maybe that is why methods should also be carefully chosen and applied. Being that nowadays the quality of data is heavily determined by the available technology, for this article we have chosen photo-interpretation as the main method for capturing data and GIS for gathering and analyzing it. As it happens with most
data, e.g. downscaling techniques, creative data, random data, etc., but to have real data there is no other way to do it than to do it yourself.
Therefore, for our project we have data from different sources and we use it in different steps of the methodology roadmap guarantying a workflow throughout the project, and to be able to accomplish two main objectives: build a Geographic Data Base that could be continuously developed for the querying and analyzing of abandoned urban structures; and set the ground for some spatial and statistical analysis that allow us to get some answers about the causes of their existence and if there are some space-time reasons behind it.
After having identified and mapped the ruins, suspended/aborted projects, and vacant land, our next concern will be the description and analysis of the different sort of polygons found in order to characterize the urban morphology of shrinking cities. Thus, next steps of research can be categorized into two levels of analysis. First level, group the area metrics which are basic area measures and statistics, such as average, median, standard deviation and counting the number of polygons for each one of the four categories of abandoned sites; second level of analysis will be about spatial distribution and neighborhood influence. That will require for spatial statistics such as mean center and standard deviation ellipse, and distance analysis; to measure neighborhood spatial influence, autocorrelation Getis-Ord cluster analysis will be the selected method.
AN APPLICATION IN BARREIRO, PORTUGAL
An application of the above-described methodology to the city of Barreiro, Portugal, will now be presented.
Barreiro is an old industrial city located in the Lisbon metropolitan area, just in front of the Portuguese capital city, on the Tagus estuary’s south bank (Fig. 2). Barreiro is 9 km southeast from Lisbon by ferryboat and about 40 km driving. It is an old industrial city belonging to the Lisbon’s rustbelt that turned into a perfect example of a shrinking city in Portugal.
Two decisions were crucial for the urban development of Barreiro, which was initially an insignificant seamen’s settlement along the smooth shores of the Tagus estuary. The first one was the choosing of Barreiro to railhead the Southern Portugal Railway in 1861. Because of that, Barreiro became an important interchange station between Northern and Southern Portugal and the main place for train repair shops in the country. The second one was the opening of CUF factories in Barreiro in 1908. CUF – Companhia União Fabril was the largest Portuguese industrial company, which had opened as an oil refining and agrochemical manufacturer and developed into a huge conglomerate operating in a large assortment of activities (textiles, beverages, mining, cement, petrochemicals, metallurgy, shipbuilding, insurance, banking, hospitals, etc.). At its apogee, in the 70s, CUF represented about 5% of the Portuguese GDP; its main industrial park alone, located in Barreiro, employed more than 8 thousand workers at the time.
Figure 2. The city of Barreiro, Portugal
Since the 70s, Barreiro has deindustrialized brutally. While 60,7% of Barreiro municipality’s employment was concentrated in the manufacturing sector in 1960, it decreased to 47,8% in 1981, and to 19,1% in 2011. Simultaneously, population has shrunk dramatically: Barreiro municipality lost about 10 thousands inhabitants from 1981 to 2011 (-10,5%).
Using the methodology that we have developed, a total of 582 polygons were digitalized in the city of Barreiro, matching the four categories of abandoned spaces formerly defined (fig. 3). Ruins were the kind of abandoned space that we have most frequently found; 368 structures in ruins were identified, occupying 13.7 ha. If ruinyards are added to ruins, the
Figure 3. Derelict sites in the city of Barreiro, 2014
Vacant lots are quite less numerous than ruins, nevertheless they occupy a much bigger area. Indeed, a quite impressive portion of 29% of Barreiro’s urban area is vacant land. Huge spots of vacant land, sometimes with several hectares, subsist inside the borders of the city. Some only consist of dirt or bare soil, others are covered by wild vegetation, mostly meadow-grasses and herbs, and in more rare incidence bushes and trees. Although small spots of vacant land appear in residential areas, related to land with recently razed buildings and to parcels held for speculation or left over from earlier development, large lots of vacant land exist in old industrial areas and are associated to disused railways. Soil contamination is a major problem in a number of these urban vacancies, particularly in the former-industrial park of CUF.
Finally, suspended/aborted projects represent a very residual part of derelict sites in Barreiro. However, they have an average size greater than ruins, what can be understood as a signal that large projects appear to be more fragile or vulnerable to turning into “ruins in reverse”.
FINAL REMARKS
There isn’t a method better than other. All methods are valid, although some methods fit better some realities than others. That said, it’s our empirical conviction that the adopted method for detecting abandoned urban sites in shrinking cities in Portugal is the method that best suits our reality. We are in train of do some calibration and verify how much our method fit reality. We have chosen randomly 20% of city territory and we are confronting
our method results with two other methods, fieldwork survey and high-resolution satellite image object-oriented classification. Although the work is still on going, namely the satellite image classification, just by compare our method results with fieldwork results, we get more than 90% accuracy, which scientific tell us that we have made the right option. Although photo-interpretation and photo-identification is high time-consuming, whenever data accuracy is critical to a project, there is no doubt that this is still the more reliable method; naturally, photo-interpreter experience (which means knowing the subject under analysis, knowing the territory, and knowing the photo-interpretation techniques) is a shortcut to finest results.
Acknowledgements. This research has been sponsored by Portuguese national funds through the FCT – Fundação para a Ciência e a Tecnologia, I.P., under the Project PTDC/ATP-EUR/1180/2014 (NoVOID - Ruins and vacant lands in the Portuguese cities).
REFERENCES
[1] Rieniets T. Shrinking cities: causes and effects of urban population losses in the twentieth century, Nature and Culture, 4 (3), pp. 231-254, 2009;
[2] DeSilvey C, Edensor T. Reckoning with ruins. Progress in Human Geography, 37 (4), pp. 465-485, 2013;
[3] Newman G. et al. A current inventory of vacant urban land in America. Journal of
Urban Design, 21 (3), pp. 302-319, 2016;
[4] Pearsall H, Lucas S, Lenhardt J. The contested nature of vacant land in Philadelphia and approaches for resolving competing objectives for redevelopment. Cities, 40 (B), pp. 163-174, 2014;
[5] Greenberg M et al. The TOADS: a new American epidemic. Urban Affairs Review, 25 (3), pp. 435-454, 1990;
[6] Qureshi S, Breuste J. Prospects of biodiversity in the mega-city of Karachi, Pakistan: potentials, constraints and implications. In Müller N, Werner P, Kelcey J. G. (Eds.),
Urban biodiversity and design, Oxford: Wiley-Blackwell, pp. 497-517, 2010;
[7] Gradinaru S R et al. Land abandonment as a precursor of built-up development at the sprawling periphery of former socialist cities. Ecological Indicators, 57, pp. 305-313, 2015;
[8] Pagano M A, Bowman A. Vacant land in cities: an urban resource, Brookings Center on Urban & Metropolitan Policy Survey Series, Dec. 2000, retrieved from The Brookings Institution: www.brookings.edu/research/vacant-land-in-cities-an-urban-resource