School of Economics and Management
TECHNICAL UNIVERSITY OF USBON
MODELING A GLOBAL SUPPLY CHAIN FOR A TWO-WHEELER
MANUFACTURER
Rameshwar Dubey
University of Petroleum & Energy Studies, Dehradun.
Saurabh Tiwari
University of Petroleum & Energy Studies, Dehradun.
Abstract
The research paper explores how simulation modeling helps to design a global supply chain by minimizing Forrester effects. The simulation results show through a case study how one of the leading two-wheeler manufacturing companies in India could improve its innovative product forecasting and reduce the risk from currency fluctuations.
Keywords: Global Supply Chain, Forrester Effect, System Dynamic modeling and Supply Chain Risk.
JEL Classification: MlO, 014.
INTRODUCTION
Globalization is affecting every industry. Trade barriers between different geographical areas continue to diminish, the customer base is becoming more global, appropriate suppliers are sought all around the world, and innovations in information technology are removing the restrictions of time and space (Bowersox & Closs, 1996; Ferdows, 1997). These issues, among others, force companies to rethink the success factors in their industry. Multinational companies with global operations are present in all markets, trying to take advantage of the possibilities
Correspondence Address: Rameshwar Dubey- University of Petroleum & Energy Studies- Dehra-dun. E-mail: [email protected]
the phenomenon offers (Christopher, 1998: 127). All companies are striving in a more competitive market where new entrants with different cost structures are changing the principles of the game. The increasing competition is driving com-panies to become more innovative in creating value for the customer while work-ing more efficiently to attain cost effectiveness in operations (Hoover, Eloranta, Holmstrom & Huttunen, 2001; Heikkila & Ketokivi, 2005). Global markets offer tremendous possibilities, but at the same time they raise many challenges. The risks of global operations increase together with differences in time, currency and culture. Moreover, risks deriving from foreign political and economical stability emerge (Harland, Brenchley & Walker, 2003). The risks faced by globally operat-ing companies have been increasoperat-ing lately, and at the same time managers still lack the tools to manage these risks. While awareness of these risks has grown in companies, only a few are actively managing them. This may be a real threat for many globally operating companies (Enslow, 2006a; McKinsey, 2006;
Fer-rer, Karl berg & Hintlian, 2007). On top of the risks concerning globally operating firms, other challenges exist as well. Despite the globalization, customers in vari-ous geographical areas still expect different products which have to be custom-ized according to their preferences. By postponing the differentiation of products or by mass customizing products, a globally operating firm may be able to ex-ploit economies of scales while offering largely customized products (Pine, Bart & Boynton, 1993; Feitzinger & Lee, 1997; Pagh & Cooper, 1998; Simchi-Levi, Kaminsky & Simchi-Levi, 2003).
Studies show that there ~s a strong relationship between the quality of sup-ply chain management and
the
overall performance of companies. In the global environment, it is no longer individual companies that compete against each oth-er; rather, the rival supply "chains drive the competition (e.g. Christopher 1998; Lambert & Cooper, 2000). Companies must be able manage the whole supply chain so that it becomes cost effective and responsive, even if they do not own the whole chain. Some companies have been successful in leveraging other com-panies' assets by orchestrating the whole supply chain from raw materials to the end-customers without owning any manufacturing facilities at all. This requires that the incentives of the companies involved stay aligned and that there is con-cise cooperation between the members in the chain (Hagel, 2002; Lee, 2004). The focus in supply chain management is moving towards the customer end of the chain. The present research paper attempts to address the following ques-tions:• What is the appropriate design (sources of supply, decoupling points) of global supply chains?
• What factors affect the design?
PORTUGUESE JOURNAL OF MANAGEMENT STUDIES, VOL. XV, NO.3, 2010
The objectives of this research paper are derived from these questions. The objectives are as follows:
• To identify factors that affect the design of a global supply chain;
• To build conceptual models to describe different options for a global sup-ply chain. These will be expanded to a system dynamics model in order to compare different operations strategies in a case company in quantitative terms.
The research problem and the objectives of this research paper will be ad-dressed by applying methods from system dynamics.
LITERATURE REVIEW
Here literature review is divided into following sections:
The product and the production process
There must be match between product and supply chain (Fisher, 1997), but by the design of the product one can also affect the appropriate structure of the supply chain. Therefore, it is useful to introduce two concepts that are partly related to each other and that are essential in designing the supply chain, namely, the principle of postponement and mass customization (Shah, 2009).
Postponement
The principle underlying postponement is that risk and uncertainty costs are tied to the point of differentiation (form, place and time) of goods, and this occurs during manufacturing and logistics operations. The place and time differentiation is related to the distribution of the product and therefore is usually referred to as logistics postponement (Pagh eta/., 1998). This occurs when the company centralizes its inventories to enable both a reduction in total inventory and better availability of products. These are achieved because aggregate demand is easier to forecast than the demand in a certain geographical area (Christopher, 1998: 270). Mass customization is based on modularization. The first step, accord-ing to Pine eta/. (1993), is to turn the processes of the company into modules. Thereafter, an internal network system must be designed and created to link the modules so that they can integrate rapidly and are able to meet different customer requests.
The product determines the right supply chain
Fisher's framework (1997) for designing the supply chain is based on the features related to the product. He divides products into functional and innovative products according to different aspects of the product. The division does not have to do with the functionality or innovativeness of the products; rather, it reflects the demand patterns of the products: functional products have primarily predictable demand, while innovative products have unpredictable demand.
Dealing with uncertainty in demand
Uncertainty has grown in most industries. Companies are facing uncertain-ties in both demand and supply (Lee, 2004). There are basically three strate-gies that should be considered when dealing with demand uncertainty: it can be reduced, avoided or hedged (Fisher, 1997). The reduction of uncertainty is achieved by improving forecasts or designing products so that they share common components (e.g. mass customization). Uncertainty can be avoided by shortening lead times or by product postponement. Hedging against uncertainty is done by having higher inventory levels that can absorb the uncertainty or by having pro-duction capacity available that is able to respond quickly to the demand. Accord-ing to Lee (2002), the uncertainties in demand and supply should be addressed with agile supply chains.
Lack of coordination among actors in supply chain
PORTUGUESE JOURNAL OF MANAGEMENT STUDIES, VOL. XV, NO. 3, 2010
marketplace (Towill, 1996; Helo, 2000). The Forrester effect is also known as the bullwhip effect (Lee, Padmanabhan & Whang, 1997).
Causes of the forrester effect
Lee eta/. (1997) identify four major causes of the Forrester effect: 1) de-mand forecast updating, 2) order batching, 3) price fluctuation, and 4) rationing and shortage game. In addition to these factors, Souza, Zice & Chaoyang (2000) identify two further causes of the dynamics, namely 5) capacity constraints and 6) poor coordination. In a traditional supply chain every part in the chain fore-casts the future demand on its own. The Forrester effect is created when each part forecasts future demand according to the demand information of the imme-diate downstream member, who in turn has also used some forecasting method to generate this demand (Lee et a/., 1997). In other words, the orders between the parts do not reflect the true end-customer demand but rather the forecasts of demand forecasts.
How to reduce the forrester effect
There are three main steps that the companies in the supply chain can take in order to mitigate Forrester effects. The companies should share information
with each other. By doing so, the demand information flows from the downstream part to the upstream so that this information sharing is fast and accurate and there is no distortion in the demand data. The second step to reduce the effect is channel alignment. This is the coordination of prices, inventory planning and ownership between the different parts in the supply chain. This will be discussed in more detail in the next section. The third step to reduce the Forrester effect is to improve operational efficiency. This refers to reductions in lead times as well as costs, such as fixed ordering costs (Lee eta/., 1997). Special emphasis is also put on lead times by Towill (1996). He suggests that reductions in manufacturing lead times as well as one in the information lead time are very rewarding methods of reducing the Forrester effect.
Aligning incentives and supply chain integration
As discussed above, Lee eta/. (1997) identify rationing and shortage gam-ing to be one of the main causes of the Forrester effect. Souza eta/. (2000) also argue that the rationing game is the most sensitive factor to the supply chain
formance as reducing it by half can reduce more than 90 percent of the dynamics which are related to the rationing game. Establishing a long-term relationship between customer and supplier should, therefore, be an important strategy to reduce this kind of gaming dynamics. Successful integration and management of key business processes across members of the supply chain will determine the ultimate success of the single enterprise (Lambert et a!., 2000). If a company manages to align the incentives of the firms in the supply chain, everyone will make higher profits (Narayanan & Raman, 2004). The companies that seek to achieve cost reduction or profit improvement at the expense of the supply chain partners do not realize that this does not make them more competitive at all.
Global supply chains and operations strategy
Many authors emphasize that the manufacturing strategy and the strategy for the supply chain should be determined together with the company's busi-ness strategy. These two are interrelated and should not be developed separately. Thus, all operations decisions must be made according to the company's overall business strategy. (See for example Christopher, 1998; Heikkila eta/., 2005; Stevenson, 2005.)
Supply chain risks
Risk can be broadly defined as a chance of danger, damage, loss, injury or any other undesired consequences. More formally, it is usually defined as the mul-tiplication of the probability of an undesired event and the significance of the loss (Harland eta/., 2003). In supply chains uncertainty and risk are present through-out the supply chain. The basic risks can be divided into demand and supply risk. Demand risk is associated with the uncertainties in demand. This risk has been increasing due to global competition, faster product development and the large number of product variations. Moreover, demand seems to be increasingly volatile in almost every industry. Therefore, making forecasts on future demand has be-come harder (Fisher, Hammond, Obermeyer & Raman, 1994).
Global supply chain risks
PORTUGUESE JOURNAL OF MANAGEMENT STUDIES, VOL. XV, NO.3, 2010
to the common supply chain risks. For example foreign political and economical stability and foreign-exchange rates are risks that are present in global supply chains. Generally, when the complexity of the supply network increases, all the risks increase as well (Harland eta/. 2003).
Research methodology
System dynamics is an approach adopted to solve problems concerning complex management systems and their obscure dynamic behavior. The applica-tion of system dynamics modeling to supply chain management has its roots in Industrial Dynamics (Forrester, 1958, 1961).
The main idea in system dynamics is to model organizations and corporate structures with stock and flow diagrams combined with causal connections. To-gether with these building blocks, the behavior of the system is studied through computer simulations. According to Sterman (2000), system dynamics is a meth-od to enhance learning in complex systems. It is also applicable as a methmeth-od to understand dynamic complexity as well as the sources of policy resistance, and to design more effective policies.
Building blocks of a system dynamics model
The dynamics of a system are determined by the feedback processes, stock and flow structures, time delays, and nonlinearities. These basic building blocks of system dynamics will be discussed in the next sections.
Feedback loops and causal diagrams
variable. The minus sign, on the other hand, implies that an increase in the inde-pendent variable results in a decrease in the deinde-pendent variable. Diagrams that show all the different variables and their interaction with each other are called causal diagrams (Sterman, 2000). The main idea of causal diagramming is to identify the causal links that exist between the relevant variables (Vas et a!.,
1996).
FIGURE 1
Causal loop diagrams of a positive feedback loop and a negative feedback loop
~
Variable ! ~ Variable
A
V
B~
Variable ! ; \ Variable
A
\ J
B~
~
Stocks and flows
Causal loop diagrams cannot capture the stock and flow structure of a sys-tem. Sterman (2000) explains that stocks characterize the state of a system that brings inertia to the system, and they provide them with memory. Stocks are also the feature that decisions and actions are usually based on. Stocks create delays because they accumulate the difference between inflows and outflows. Flows, on the other hand, change the size of stocks and the state of the system by inflows and outflows to stocks and from stocks. Usually a decision maker can control (at least to some extent) the flows in a system but he/she cannot directly affect the state of the system. A general stock and flow diagram is in Figure 2.
FIGURE 2
The general structure of a stock with inflow and outflow
==~Z;=:::==I~ Stock
I
Inflow Outflow
z
The generic system dynamics model for supply chain modeling
dy-PORTUGUESE JOURNAL OF MANAGEMENT STUDIES, VOL. XV, NO.3, 2010
namics has since been used in many industries to model and simulate various business processes and it is becoming a commonly used method for making busi-ness decisions (see e.g. Vos eta!., 1996; Cakravastia eta!. (1999); Valli, 2007). Feltner and Weiner argue that system dynamics models should be used only to solve real problems (in Towill, 1996) while Angerhofer et a/. (2000) identify several areas where system dynamics H~s been used in supply chain manage-ment. They identify five different research areas: 1) inventory management; 2) demand amplification; 3) supply chain re-engineering; 4) supply chain design; and 5) international supply chain management. In the following sections the ge-neric system dynamics model for a supply chain will be built. The structure of the model and how the material and information flow in the system will be described generally for the whole supply chain and in more detail for one part. The objective is to give the reader a thorough understanding of one part of the model and let the reader understand that the rest of the model is built in the same manner. The model that will be used in the case study is based on this generic model but some modifications are made to better reflect the special characteristics of the case and these changes are presented in the case study.
Model boundaries
Because it is of interest to study a consumer goods manufacturer, the model reaches downstream all the way to the end-customer. The demand chain starts from the final customer. In the upstream direction, it is reasonable to incorporate some of the dynamics of the supplier(s) and not to go further than that. The model is based on the supply chain in Figure 3, where the material flows are described together with the most fundamental information causalities.
FIGURE 3
The SO model of the supply chain
The boundaries of the model are set so that the end-customer demand is an exogenous variable. In other words, the performance of the supply chain does not affect the demand. In addition, the focal company is assumed to be only one of the supplier's many customers, and therefore the supplier's operations are assumed not to be affected by the focal company. If the focal company were a more important customer, the dynamics of the supplier could be modeled in the same way as the dynamics for the focal company is modeled. The information flows through the various processes in the company. The internal processes of the company are divided into 1) order fulfillment, 2) production scheduling, 3) pur-chase planning, and 4) demand forecasting. Also, in the downstream of the chain there is an analysis of how the customer orders according to end-customer sales. Upstream the model takes into consideration how the supplier delivers products to the company.
Inventory management
Sterman (2000) presents a generic model of a stock management system where the model is divided into the stock and flow structure of the system and the decision rules used by the managers to control the flows in the system. The structure of his model applied to the management of inventory and production is presented in Figure 4. There are two loops in the model: The first one- the inven-tory management loop- balances the inveninven-tory to a desired level by having an ef-fect on the production scheduling. The second one- the production management loop - balances the production according to the desired level of work in process (WIP). The adjustments (Adjustment for WIP and Adjustment for inventory) are made with exponential smoothing. The Desired inventory and Desired W/P lev-els could also be dynamic variables and depend on Expected sales and Desired production rate, respectively.
This generic stock management structure is applicable to model the man-agement of the other stocks in the supply chain, as well. For instance, material ordering has same kinds of causal relationships between variables.
Customer orders and order fulfillment
PORTUGUESE JOURNAL OF MANAGEMENT STUDIES, VOL. XV, NO.3, 2010
FIGURE 4
A generic inventory management system
Exogenous variables Other endogenous
~ variables Productton lag \
-Production
management Inventory
. + management AdJustment for ...___
Production + WIP "'-._
Desired inventory
Adjustmen~or
/ Inventory + sched~ng .._._.--j-
Desired WIPWIP Adjustment Time
/
- \__ Inventory adjustment time +
Desired + Expected sales production rate~
+
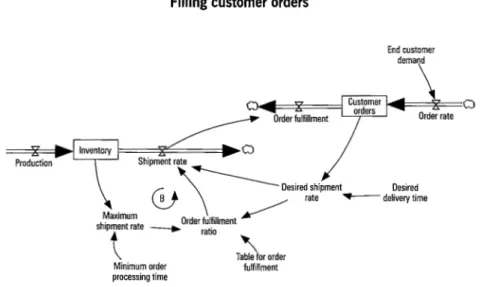
in a Customer orders stock. This stock is reduced only when the focal company ships products to the customer and generates the outflow of Order fulfillment. In other words, all the demand of the customer is to be filled at some time and none of the orders will be lost. The other option would be to assume that the orders that are not immediately filled would be lost. However, it is also of interest to analyze how the desired delivery time affects the system. The Customer orders specify the level of Desired shipment rate which together with Order fulfillment ratio
determine the actual Shipment rate. The model does not distinguish between different products, but rather describes them at an aggregated level. Therefore, the Maximum Shipment rate has to be higher than the Desired shipment rate
in order to fulfill the whole order. Order fulfillment ratio is thus determined with a table function that takes as input the fraction of Maximum Shipment rate and
Desired shipment rate and gives an output between 0 and 1. For a more detailed description see Sterman (2000: 711).
FIGURE 5
Filling customer orders
~~~~0=~~==~0 Production Shipment rate
r;;
;.
~~Desired
shipment Desired~ \ ~ rate -...-delivery time
sh~:~~tu~te __._.Order r~~~~lment
~
Minimum orderT~ororder
fulfillment processing timeModel verification and validation
PORTUGUESE JOURNAL OF MANAGEMENT STUDIES, VOL. XV, NO.3, 2010
Case study presentation
The case study is divided into two sections. This section will introduce the case study and the problem area of the case company. We shall present the sys-tem dynamics model that has.been constructed and present the main results from the simulations. The second section in the case study develops a qualitative and quantitative analysis of the case.
Company description
X is two-wheeler manufacturer that started its business as a wholesaler and assembler and has been making two-wheelers in its own factory in Haridwar. Today the main business comes from designing, manufacturing and marketing two-wheelers as well as aftermarket products such as tires, spare parts and other equipment. The analysis will focus only on the production business of two-wheel-ers; thus, the aftermarket and the other business lines are outside the scope. The main market of X is the home market. X also puts an effort into exporting, espe-cially in some niche markets.
The existing supply chain
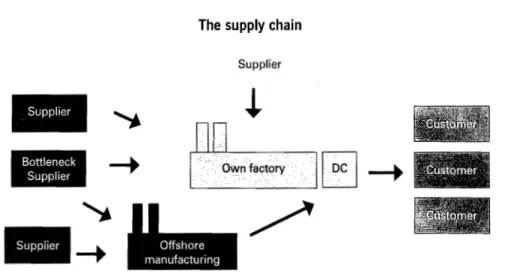
The supply chain of the case company is described in Figure 6. In this figure no distinction is made between X's own operations and supplier operations. The distant actors are shaded with a dark color and the local actors with a lighter one.
At the moment X's supply chain can be categorized according to Simchi-Levi
et at.
(see Section 2.5.1) as a supply chain with international suppliers. There is, however, more and more interest in increasing the sourcing activities and that is why there are also characteristics of a supply chain with offshore manufactur-ing. The demand side of the chain is and will remain very local. Nonetheless, the supply side of the chain is becoming more global. The importance of inter-national sourcing is significant today, and offshore manufacturing will increase in the future. Therefore, more emphasis should be put on aspects that are related to globalization and global market forces. Two main questions are important to the success of the entire company: 1. how can the role of the domestic factory be upgraded to a lead factory that has the ability and knowledge to innovate and create new processes, products and technologies for the company; and 2. how well can X succeed in leveraging the resources of suppliers? The solutions to these problems are also the lifeline for the entire company.FIGURE 6
The supply chain
Supplier
--+
--+
RESULTS
The importance of precise forecasts is simulated in two cases. In the first one there is only X's own production, but the bottleneck sourcing decisions are made according to the forecasts. In the second simulation, both the material purchases and the quantity of purchased products are determined according to the forecasts. The yearly forecast is set 11% below the actual yearly demand and the results of the two simulations are shown in Table 1.
TABLE 1
Forecast lower than actual sales
Input parameters Observed measures
Simulation case
,,,s_tqev;·'
Own production · Pe.livery ti rne . Lost sales expenseA 0.2 100% 1.57 24 715 390
B '0.2 50% •··.·· __ ,·· ... 4.38 67 235 665
Currency risk
PORTUGUESE JOURNAL OF MANAGEMENT STUDIES, VOL. XV, NO.3, 2010
TABLE 2
The effect of exchange rate changes on expenses and profits
20 "'o -1.8 "'o +37 "'o
10 "'o -0.9 "'o +18 "'o -10 "'o +0.9 "'o -18 "'o
-20 "'o +1.8 "'o -37 "'o
The results show that with 100% own production some 10% of all expenses are affected by the currency exchange rate between INR and USD. When sourcing activities are increased, the currency risk will increase even further.
CONCLUSIONS
The biggest challenge in X's present supply chain is to balance variable demand with a stiff supply. The demand is highly seasonal and in some product groups also very volatile. The supply side again is inflexible. Whether it consists of domestic or offshore manufacturing it has long delivery times and must be driven by forecasts. Moreover, the domestic manufacturing is constrained by strict capacity restrictions.
Some of X's products can be categorized in the functional product group with more predictable demand. These products should be supplied with an efficient supply chain that strives to lower costs at each stage of the chain. These models are the strongest offshoring candidates. X also has products that belong to the in-novative group with unpredictable demand. Excess capacity in manufacturing and buffers in component stocks together with modular product design make it pos-sible to react quickly as well as to postpone product differentiation for as long as possible. In X's own production this cannot be achieved today; the production line is too inflexible, which counteracts potential benefits to be gained from X's close location to customers. More flexibility could be attained by designing products that share the same components as much as possible and by increasing modularity. Then manufacturing postponement could be applied. The question still to be an-swered is: Would this mean that the finishing of products (e.g. painting, attaching decals) could be done or could the product be completely assembled according to customer orders? In order to answer the question, more research is needed on the production process and the product design. There are also improvement possibili-ties in the production sequencing: If the functional products were produced first,
there would be more production capacity for innovative products during the peak time. Increasing and decreasing whole capacity is not seen as a realistic option but the necessary capacity flexibility could be attained by being flexible within the different product categories. In the case study, the main focus was to identify and analyze different supply chain strategies that the case company can use. The analysis of these strategies could, however, be deepened. Further analysis over the effects of moving the OPP in X's own production could be done. Which customers could be served with an MTO strategy and what requirements would such a strategy change imply? Could this strategy be followed with professional customers if there was visibility to the installed base or service cycles? Further~
more, a deeper analysis of the biggest retail customers could suggest that VMI is the solution to attain the required visibility in order to move the OPP.
Limitations of present research
The case study shows the applicability of system dynamics in modeling supply chains. In particular, it clearly reveals the implications of causalities and delays between variables. With some changes the model can also be used to ana-lyze the behavior of different supply chains. In this case the special characteristics of the chain in question must be taken into account. The basic components in all supply chains are more or less the same, but the actual structure determines what kind of a model should be built. The objective of the system dynamics model is not to give strictly normative decision models or to optimize the logistics of the system, but rather to illustrate the behavior of the system at a broader level. The model works, however, as a good foundation for a more fine-grained analysis. If greater detail is needed in analyzing and optimizing the movement of single articles, a method for modeling discrete-time systems would probably be more suitable. System dynamics works best with continuous systems where material flows in continuous streams instead of sudden, discrete events.
Future scope of research
PORTUGUESE JOURNAL OF MANAGEMENT STUDIES, VOL. XV, NO.3, 2010
a more complex supply network structure. The model boundaries could also be expanded. For instance, customer demand could be included as an endogenous variable in the model. If the structure of the supply chain in the model was dy-namic, then the adaptability of supply chains could also be analyzed.
Acknowledgements
Authors are particularly grateful to two anonymous reviewers for providing suggestions to improve the manuscript. It would be ungrateful on my part if I do not convey my gratitude to Prof. (Dr.) Parag Diwan and to my student(s) for taking pains in providing their suggestions to improve this manuscript. This work is the result of support we had from my research team from the Centre of Supply Chain Research at the University of Petroleum & Energy Studies, Dehradun.
References
Anderson, D. L., Favre, D. J. (2007). The 7 Principles of Supply Chain Management, Supply Chain
Management Review, 11 (3), pp. 41-46.
Angerhofer, B. J., Angelides, M. C. (2000). Systems dynamics modeling in supply chain
manage-ment: Research review, Proceedings of the 32nd conference on Winter simulation.
Aron, R., Singh, J. V. (2005). Getting Offshoring Right, Harvard Business Review, 83 (12), pp.
135-143.
Beamon, B. M. (1999). Measuring supply chain performance, International Journal of Operations
and Production, 19 (3), pp. 275-292.
Bowersox, D. J., Closs, D. J. (1996). Logistical Management, New York, McGraw-Hill.
Cakravastia, A., Diawati, L. (1999). Development of System Dynamic Model to Diagnose the
Logistic Chain Performance of Shipbuilding Industry in Indonesia. Conference paper at The international Conference of The System Dynamics Society, Wellington, New Zealand.
Christopher, M. (1998). Logistics and Supply Chain Management, London, Financial Times
Man-agement.
Christopher, M., Lee, H. (2004). Mitigating supply chain risk through improved confidence,
Interna-tional Journal of Physical Distribution & Logistics management, 34 (5), pp. 388-396.
Eloranta, E., Collin, J., Holmstrom, J. (forthcoming). Discovering Operational Innovations via
Col-laborative Demand-Supply Networks.
Enslow, B. (2006a). Global Supply Chain Benchmark Report. Aberdeen Group. [online] Available
from www.aberdeen.com [Accessed 19.10.2007]
Enslow, B. (2006b). Rethinking China Sourcing: From Total Landed Cost to Total Delivered Profit.
Aberdeen Group. [online] Available from www.aberdeen.com [Accessed 19.10.2007] Feitzinger, E., Lee, H. L. (1997). Mass Customization at Hewlett-Packard: The Power of
Postpone-ment, Harvard Business Review, 75 (1), pp. 116-121.
Ferdows, K. (1997). Making the Most of Foreign Factories, Harvard Business Review, 75 (2), pp.
73-88.
Ferdows, K. (2003). New World Manufacturing Order, Industrial Engineer, 35 (2), pp. 28-33.
Ferdows, K., Lewis, M.A., Machuca, J. A. D. (2004). Rapid Fire-Fulfillment, Harvard Business
Review, 82 (11), pp. 104-110.
Ferrer, J., Karlberg, J., Hintlian, J. (2007). The Key to Global Success, Supply Chain Management
Review, 11 (2), pp. 24-30.
Fisher, M. L. (1997). What Is the Right Supply Chain for Your Product?, Harvard Business Review,
75 (2), pp. 105-116.
Fisher, M. L., Hammond, J. H., Obermeyer, W. R., Raman, A. (1994). Making supply meet demand
in an uncertain world, Harvard Business Review, 72 (3), pp. 83-93.
Fisher, M.L., Raman, A., McCelland, A. S. (2000). Rocket Science Retailing Is Almost Here, Are You
Ready?, Harvard Business Review, 78 (4), pp. 115-124.
Forrester, J. W. (1958). Industrial Dynamics: A Major Breakthrough for Decision Makers, Harvard
Business Review, 36 (4), pp. 37-66.
Forrester, J. W. (1961). Industrial Dynamics. Portland, Productivity Press.
Gottfredson, M., Puryear, R., Phillips, S. (2005). Strategic Sourcing: From Periphery to the Core,
Harvard Business Review, 83 (2), pp. 132-139.
Hagel Ill, J. (2002). Leveraged Growth: Expanding Sales Without Sacrificing Profits, Harvard
Busi-ness Review, 80 (10), pp. 68-77.
Harland, C., Brenchley, R., Walker, H. (2003). Risk in Supply Networks, Journal of Purchasing and
Supply Management, 9 (2), pp. 51-62.
Heikkila J., Ketokivi, M. (2005). Tuotanto murroksessa, Helsinki, Talentum.
Hexter, J.R. (2006). Better manufacturing in China: An interview with two of PLP's top executives.
PORTUGUESE JOURNAL OF MANAGEMENT STUDIES, VOL. XV, NO.3, 2010
Holmstrom, J., Hoover, W. E., Louhiluoto, P., Vasara, A. (2000). The other end of the supply chain,
The McKinsey Quarterly, 1, pp. 63-71.
Hoover, W. E., Eloranta, E., Holmstrom, J. Huttunen, K. (2001). Managing the Demand-Supply
Chain, New York, John Wiley & Sons, Inc.
Kaplan, R., S., Norton, D., P. (1992). The balanced scorecard: measures that drive performance,
Harvard Business Review, 70 (1), pp. 71-79.
Kauppalehti (2007). Valuutat. [online] Available from http://www.kauppalehti.fi [Accessed
28.1.2008]
Kleijnen, J. P. C., Smits M. T. (2003). Performance metrics in supply chain management, Journal
of the Operational Research Society, 54, pp. 507-514.
Lee, Hau, L., Padmanabhan, V., Whang, S. (1997). The Bullwhip Effect in Supply Chains, Sloan
Management Review, Spring, pp. 93-102.
Lee, Hau, L. (2004). Triple-A Supply Chain, Harvard Business Review, 82 (10), pp. 102-112.
Levy, D., L. (1997). Lean Production in an International Supply Chain, Sloan management review,
38 (2), pp. 94-102.
Ljung, L., Glad, T. (1994). Modeling of dynamic systems, New Jersey, Prentice Hall.
Mentzer, J. T., DeWitt, W., Keebler, J. S, Soonhong, M., Nix, N. W., Smith, C. D, Zacharia,
Z. G. (2001). Defining Supply Chain Management, Journal of Business logistics, 22 (2),
pp. 1-25.
Mcivor, R. T., Humphreys, P. K., McAleer, W. E. (1997). A strategic model for the formulation of an
effective make or buy decision, Management Decision, 35 (2), pp. 169-178.
McKinsey (2006). Understanding supply chain risk: A McKinsey Global Survey, The McKinsey
Quarterly, Web exclusive, October. [online] Available from http://www.mckinseyquarterly.com [Accessed 10.9.2007]
Narayanan, V.G., Raman, A. (2004). Aligning incentives in supply chains, Harvard Business
Re-view, 82 (11), pp. 94-102.
Neilimo K., (2007). Kilpailu liiketoimintamalleilla- asiakkaat mukana liiketoimintainnovaatioissa.
Liito-ohjelman vuosiseminaari. Presentation, 23.8.2007.
Olhager, J. (2003). Strategic positioning of the order penetration point, International Journal
of Production Economics, 85 (3), pp. 319-329.
Pagh, J.D., Cooper, M. C. (1998). Supply chain postponement and speculation strategies: How to
choose the right strategy, Journal of Business Logistics, 19 (2), pp. 13-33.
Pine II, B. J., Bart, V., Boynton, A. C. (1993). Making Mass Customization Work, Harvard Business
Review, 71 (5), pp. 108-118.
Porter M.E. (1987). From competitive advantage to corporate strategy, Harvard Business Review
65 (3), pp. 43-60.
Rainbird, M. (2004). Demand and supply chains: the value catalyst, International Journal of
Physi-cal Distribution & Logistics Management, 34 (3-4), pp. 230-250.
Sharman, G. (1984). The rediscovery of logistics, Harvard Business Review, 62 (5), pp. 71-79.
Simchi-Levi, D., Kaminsky, P., Simchi-Levi, E. (2003). Designing & Managing the Supply Chain,
New York, McGraw-Hill Companies.
Sterman, J., D. (2000). Business Dynamics: System Thinking and Modeling for a Complex World,
Boston, McGraw-Hill Companies.
Stewart, G. (1995). Supply chain performance benchmarking study reveals keys to supply chain
excellence, Logistics Information Management, 8 (2), pp. 38-44.
Suomen Polkupyorateollisuus ry (2005). Polkupyoraalan taskutieto 2005. [online] Available from
http://www.teknologiateollisuus.fi/files/ 9426 _ Taskutieto2005.pdf [Accessed 24.1 0.2007]
Supply-Chain Council (2006). SCOR Overview 8.0, Supply-Chain Operations Refernce-model.
[online] Available from http://www.supply-chain.org [Accessed 14.8.2007]
Swaminathan, J. M., Tomlin, B. (2007). How to avoid the 6 risk management pitfalls, Supply
Chain Management Review, 11 (5), pp. 34-42.
Tan, K. C. (2001). A Framework of Supply Chain Management Literature, European Journal of
Purchasing & Supply Chain Management, 7, pp. 39-48.
Towill, D. R. (1996). Industrial dynamics modelling of supply chains, International Journal of Physical Distribution & Logistics Management, 26 (2), pp. 23-42.
Ulrich, K., Randall, T., Fisher, M., Reibstein D. (1997). Managing Product Variety: A Study of the
Bicycle Industry. [online] Available from: http://opim-sky.wharton.upenn.edu/-ulrich/down-loads/bikevarstrat.pdf [Accessed 14.8.2007]
Valli, M. (2007). Simulointi tehostamaan Nokian tuotekehitysta & Bisnekseen vauhtia automaation
mallein. Kauppalehti; Automaatio VIP, 27.8.2007.
Vollmann, T. E., Cordon, C., Heikkila, J. (2000). Teaching supply chain management to business
executives, Production and Operations Management, 9 (1), pp. 81-91.
Vos, B., Akkermans, H. (1996). Capturing the dynamics of facility allocation, International Journal
of Operations & Production management, 16 (11), pp. 57-70.
Walters, D., Rainbird, M. (2004). The demand chain as an integral component of the value chain,