UNIVERSIDADE TÉCNICA DE LISBOA
INSTITUTO SUPERIOR DE ECONOMIA E GESTÃO
October 2011
Master in Finance
Challenges of Home Underinsurance and a
solution framework for insurance
companies
Ricardo André Bentes Raposo de Sousa Azevedo
Supervisor
Professor Doutor Alfredo Duarte Egídio dos Reis
Committee
2
Nomenclature
Premium of a household policy
Premium after taxes and administrative levies
Premium of a household policy, assuming underinsurance
Highest premium that a policyholder accepts to pay Policy rate
Sum insured
Taxes and administrative levies Claim probability
Nr. of years in which policyholders have their assets underinsured
Households’ net income Policyholders’ savings Households’ annual savings
Underinsurance burden for policyholders Nr. of years necessary to pay a claim Expected benefits of financial protection Expected costs of financial protection Percentage of underinsurance
Percentage of loss in respect to the real value
Households’ savings rate
Ratio between perceived underinsurance and real underinsurance Incurred claims
Loss Ratio
3
Abstract
All over the world, evidence suggests that individuals tend to undervalue their assets. This subject seems to be particularly dramatic in the case of home insurance line of business because of its social and economical relevance. Consumers’ behaviour is guided by some core principles and variables which mixed with environmental characteristics can lead in many cases to some sort of underinsurance.
This work presents a framework in order to understand why individuals take insurance decisions and why they frequently underinsure their assets, by presenting the most significant causes that can help us to identify the true origin of the problem. Moreover, analysis of its consequences allows understanding of impact over economical agents, namely insurers and policyholders. Even though this issue could be also analyzed under a social perspective, involving the role of government’s authorities, discussion is centered in interactions between the two sides of an insurance contract. Finally, we propose a set of solutions that may be designed in order to minimize likelihood of underinsurance.
4
Resumo
Existem dados que indicam que, de forma global, há uma tendência natural dos indivíduos para subavaliarem os seus activos, sendo que este assunto parece ser particularmente dramático no caso do seguro de habitação devido à sua relevância social e económica. O comportamento dos consumidores é guiado por algumas variáveis e princípios-chave que, em conjunto com as características do meio envolvente, levam em muitos casos a situações de infra-seguro ou subseguro.
Este trabalho apresenta uma sistematização do problema para que se compreenda a forma como os indivíduos tomam as suas decisões no contexto dos seguros e o porquê de colocarem frequentemente os seus activos em situações de infra-seguro. Nesse sentido, apresentar-se-ão igualmente as causas mais importantes que nos ajudam a identificar a verdadeira origem do problema. Para além disso, a análise das suas consequências permite compreender o impacto nos agentes económicos, nomeadamente nos seguradores e nos tomadores de seguro. Ainda que este assunto possa ser analisado sob uma perspectiva social, envolvendo o papel das autoridades governamentais, a discussão é centrada nas interacções entre as duas partes do contrato de seguro. Finalmente, propomos um conjunto de soluções que podem ser desenhadas de forma a reduzir a possibilidade de ocorrência de infra-seguro.
5
Contents
Acknowledgments ... 9
1. Introduction ... 10
2. Decision-making process... 12
3. Causes of underinsurance ... 16
3.1. Poor knowledge of insurance contracts and lack of information ... 16
3.2. Cost of obtaining a valuation ... 18
3.3. Tax burden ... 20
3.4. Assymetric Information and Free-riding ... 21
3.5. Competitiveness ... 24
3.6. Inertia and procrastination ... 25
3.7. Feeling of invulnerability ... 26
3.8. Level of risk aversion... 27
3.9. Inflation ... 28
4. Consequences ... 30
4.1. Homeowners ... 30
4.2. Insurers ... 32
4.3. Governments ... 32
5. Discussion on causes and consequences ... 34
5.1. Brokers Survey... 34
5.2. Consequences analysis ... 40
5.2.1. Homeowners ... 40
5.2.2. Insurance companies ... 50
6. A proposal for solving underinsurance issues ... 59
6.1. Communication ... 62
6
6.3. Indexation ... 68
6.4. Ad-hoc increases ... 70
6.5. Risk Survey ... 71
6.6. Rates ... 73
6.7. Average Clause ... 74
6.8. Sub-limits ... 75
6.9. Minimum limits for capital ... 76
6.10. Total or extended replacement policies ... 77
7. Conclusion ... 80
7
List of Tables
Survey absolute frequencies ... 35
Distribution of Portuguese broker's opinions about knowledge of insurance contracts . 36 Distribution of Portuguese brokers' opinions about correlation between knowledge and economical background ... 36
Distribution of Portuguese brokers' opinions about the propensity of consumers to quantify or to revise capital for contents ... 37
Distribution of Portuguese brokers' opinions about correlation between financial problems and underinsurance ... 38
Distribution of Portuguese brokers' opinions about the policyholders' feeling of invulnerability ... 38
Distribution of Portuguese brokers' opinions about level of risk aversion ... 39
Distribution of Portuguese brokers' opinions about risk of rate increases in terms of lapsing likelihood ... 40
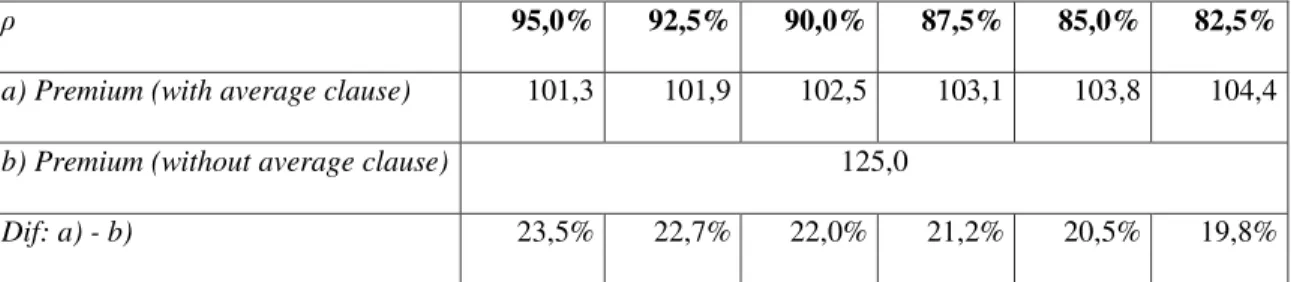
Differences in premium to achieve the same results ... 57
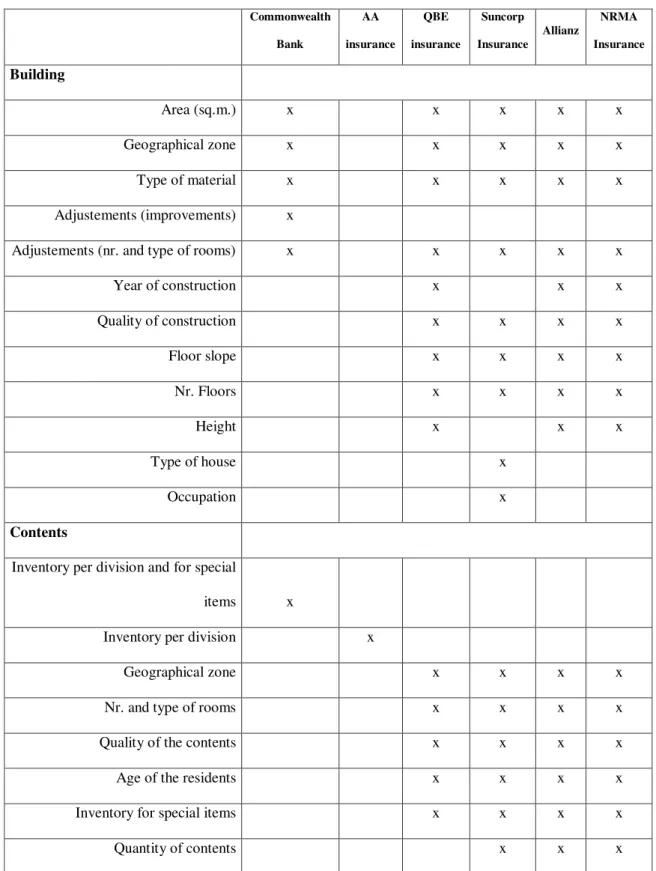
Variables used by Australian insurers in building and contents simulators ... 66
Portuguese rebuilding costs per square meter ... 68
8
List of Figures
Adverse selection vicious circle ... 22
Evolution of savings ... 42
Impact of underinsurance on households' savings (with average clause) ... 46
Impact of underinsurance on households' savings (without average clause) ... 49
Comparison between policies with average clause and without average clause ... 50
Impacts of ρ and δ on the Loss Ratio ... 55
Impacts depending on the application of the average clause ... 58
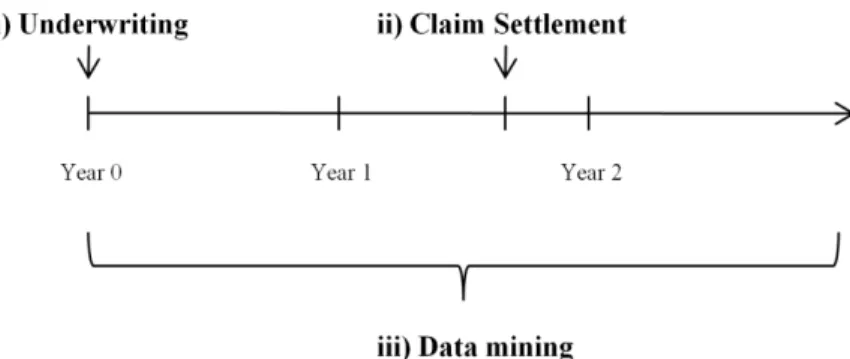
Fighting underinsurance along the lifetime of a policy ... 60
9
Acknowledgments
I would like to express my deep gratitude to all those who contributed to this work
with their help, support and consideration.
First, I acknowledge Professor Alfredo Egídio dos Reis for his interest in taking part
of the project, as well as for all his helpful comments, suggestions and guidance.
I thank APROSE and Corvaceira Gomes for their kind and important involvement
in the survey done among Portuguese Brokers.
I would also like to thank my family for all their incentive and assistance provided
during my working hours, as well as to all my friends and colleagues that gave their
contribution by sharing their experience with me.
Finally, a special thanks to Catarina, to whom I dedicate this work, for all her great
10
1.
Introduction
The role of insurance in the economy is crucial as it allows individuals and firms to
face future with less uncertainty by reducing the risk of their choices. In that sense, it’s
very important to guarantee that every insurance policy in force, with the function of
mitigate a particular risk, is properly designed in order to achieve its purpose.
Otherwise, economic agents would be misusing a costly tool and taking their decisions
without an effective safety net.
This work aims to present underinsurance as one of the dangerous traps in which
policyholders and insurers can fall when buying or selling an insurance policy but also
intends to analyze its effects in the economy from both points of view and to propose
some guidelines for the future in order to reduce the problem. Even though we’re
dealing with an issue that may affect a large variety of lines of business, in terms of
insurance products, we will limit our study to home insurance. This choice was mainly
based on the social importance of this product in developed economies, not only among
households, but also among insurance companies due to the high proportion of these
products in the books of insurance companies. Preferably, we will base our study in
literature about those economies for who the underinsurance theme is quite critical and
where a large amount of data is available, but, where possible, this work will try to give
a special emphasis to the Portuguese Market.
Underinsurance is a situation in which the sum insured is lower than the real value
of the asset. Focusing on household insurance, we may also define underinsurance as
the situation when the maximum value that can be paid after a claim is less than the
rebuilding cost or the replacement value, depending if we are dealing with buildings,
11
domestic purposes, including main buildings, fixtures and fittings, outbuildings, tanks,
pipes and cables, aerials, etc; and as contents, household goods and personal property of
the permanent members of household.
In addition to covers’ type and extent, insurance policies stipulate the level of
coverage in terms of the capital insured. In many cases, people’s residence is the single
or the largest asset that households possess and therefore, there should be a great
concern about getting a good financial protection. The fact is that this may be not
achieved if the insurance limit doesn’t reflect the property’s full value. During the last
decades, reality has showed that beyond the risk of a facing a small or medium-size
claim, for example, a theft or a simple escape of water, just to mention two of the most
common ones, there are very large risks that mankind can face, as there’s a record of
thousands of homes that all over the world have been completely destroyed by
catastrophic floods, earthquakes and fires. In parallel, insurance companies should be
also very interested in having the full information in their books by getting the correct
values of the assets covered, in order to write at the right price and to make good
decisions in their investments.
The next three chapters will present a theoretical overview on underinsurance most
important issues. In Chapter 2, a framework will be presented to better understand how
consumers take their decisions in the context of insurance, followed by Chapters 3 and 4
that will introduce the most relevant causes and consequences of underinsurance. A
critical view on the subject and the discussion of these causes and consequences are the
main goals of Chapter 5 and finally, in Chapter 6, we will propose some principles and
12
2.
Decision-making process
Before starting to present the causes behind underinsurance, it’s important to
understand the reasons that sustain individuals’ decisions when they face a certain
situation in their lives that could require an insurance contract, in order to reduce risk
and uncertainty. In that sense, this paragraph will present a framework that allow us to
better understand decision-making processes, guiding most of the analysis of the
following sections.
According to Tooth and Barker (2007) the reason why some people do not fully
insure is because they feel the benefits of doing it do not outweigh the cost. Therefore,
decision is in many occasions subjected only to a cost analysis, especially if there is a
previous bad experience with an insurance product. Let denote the investment in
assets’ financial protection and let denote the expected benefits of doing it and its
costs. Thus, it is expected that individuals are willing to do their investments only if:
Kunreuther (1996) observed that, in many cases, proprietors don’t care about
general protection measures. In other words, there is a natural level for that tends to
be small. For this reason their interest in home insurance is also limited. In respect to
costs, Kunreuther and Pauly (2006) pointed out that empirical evidence suggests that
cost-effective preventive measures are not rewarded by insurers in order to change
consumers’ behaviour. By not reducing at the margin, marketing activities do not
always produce results that are in the best interest of individuals at risk. Moreover, the
13
potential benefit of buying an insurance policy ( ), specially, in cases where a previous
bad experience with an insurance policy may affect the expectations of getting a future
benefit from it. As such, decision is frequently subjected to the conclusion that costs are
high when compared to the benefits.
For Kunreuther and Pauly (2006), cost-benefit analysis is a good framework to
understand the subscription process of an insurance policy and appears as a function of
time, discount rate and probability of having a claim. So, any kind of decisions that try
to avoid or limit the purchasing of insurance is fundamentally due to two main aspects.
i. An underestimation of the probability of having a claim. Under the
assumption that the owner sets a lifetime for his own house, he will
probably think that any damage will only happen after he leaves his
house, what can make him suppose that he’s immune to any type of
event. That’s the case in which claim probability ( ), is lower that the
probability level where policyholder begins to be worried about possible
damages ( ).
ii. Second, individuals with high discount rates tend to undervalue future
benefits and this way, are less willing to adopt any type of protection or risk
mitigation measures. Furthermore, the fact that an insurance policy is limited
to a determined time period (annual, for instance), makes that the expected
benefit of buying a policy may be more connected to the contract period than
14
Just like in many other products or services, in insurance decisions price to pay also
plays an important role. Grace et al. (2002) analyzed a data set for 60 companies in 4
different years and estimated price elasticity and its effects on demand, for American
home insurance market (particularly, New York and Florida). Results showed some
differences from region to region, depending also on the type of coverage, but they
found that insurance demand was generally price sensitive. As a result, price effects
shall be studied when relevant decisions are under analysis: insuring or not, choosing
type of coverage and deductible level or calculating amount to insure are just some
examples.
Typically, the premium of a household policy ( ), before taxes and administrative
levies, can vary according to changes in rate ( ) and sum insured ( ).
Variations in rates can be explained by different factors such as risk location,
number and type of covers, policyholder occupation, deductible level, home security
devices, etc. However, some of them, like the risk location, cannot be manipulated by
policyholders. On the other hand, some common actions that normally give to
consumers a discount in premium, such as the purchase of an alarm system, can
represent an extra-expenditure (increasing ). Other actions, when a high deductible, is
set, for example, may cause a large increase in the risk perception (decreasing .).
Consequently and considering as a constant value, in cases where policyholders try to
15
In order to better understand changes in , it’s important to underline that in home
insurance market we should be aware of the difference between the questions raised by
the valuation of capitals for building and contents, in the sense that calculation of
building’s sum insured is in many cases more complex, requiring some specialized
skills. However, there are also some sorts of contents very hard to value and there are
also cases like the Portuguese market, for example, where local rebuilding costs for
insurance purposes are determined by the law. Price sensibility is also different. In the
view of Tooth and Barker (2007) demand for contents seems to be much more elastic
and there are some principles supporting this idea. First, the potential loss in the case of
buildings in generally greater and, consequently, individuals are less risk averse for
contents (in fact, some people think they have very little to insure). Then, consumers
can easily take the option of deciding to not insure house contents at all, which is much
more difficult in the case of buildings, due to some legal implications or to the
obligations related to bank loans. At last, policyholders have the possibility of replacing
damaged high quality goods to low quality ones, being difficult to do the same with the
building (with most building claims this option is not available as, almost by necessity,
16
3.
Causes of underinsurance
There are several factors that are taken into account in cost-benefit analysis and that
in the end can lead to the existence of underinsurance or in more extreme situations to
non-insurance. Although it’s quite common to find financial motivations that can
increase the importance of centering the debate on price effects, some of them are
related to social, economical and demographical reasons and others to behavioural
aspects. The work of Krantz and Kunreuther (2007) reports that sometimes individuals
purchase insurance that appears to be unattractive from a financial point of view but that
achieves other types of goals.
3.1. Poor knowledge of insurance contracts and lack of information
Although the great social importance of home insurance, it’s clear that a
considerably part of the population of developed countries does not fully understand
policy wordings and, commonly, policyholders are not aware of some fundamental
questions that are behind the construction of an insurance policy until the insurer starts
to settle the claim.
Spanish and Portuguese laws, for example, determine that policyholders must insure
their assets according to their real value - see Calero (2001) and Decreto-Lei n.º
72/2008, respectively - which not only raises some questions related to the definition of
value, but also establishes the obligation of doing a proper valuation of the assets.
According to the law, in cases where the sum insured is lower than the real value,
policyholders will only be entitled to recover such proportion of the loss, as the sum
insured bears in relation to the real value of the asset. This is also known as the Average
17
Under the theoretical hypothesis of a market with perfect information, consumers
would be more informed about potential consequences of getting incorrect values, and
consequently, it would be expected that this would reduce, ceteris paribus, the
likelihood of underinsurance. In other words, poor information allows consumers to
thinks that their is lower than what is and in practice, they won’t feel the need to buy
so much financial protection as they should.
Lack of information is a cause that seems to be directly related to poor knowledge of
insurance issues but it comes also from a low level of transparency that may exist in the
relationships between insurers and its clients, within an industry where contracts are for
the most of the clients, quite complex. Jones (2007) indicates these reasons as some of
the most relevant key factors in underinsurance and non-insurance.
However, actually, there’s an effort made by insurers and other type of
organizations that, in some way, are related to insurance industry, in order to promote
some combat measures that may reduce underinsurance levels. As an example, from the
twelve largest non-life Portuguese insurance companies (90% of the total market share,
approx.), six of them have, on their websites, specific info about how to calculate capital
to insure. This type of information is also available on an insurance guide issued in
2010 by the Portuguese insurance supervisory authority. This type of intervention in the
market is even more common in mature markets like the United Kingdom or in
countries that are particularly exposed to some perils, like Australia.
In some cases, due to a high opportunity cost in terms of time, sales people, agents
and brokers, feel the need to speed up and to simplify the sale process. This way,
policyholder may be not informed properly about every step to take during subscription.
Eckardt and Räthke-Döppner (2008) found that in the German market the duration of
18
on the information quality as well as on the total service quality provided. However,
they also recognize deep information asymmetries between insurers’ intermediaries and
their customers.
According to Tooth and Barker (2007) lack of insurance is more prevalent in youth
groups, in cases where individuals do not work in full-time, among groups with low
levels of education, in single-parent families and also among retired workers with
mortgages. Thus, it is expected that levels of poverty and existence of financial and
economic problems that negatively influence investment made in insurance subjects are
positively correlated to the level of knowledge of insurance contracts. For Eckardt and
Räthke-Döppner (2008), the more knowledge that consumers have about insurance
subjects, the higher is the quality of information given by a broker is expect to be. It’s
easy to understand that the financial situation and economical issues are also important
factors that often lead to an attempt of reducing , setting lower values than the real
ones through variations in .
3.2. Cost of obtaining a valuation
In parallel with the question “what are the consequences of underinsuring” there are
some problems around the topic “how to avoid underinsurance”. In that sense, some
problems sometimes arise in the time of calculating rebuilding and replacement costs. A
report by Australian Securities & Investments Comissions (2005) includes a survey
made in 2000, where 1000 homeowners were randomly selected by an Australian
company specialized in estimating rebuilding costs. They found that 87% of the houses
were insured for less than their rebuilding value. However, a gap seems to exist between
real figures and estimates made by homeowners. An article published by Suncorp
19
showed that 93% of the clients thought they were insured for the right amount or even
over-insured.
The existence of a cost ( ) associated to the valuation of the sum to insure is
certainly a factor that can reduce usage levels of this kind of processes and
consequently, may raise the probability of getting incorrect values. Based in a survey
made by Insurance Council of Australia in 2001, Jones (2007) also indicates the cost of
obtaining a formal valuation as a key factor.
Even in countries like Portugal where there is a legal framework defining the cost of
rebuilding or, at least, creating a generalized and accepted benchmark for it, in many
cases they are totally inadequate because materials and techniques used may be far
away from usual standards, turning the task of valuation even more difficult and costly.
This leaves policyholders with the responsibility of doing such a complex task and leads
them to put a lot of time and effort in. Alternatively, they can hire professional valuers,
although this option will probably increase for a larger amount.
In the case of contents, a correct quantification may be a very hard task that also
requires a lot of time and effort, not only because of the large amount of general goods
that is necessary to identify and quantify, as also because of the great difficulty of
setting a price for each one, namely for special items such as jewellery, antiques or fine
art. These can have a valuation price that may be sufficiently high to commit its
execution. Besides the fee paid to professions valuers, there is also an opportunity cost
in terms of time, effort and privacy since there is a generalized attempt of the insurers to
encourage their clients to list this kind of contents in an individual basis, filling for each
20
3.3. Tax burden
In countries with high levels of taxation, including taxes on insurance industry, there
is a pressure over income and for that reason it often turns difficult to consumers to
legitimate insurance premiums. As a consequence, they might want to find ways to
reduce it. This should be seen as a particular case of price effects over insurance
demand, as the existence of a tax burden increases insurance premiums and
consequently, . Let’s define as insurance premium after taxes and administrative
levies .
Beside the legitimacy issue, the other reason why we should focus on this particular
case is because in some markets where these problems have been studied through the
last decades, this effect is particularly high with serious consequences.
Australia is one of the countries where taxation level in insurance industry is
considerably high. Insurance Council of Australia (2007) reported that in the state of
Victoria, a household policy suffers, via taxes, an increase in premium by
approximately 50%. A Suncorp report (2007) defined that the behaviour that leads to
underinsurance should be analyzed taking into account policyholders’ perception of the
value, as taxes and levies attached to insurance contracts are not perceived as good
values and, so, distort the decision to purchase insurance. In the same way, Tooth and
Barker (2007) stated that it is expected that the introduction of a marginal tax levy can
distort the incentive to buy more insurance, resulting in the increase of underinsurance
21
According to Insurance Council of Australia (2005), historically, it was held that
demand for insurance was quite inelastic, since it was difficult to consumers to pool risk
without this type of financial protection. However, this view has been challenged by the
growing experience that has been showing that insurance purchase is, in fact, very
sensible to price, existing a high correlation between tax burden levels and insurance
products capture rate.
3.4. Assymetric Information and Free-riding
This section will focus on a specific issue that influences premiums evolution:
adverse selection. Once again this choice is driven by the major role it plays in
insurance markets analysis, particularly in some regions where this subject is
particularly important and still being discussed.
Typically, insurance market is a good source of examples related to adverse
selection and moral hazard. One of the most documented ones is that in cases where
there isn’t mandatory insurance for a specific peril, it may happen that only the high
-exposed individuals run to buy the cover. One good example arises from Portugal, a
country considerably exposed to the earthquakes risk, even with different levels of risk,
depending on the region. A 2007 report from Instituto de Seguros de Portugal, indicates
that in high risk areas the percentage of people buying this cover is much higher than in
low risk areas.
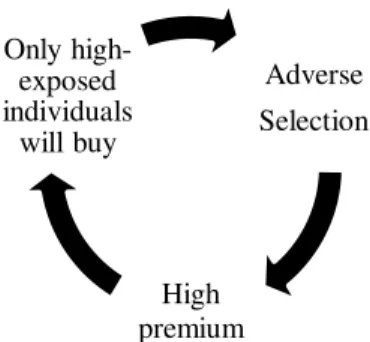
Since the existence of adverse selection in this process leads to high premiums,
some individuals potentially interested in buying earthquakes cover, for example, will
possible be out of the game due to financial problems. Others, with a relatively higher
, will try to reduce their policy costs where possible, in order to respect their budget
22
standards. This will reinforce the high probability of having different sorts of
underinsurance. Many authors like Raschky and Weck-Hannemann in 2007, reported
that without introducing mandatory insurance, at least in covers related to natural
hazards that regions are exposed to, there will be a higher risk of adverse selection and
underinsurance, as there’s no possibility of turning this circle into a virtuous one by
eliminating the adverse selection problem.
Figure 3.1 Adverse selection vicious circle
In parallel, another type of problem arises when consumers can reach a minimum
level of without having to face . According to our methodology, it was expected
that having we wouldn’t face underinsurance problems, as individuals would
seek for financial protection. The question is that in some cases, individuals will put
themselves out of the market, trying to benefit without purchasing the correct amount of
insurance.
If we define, for the purpose of this discussion, aid and assistance as public goods
and taxes over the premium as part of the contribution to support these services, we can
find some evidence of the existence of free-riding behaviours: consumers expect to
benefit from their position, getting the good without paying for it. For the sake of the
Adverse Selection
High premium Only
high-exposed individuals
23
argument, we should recall that in Portugal firemen corporations are partially funded by
a tax applied over insurance premiums, namely in fire perils.
The possible need to be helped by a third-party (government, family or
non-governmental organizations) under the hypothesis of no-exclusion increases the
expectation that is really possible to have the good without having to pay for it and,
therefore, the probability of underinsurance or non-insurance. Logically, in this type of
situations we are mainly discussing the consequences of a catastrophe, more than the
occurrence of a normal and non-expensive claim, just a like a simple escape of water.
Jones (2007) is one of the authors who supports the idea that in some cases, the decision
of underinsuring can come from the expectation that it will always be a safety net
(Government or family, in most cases) that will assist people in the case of the
occurrence of a large catastrophe, what can diminish the incentive to insure assets
properly. For Hood, Stein and McCann (2005), one of the reasons behind the low
uptake in home insurance is the fact that his possession minimizes the possibility of
getting emergency assistance and temporary housing at the expense of local authorities,
after a catastrophic loss such as flooding or earthquake.
Along the last decades, it has been observed a large number of natural disasters
where, despite clear social and private advantages of insurance, countries remain
seriously underinsured. Although we can find high levels of underinsurance in
industrialized countries, the problem is much deeper in developing countries. For
example, by the time of Izmit Earthquake (Turkey, 1999), that happened one year
before the introduction of Turkey Catastrophe Insurance Pool, only 5% of the assets
24
3.5. Competitiveness
Although this work relies on the underinsurance theme in the case of home
insurance – typically, a financial product for private clients – it would be also
interesting to understand in which way firms can produce some kind of behaviours that
can lead to underinsurance. Moreover, it is possible to find some firms as policyholders
of home insurance policies: real estate companies which have to manage the property
until the moment of the sale; firms that have real estate assets in their portfolio, etc.
We’ll see that in the case of corporate clients, different types of effects may be in place,
either by having a high or a small perception of .
In the case of small and medium companies, the amount of (impacting ) takes
an important role in the firms’ cost structure, what can make them more reluctant in the
moment they have to decide to buy or not more insurance. As a consequence, they may
tolerate more easily risk and uncertainty. Jones (2007) considered that even when it is
suggested that the level of insurance may be too low and the asset may be underinsured,
an increase of the and consequently in , is seen as lost of competitiveness, on the
assumption that competitors will maintain a low level of coverage, deciding for
themselves to be underinsured in order to have lower costs and to be, this way, more
competitive.
On the other hand, it’s important the fact that a house does not represent the same
for firms and for households, as for most of the families, their home is normally the
only asset they have, besides the fact that is the place where they live. Thus, apart from
emotional reasons, the likelihood of having a claim that damages a substantial part of a
unique asset should be a sufficient reason for people to be concerned in the moment
they have to define coverage and amount to insure. Even knowing that at a top-level,
25
of the firms don’t have the perception of the benefits ( they’ll get by buying
adequate protection measures: their managers don’t live there and the house may
represent only a small part of the portfolio.
3.6. Inertia and procrastination
Some of the factors that we may consider as costs and that may increase , are not
material or easily measured, even in terms of time. Some of those influencing variables,
like procrastination, are quite variable among different groups of individuals, are
emotional related and can be better explained by psychological theories and behavioural
approaches. However, they’re important to understand some of the reasons behind the
existence of underinsurance.
As explained before, some of the tasks that policyholders have to do in order to
reduce the risk of underinsurance are not very attractive, as they take a great amount of
time from them. This lack of interest mixed with a natural tendency that many
individuals have for procrastination, can increase the probability of postponement. In
fact, one of the most commons reasons why people successively postpone the review
and calculation of the amounts insured is the time they have to spend in this process
(consequently, a high ). But apart from valuations, there are also other very relevant
tasks that are often procrastinated or even ignored, such as the full reading of the
schedule and the policy wording or the regular contacts to the broker or insurance
company to ask questions or to review capitals. For that reason, actually, it is possible to
watch a great effort made by the insurers in order to explain some important clauses and
vocabulary or to help consumers to list the contents and to index the amounts insured to
26
saving some time to policyholders, but also to increase consumers’ awareness to these
problems.
The conclusion that inertia and procrastination are behind of underinsurance
problems can be found in the work of Jones (2007). However, instead of stressing the
cost side, his analysis is much more based in a relatively low . Jones’ main idea is that
is not conceded to insurance issues sufficient importance to impose for itself as priority,
in comparison with other aspects of life and because of that, individuals tend to impose
themselves a different prioritization.
3.7. Feeling of invulnerability
Underinsurance level may be also affected by the perception that individuals have of
the risks they may face in the future. Just like procrastination, presented in the previous
paragraph, this is another behavioural aspect that should be understood as an important
constraint when consumers buy insurance. In fact, demand is not always driven by the
desire to be protected, as many individuals don’t think that they might need an
insurance policy for “a rainy day” (consequently, a small ). Curiously, one of the
major forces that move consumers to purchase home insurance and that smoothes the
path to underinsurance, is the fact that is often required by financial institutions when
mortgages are negotiated. Without that obligation, levels of underinsurance would be in
many countries much higher.
Jolls and Sustein (2006) defined “optimism bias” as the tendency of people to
believe that their probability of facing a bad outcome is lower than it actually is, based
on substantial evidence that people underestimate their own likelihood of being
involved in a car accident or affected by a flood. In other words, there’s a belief that a
27
is a decrease in concern over whether the insured value is appropriated or not. Jones
(2007) also addresses that in many cases, consumers have a feeling of invulnerability
(believing that nothing really bad will happen to them) and informally get an optimistic
risk estimate that leads them to underinsure their assets in an attempt to reduce .
Decision-making processes are influenced by concepts and criteria that are available
to consumers at the time the decision has to be made, which means that policyholders
base their decisions mainly on their knowledge, feelings and previous experiences,
rather than in rational thinking presumed by traditional models. For Fox (2010), one of
these forces of influence is the fact that not many people have experienced the
low-probability losses for which they seek insurance.
3.8. Level of risk aversion
This section is also about risk perception, but from a slightly different perspective
from the previous one. It’s important to understand that, in many cases, policyholders
who don’t buy insurance policies because don’t perceive it as an important thing to do,
in fact, don’t have the full perception of the high risk taken. However, there are some
very rational consumers who consciously seek for a partial coverage of their assets, just
because they are more willing to accept risk.
Jones (2007) concluded that there are some consumers who are sufficiently wealthy
to self-insure. Similarly, a study from Dubin and Cicchetti (1994) about risk-aversion
and the decision to self-insure, points out that for most consumers, increases in income
lead to increases in the likelihood that self-insurance is selected, which corroborates the
hypothesis that wealthy individuals with greater levels of education, are less likely to
risk-28
averse and therefore it is higher the probability of self-insuring than consumers who
face restricted budgets.
Both groups rely on a small , as their perception of the benefit they’ll get is not
sufficient to avoid underinsurance. However, agents that may be affected by their
decisions (namely insurers and Government agencies) and that may be interested in
solving underinsurance problem, should be aware that different solutions are needed.
Investments in marketing and communication that are focused on the increase of the
awareness of consumers about underinsurance problems would certainly produce
different results, as the group who consciously seeks for a partial coverage have a much
better level of information to support their decision.
3.9. Inflation
Although the previous sections cover the majority of situations that lead to
underinsurance, not always the problem of underinsurance is explained by actions that
are produced by individuals. A particular case arises from the market dynamics of
supply and demand, specifically when a major event, like a catastrophic natural disaster,
occurs.
The occurrence of a great catastrophe can bring some inflation problems in
rebuilding costs, causing an unexpected situation of underinsurance. This problem is
explained by a pressure in prices that is caused by a quick increase in demand of goods
used in rebuilding works, not compensated by the supply side. According to Australian
Securities & Investments Comissions (2005) after the Camberra Great Bushfires, in
2003, as well as cyclones Tracy in 1974 and Larry, in 2006, or after the Newcastle
earthquake, major raises in rebuilding costs were observed. For example, following
29
In theory, total rebuilding costs can only be determined when there is a total loss.
So, only building reconstruction give us full information about the real value. If this
doesn’t really happen, underinsurance level is tested only against a hypothetical value.
This estimate will be necessarily based in predictable factors and any posterior,
unexpected and extraordinary increase at the cost level will put, very easily, the
consumer in an underinsurance situation.
Although we know that the occurrence of large catastrophes can lead to periods of
inflation, this is a particular form of underinsurance that should be understood in a
different way because is not apparent in the moment of the purchase. We know that
some geographic areas are very exposed to natural catastrophes, but even prudent
policyholders cannot predict the need to increase the amount to insure in order to face
30
4.
Consequences
The existence of home underinsurance, either for building, contents or both, has
some important implications that are important to be aware of. According to the
literature, there are some major risks that economic agents face when they fall into
“underinsurance trap”, and we can see that in extreme cases, its financial consequences
can be either socially dramatic for families or highly affect the profitability of an
insurer’s line of business.
In the next sections, we’ll present the greatest and most commonly referenced
pitfalls in the view of three different economic agents: homeowners, insurers and
governments which in some situations may appear not as a ruling organization, but
more as the representative agent of the whole society.
4.1. Homeowners
Of course, there is an evident gain for the policyholder when one of his assets is
underinsured, in the form of a premium saving. This issue was discussed in Chapter 3 as
one of the biggest incentives to set a lower capital, under the hypothesis of a constant
rate: if homeowners decide to underinsure their assets (being or not aware) and
assuming no claims happen, a part of their budget can be transferred to other activities
that can produce a higher level of satisfaction.
Nonetheless, many authors, researchers and several institutions, including insurance
companies, alert to the great financial risk that individuals face when underinsured and
to its consequences in people’s lives and businesses. For example, Oswald D.P., et al
31 goods they’ll need if a serious problem occurs. In this sense, we would like to
emphasize three specific situations that are related in literature:
Besides the trauma inherent to the claim (although not very common, it can
represent a total loss), policyholder can find that his insurance is not
sufficient to rebuild his house. - Australian Securities & Investments
Comissions (2005);
Wealth is not always based in liquid assets. Using nonliquid or scarce liquid
assets may have complicated consequences and individuals may have to
incur more debt. – Blankenau, J. et al. (2009)
There is also a potential failure of business if this kind of loss can cause
business interruption – Jones (2007).
In addition to the issues related above, strictly connected to problems of financial
nature and to its major consequences, there is also the case of having higher prices
caused by high levels of underinsurance which can affect individuals. According to
Jones (2007):
If sums insured are lower than the optimal level, insurers will be under
pressure to cover risk exposure and thus, there will be an impact on
premiums to those who choose to insure correctly;
If profitability declines due to this problem, it may result in that some
insurers will withdraw from this insurance class, causing less competition
32
4.2. Insurers
Although literature is more focused on consumers’ problems and in what could
happen if they don’t insure properly, some authors have done some work centered in the
implications for insurance companies.
As we saw in the last section, the work of Jones (2007) mentions the danger of
having problems in profitability. But besides that, a report from an Australian
government organization, Department of Planning and Community Development
(2009), points out some other major implications for insurers:
Underinsurance is seen as a gap that can distort the insurers’ perception
about the market and can lead to a wrong pricing policy;
If buildings and contents are underinsured, in the insurers’ point of view
there is a decrease in the size of the market.
4.3. Governments
In our research we also found several authors that give some attention to the effects
that underinsurance can have in societies and, consequently to the impact it can cause
on governments’ budgets and plans. In fact, a considerable part of the specialized
literature related to his subject, particularly from Australia, is written and issued by
governmental institutions that have large experience in dealing to problems arising after
great catastrophes and natural disasters.
Jones (2007) concluded that governments are one of the stakeholders that can suffer
from the impact of underinsurance, in the sense that taxes over premiums, in absolute
terms, are lower when insurers underwrite undervalued assets, since premiums are a
33
of Planning and Community Development (2009). But Jones (2007) also refers an effect
for society that can be transferred to government, at least in some extension: economic
impact from natural disasters and the inefficiencies of risks transfers between insurers
and individuals.
It seems to exist a general consensus on the fact that there is a burden for the public
sector, as many authors and institutions, wrote about this (for example, the Department
of Planning and Community Development (2009)), not only within household theme,
but also about health insurance (the work of Oswald D.P., Bodurtha J.N., Broadus C.H.,
et al (2005), for example). This idea seems to be directly connected to the subject
34
5.
Discussion on causes and consequences
This chapter aims to analyze the causes and consequences presented in previous
chapters, providing, where possible, a critical view on some of the issues presented by
literature available. Besides the idea of getting a statistical support to the presented
aspects, we think it’s important to:
i) Give these questions a quantitative dimension;
ii) Design an analysis framework allowing a better understand of these issues.
Another goal we pretend to achieve in the following sections of this chapter is to
understand what is happening in the Portuguese market and to see if some of the ideas
that were written by American or Australian authors and authorities can be translated to
the Portuguese insurance industry.
5.1. Brokers Survey
We conducted a survey to measure some of the aspects presented in this work as
causes of underinsurance. Our choice of interviewing insurance brokers was based on
the principle that they act as consultants, guiding consumers through a considerable part
of the decision-making process. That way, they can be close enough to them to
understand some of their major motivations.
A total of 100 Portuguese insurance brokers were anonymously surveyed, from a
group of 1.100 members of APROSE (Associação Portuguesa dos Produtores
Profissionais de Seguros), a Portuguese broker association, who were asked by e-mail to
answer a survey about underinsurance, available online. Questions are also available in
35
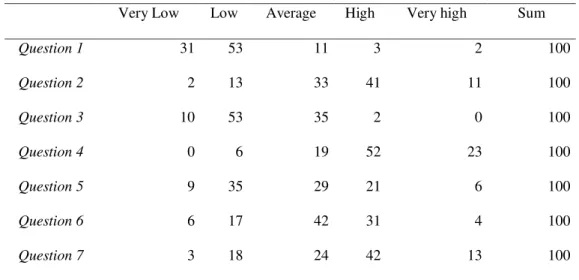
Table 5.1 presents absolute frequencies. Before entering into details of each
question, it’s interesting to see that, although some of the answers results (that can vary
from Very Low to Very High, with a five-level scale) appear to be around average
values, some are more concentrated on the extremes. Another interesting result is that
none of the surveyed brokers found that policyholders' will to quantify or to revise sum
insured for contents is very high or that the number of policyholders affected by the
feeling of invulnerability when facing non-compulsory insurance policies is very low.
Nr. of Responses
Very Low Low Average High Very high Sum
Question 1 31 53 11 3 2 100
Question 2 2 13 33 41 11 100
Question 3 10 53 35 2 0 100
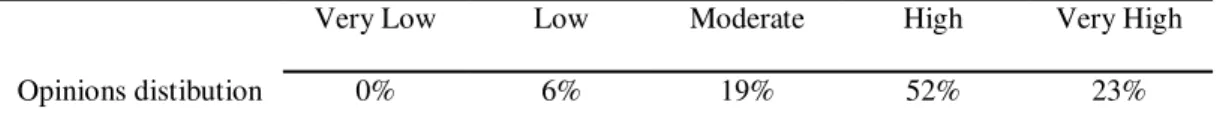
Question 4 0 6 19 52 23 100
Question 5 9 35 29 21 6 100
Question 6 6 17 42 31 4 100
Question 7 3 18 24 42 13 100
Table 5.1 Survey absolute frequencies
With the purpose of understanding the role of information on underinsurance, Table
5.2 provides an indication about how brokers percept policyholders’ knowledge of
insurance contracts. The results derive from Question 1: How large is the number of
policyholders knowing the existence and the effects of the Average Clause? Results
confirm the idea of a poor level of knowledge, showing that 84% of the brokers think
that only a small part of the market (Low and Very Low) knows the existence of such an
36
Nr. of policyholders that are aware of the existence and the effects of the
Average Clause
Very Low Low Moderate High Very High
Opinions distibution 31% 53% 11% 3% 2%
Table 5.2 Distribution of Portuguese broker's opinions about knowledge of insurance contracts
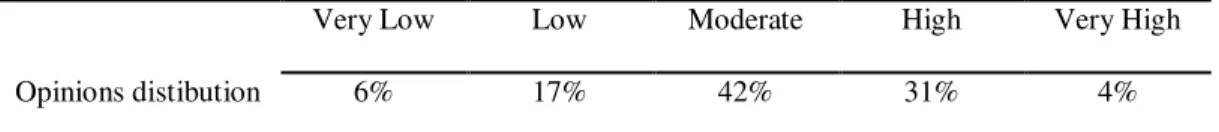
Although there’s a general consensus on the idea that low incomes, on average, lead
to low levels of education and information, we tried to understand the view of
Portuguese brokers about correlation between social and economic background and
level of knowledge (Question 6). Even if results in Table 5.3 are not perfectly clear,
there’s a bias to the right indicating that the majority of the brokers believe that this fact
is relevant.
Correlation level between policyholders' social and economic background
and their knowledge about insurance policies
Very Low Low Moderate High Very High
Opinions distibution 6% 17% 42% 31% 4%
Table 5.3 Distribution of Portuguese brokers' opinions about correlation between knowledge and
economical background
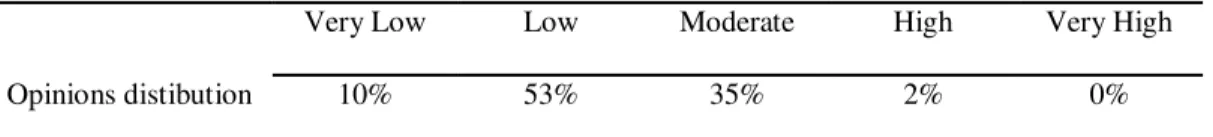
In Chapter 4 we presented some factors that could turn valuations in difficult tasks
to do, namely because of its cost and some behavioural aspects like inertia. Without
specifying the reasons behind it, Table 5.4 shows the distribution of Portuguese broker’s
opinion about the will to quantify or to revise sum insured, in terms of the number of
policyholders that are interested in doing it (Question 3). In this case, figures are very
37 think that policyholders’ will is greater than Moderate, although 63% find it Low or
Very Low.
Policyholders' will to quantify or to revise sum insured for contents
Very Low Low Moderate High Very High
Opinions distibution 10% 53% 35% 2% 0%
Table 5.4 Distribution of Portuguese brokers' opinions about the propensity of consumers to quantify or to
revise capital for contents
Table 5.5 illustrates the opinion of Portuguese brokers about the frequency of
underinsurance correlated with financial issues (Question 2). In other words, we wanted
to know if the number of cases in which individuals with financial problems try to
reduce capitals to get a smaller premium is high. It’s interesting to notice that only 15%
of the surveyed brokers think that is not significant (Low and Very Low) the number of
situations where financial problems lead to attempts of underinsurance. So, a
considerable part of this group of professionals seems to deal quite frequently with this
kind of issues.
A deeper analysis, centered in specific causes, would be needed to understand how
and in what extent, this behaviour can be motivated by other factors such as
unemployment, increase in tax levels (Section 3.3) or competitiveness reasons (Section
38
Nr. of situations where diminishing power purchasing leads to attempts of
underinsurance in order to reduce premium to pay
Very Low Low Moderate High Very High
Opinions distibution 2% 13% 33% 41% 11%
Table 5.5 Distribution of Portuguese brokers' opinions about correlation between financial problems and
underinsurance
We can find one of the clearest results of this survey in answers to question 4, where
we wanted to know how brokers perceive their customers in terms of invulnerability
beliefs (Question 4). Figures in Table 5.6 indicate that brokers think that their clients
have this kind of feelings, even when they’re not dealing with compulsory policies.
Data shows that only 6% of the brokers believe that this is a behaviour of small group
(Low and Very Low), but the majority (75%) thinks that the number of clients that act
like nothing bad will ever happen (High and Very High) is significant.
Again, we would have to make a deeper research in order to calculate the correlation
between sense of invulnerability and underinsurance level to see whether it could lead
to negligent attitudes (nothing bad will happen - Section 3.7) or to free-riding (someone
will pay - Section 3.4). However, results of the survey indicate that this type of
behaviour seems to be frequent to the eyes of insurance brokers.
Nr. of policyholders affected by the feeling of invulnerability (nothing bad
will happen) when facing non-compulsory insurance policies
Very Low Low Moderate High Very High
Opinions distibution 0% 6% 19% 52% 23%
39
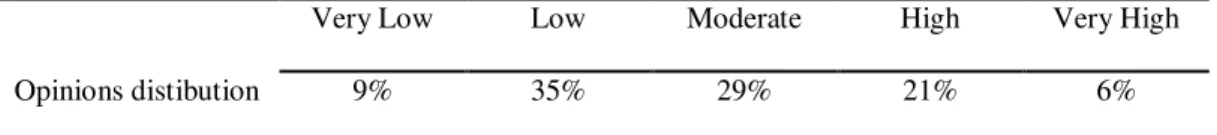
In Section 3.8 we saw that, according to some authors, there are individuals who
consciously seek for a partial coverage. So, we formulated Question 5 to see how
Portuguese brokers see this issue.
Results in Table 5.7 are not clear enough to conclude if it’s high the number of
individuals who make this kind of options, but the bias to the left indicates that brokers’
perception is that the number should not be very high. However it’s also important to
notice that only 9% of the brokers see this question as almost irrelevant (Very Low).
This may mean that there are some individuals who consciously underinsure.
Nr. of policyholders that, in a conscient and informed way, are willing to
self-insure or to underinsure in order to reduce premium to pay
Very Low Low Moderate High Very High
Opinions distibution 9% 35% 29% 21% 6%
Table 5.7 Distribution of Portuguese brokers' opinions about level of risk aversion
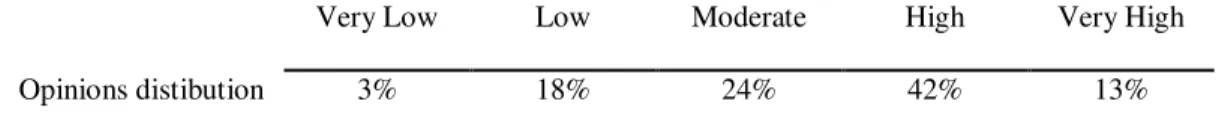
Since premium seems to be a key element that can influence consumers in their
decisions, we would like to get a quantitative measure about this influence. So, we
asked Portuguese brokers about what could be the risk of losing a business if there was
an increase in premium caused by an increase of the sum insured (Question 7).
Results in Table 5.8 show that brokers see demand as price sensitive, independently
of the cause behind price increases. More than a half thinks that risk of lapsing is High
or Very High. This is an important result, as we’re facing a great number of consumers
who apparently don’t care if the price increase is a result of an adjustment of the value
40
Level of risk that insurance companies face, in terms of lapsing likelihood,
by increasing premiums, as a consequence of the increase of the sum
insured
Very Low Low Moderate High Very High
Opinions distibution 3% 18% 24% 42% 13%
Table 5.8 Distribution of Portuguese brokers' opinions about risk of rate increases in terms of lapsing
likelihood
5.2. Consequences analysis
Here, we present our proposal for a framework based on some simple modeling, that
will help us to better understand what may be the consequences of underinsurance for
the two sides of an insurance contract: insurers and policyholders (in this section we
won’t extend the analysis to government bodies). Also based on Portuguese statistics,
this framework should provide some quantitative indicators about how extent could be
the consequences of underinsurance for the two agents, in the context of the Portuguese
market.
The following sub-sections should also give us some information that could allow
us to make a critical review on literature about underinsurance, particularly, about its
consequences for insurers and customers.
5.2.1. Homeowners
i. Savings
Just like is reported on the literature about the subject, the most obvious gain for the
policyholder is the amount of premium he can save by setting a low sum insured.
In order to better understand the relationship between underinsurance and higher
41
existence of underinsurance. Denote the premium as and the percentage of
underinsurance as . We should also recall as the policy rate and as the sum insured.
Then, we’ll also define savings, denoted as , as the difference between what would
be the premium with and without underinsurance:
,
where and are given constants. If consumers have the power to artificially
reduce the sum to insure, they should expect to save an extra amount of money.
Now let represent the number of years in which policyholders have their assets
underinsured and, assuming there are no changes in rates, sum insured and
underinsurance level, we’ll have annual savings being multiplied by the number of
years underinsured. represents the savings in year .
Along the years, policyholders will see the amounts saved being increased, just like
42 Figure 5.1 Evolution of savings
This work will not focus the discussion around consumers’ utility function or any
dynamics in their choices of consumption, even knowing that would be important to
understand their motivation to insure correctly or not. However, this analysis shows
that, independently on the valuation given to insurance or any other alternative, there is
the possibility of get some savings that, theoretically, could be better applied elsewhere.
ii. Financial losses
Underinsurance usually brings two types of problems after the occurrence of a
claim:
Even without average clause, the claim paid by the insurer (limited to the
sum insured) may not be sufficient, especially when a total loss occurs, to
rebuild the house or to replace the contents lost.
Considering average clause, policyholders will not get anything from
insurers for the proportion uninsured.
0% 20% 40% 60% 80% 100%
1 year 5 years 15 years S
43
Since great or even total losses are not the most frequent situations, the average
clause is possibly the most important source of financial problems. But before starting
to explain in detail the reason why average clause, together with underinsurance, can
produce unwanted effects, it is crucial to make a distinction between different forms of
underinsurance:
Level of real underinsurance that corresponds to the difference between real
value and capital insured and that is determined by policyholders, even if it’s
not really a conscious and rational process.
Level of underinsurance determined by insurers. After the claim, insurance
companies may decide to hire a loss adjuster that can observe some
differences between their perception of the asset’s value and the sum insured
in the policy schedule.
For the purpose of this discussion, we’ll consider the second type, under the
hypothesis that it is the value that will be decisive in claims’ settlement, no matter what
is the real underinsurance value or the figure determined by individuals in the moment
of subscription.
In order to better understand the financial impact we will calculate the burden that
policyholders face when they underinsure. So, let represents the percentage of loss, in
respect to the real value of the asset, previously to the claim. The burden that
policyholders have to bear for not taking all the risk is , where:
We should note that the financial impact for policyholders, in absolute terms, will
44
underinsurance. Other variables that could influence this sum, like deductibles, for
example, will not be taken into account.
We can get a relative measure for the impact of in customers’ budgets, we
decided to calculate an indicator that should answer the following question: in case of a
claim where the assets are underinsured, how much time will it take to pay
, without a significant change in consumption patterns? In other words, this indicator
should provide us the number of yearly savings ( ) that would be necessary to pay the
claim that should be paid by an insurance company, if everything was properly insured.
Defining as the household’s annual savings, as the household’s net income
and as the savings rate, then is given by:
It’s easy to understand that the burden to consumers in terms of the number of years
to pay the claim, is not only positively dependent on assets’ value, percentage of loss
and level of underinsurance, but is also negatively dependent on the families’ pattern of
savings. As a result, the idea presented by Blankenau, J. et al. (2009) that underinsured
individuals may have to incur more debt, seems to be reasonable, especially on those
who have not liquid savings.
We can simulate some scenarios with different levels for our variables, in such a
way we can obtain a good understanding of . Again, we chose to use Portuguese data
to run the simulations, so we could see what could be the impact over the average
Portuguese household. Data is related with building rather than with contents, but this
focus is more a consequence of the availability of data than a choice motivated for any
45
significant, due to his social importance and to the fact that, in terms of insured
household assets, there are much more buildings than contents. The inexistence of a
generalized benchmark for contents in the Portuguese market, like we can found on the
case of buildings (rebuilding costs per geographical region), induces us to think that
may be a large problem of underinsurance in contents and that, as a consequence, it
would be important to get some quantitative measure of financial impact caused by a
loss in contents. Nonetheless, using the same framework, we could do the exact same
analysis for contents that we will do for buildings..
Basically, we aimed to simulate different results for , basing our calculations in
Portuguese average values for the area of a house, its rebuilding costs, savings rate and
households’ income. Using these values we simulated for different percentages of
loss and underinsurance to see the extension of impacts in function of these two
variables. Full details about formulas and figures used in Appendix B.
Figure 5.2 shows that the impact on household’s savings can achieve very different
levels of magnitude, depending on the combination of claim severity ( ) with the
46 Figure 5.2 Impact of underinsurance on households' savings (with average clause)
Although we cannot actually find data about average levels of underinsurance for
the Portuguese market, for the sake of this discussion we will use some benchmarks in
order to get a picture of the problem. Surveys that were made in Australia in the first
half of the last decade, according to a study made by the Australian Securities &
Investiments Comission (2005), reported a range of average levels of underinsurance,
from 10% to 40%, approximately, depending on the study. We will also separate the
type of claims according to the following classification, in terms of . Even without a
formal classification, the objective is to separate claims by its severity.
0,00 5,00 10,00 15,00 20,00 25,00
0,00% 20,00% 40,00% 60,00% 80,00% 100,00%
δ=90%
δ=70%
δ=50%
δ=30%
δ=10%
α