MODEL OF EVALUATION OF PERFORMANCE TO
PORTUGUESE CITIES
André Cardeal dos Santos
Project submitted as partial requirement for the conferral of Master’s in Management of Services and Technology
Supervisor:
Prof. Carlos Jerónimo, Professor Auxiliar Convidado, ISCTE Business School, Departamento de Marketing, Operações e Gestão Geral
ii
Spine
-MOD
EL
OF
EVA
LUAT
ION
OF
PE
RFOR
MANC
E
T
O PORT
UGU
ESE
CIT
IE
S
ANDRE
FILI
PE
CARDEAL
SAN
TOS
iii
Aknowledgements
Gostaria de agradecer à minha família - à minha mãe, ao meu pai e ao meu irmão - por todo o apoio e por serem a base de tudo o resto. Por me incentivarem sempre a querer mais e a trabalhar em prol dos meus objetivos. Pelo exemplo de determinação e perseverança que me transmitem. Este trabalho é-vos dedicado, como agradecimento por tudo aquilo que são. O meu sucesso é o vosso sucesso.
Ao amigo e Professor Carlos Jerónimo, por me ter sempre motivado e incentivado fazer este trabalho. Por, desde o início, ter demonstrado interesse e empenho no tema. Pela disponibilidade em ajudar em qualquer hora e qualquer sítio. Que este seja o princípio de uma boa colaboração.
Ao Eduardo, por, desde início, ter cultivado o interesse pelo tema e por incentivar sempre a pensar fora da caixa.
Ao amigo e colega José Santos. Obrigado pela disponibilidade e ajuda (muito preciosa) na organização estatística. Desde que falámos contigo te mostraste disponível, mesmo em horários
manhosos.
Por fim, aquela pessoa que todos os dias me motiva e me faz querer sempre mais. À pessoa que nunca me deixa desistir de nada, e que puxa por mim sempre que estou menos motivado. À pessoa que, nos momentos bons, ri e festeja comigo; e, nos menos bons, me apoia e nunca me deixa cair. A pessoa que, ao longo dos anos, me demonstrou que com trabalho e empenho tudo se consegue. A quem devo muito do que sou hoje, como pessoa e como profissional. Obrigado, amor. Até sermos velhinhos.
The best way to predict the future is to create it. Peter Drucker
v
Abstract
Sustainability is a deep concern to governance entities worldwide. Governments and NGOs are working together in politics and policies to pursue this global objective. In particular UN, with several goals defined through the last decades, assume a leading role within this topic. To achieve the targets defined, diverse strategies and frameworks came up. As backbone of these strategies arose the Indicators. It enables a periodic measure and allows a process of continuous monitoring. The ISO37120 set of indicators, for certain characteristics, stands out between its contenders. During this thesis, its intended to explore this standard. Through a critical analysis developed with inputs of a specialist, ISO37120 characteristics, advantages and disadvantages are examined. This work is sustained on a double-face characteristic of the standard: its global application. After this work, the objective is to show that it is possible to develop a model, based on ISO37120, specifically for the municipalities in Portugal. In that way, Portuguese cities were stratified by population density and, through a survey, selected which categories were considered more relevant for the assessment, according citizens point of view of their municipalities’ particular context. Once collecting all the answer, a correlation analysis is done, to comprehend which Indicator has more influence on the overall classification of the category. This analysis was done taking into account the sample results, that in turn, facing its dimension, cannot be extrapolated to the overall population. Despite that, this model presents itself as a preliminary study about the subject.
Keywords: Sustainability, Population Growth, Sustainable Development Goals,
Standardization, Indicators, Municipalities
JEL Classification:
Q010: Sustainable Development, Sustainable Governance, Sustainable Growth, Sustainable
Regional Development
Q560: Environment and Development; Environment and Trade; Sustainability; Environmental
vii
Resumo
A Sustentabilidade é uma preocupação real para as entidades governamentais de todo o mundo. Governos e ONGs trabalham em conjunto no desenvolvimento de políticas que ambicionam este objetivo global. A ONU, em particular, com vários objetivos definidos nas últimas décadas, assume um papel de liderança neste tópico. Para atingir as metas definidas, surgiram diversas estratégias e frameworks. Na base dessas estratégias estão os Indicadores, que permitem uma medição periódica através de um processo de monitorização contínua. O conjunto de indicadores ISO37120 destaca-se de entre seus concorrentes e, ao longo desta tese, pretende-se explorar esta norma. Através de uma análise crítica desenvolvida com contribuições de um especialista, são abordadas as características, prós e contras. A base deste trabalho é uma característica de dupla face da norma: é globalmente aplicável. Após este trabalho, pretende-se mostrar que é possível desenvolver um modelo, baseado na ISO37120, especificamente para os municípios portugueses. Para tal, estratificaram-se as cidades portuguesas por densidade populacional e, através de um questionário, analisou-se quais as categorias consideradas mais relevantes para a avaliação, do ponto de vista dos cidadãos, no contexto particular dos seus municípios. Depois de recolher todas as respostas, elaborou-se uma análise de correlação para compreender qual o indicador tem mais influência na classificação geral da categoria.
Esta análise foi realizada com base nos resultados da amostra que, por sua vez, perante a sua dimensão, não podem ser extrapolados para a população em geral. Apesar disso, o modelo apresenta-se como um estudo preliminar sobre o tema.
Palavras-chave: Sustentabilidade, Crescimento Populacional, Objetivos de Desenvolvimento
Sustentável, Padronização, Indicadores, Municípios
Classificação JEL:
Q010: Desenvolvimento Sustentável, Governo Sustentável, Crescimento Sustentável,
Desenvolvimento Regional Sustentável
Q560: Meio Ambiente e Desenvolvimento; Meio Ambiente e Comércio; Sustentabilidade;
ix
Table of Contents
1. Introduction ... 1
1.1. Objectives & Research Questions ... 3
2. Literature Review ... 4
2.1.Sustainable Development ... 4
2.1.2. Since Habitat Agenda to SDGs ... 7
2.1.3. Millennium Sustainable Development Goals (MDGs) ... 8
2.1.4. Transforming our world: the 2030 Agenda for Sustainable Development ... 9
2.2. Cities ... 11
2.3. Population and Population Density ... 11
2.4. Indicators ... 14
2.4.1. Framework of Indicators – ISO ... 15
2.4.2. World Council on City Data (WCCD) ... 19
2.4.3. ISO 37120 Critical Analysis ... 20
2.4.4. Measurement Challenges ... 22
2.4.5. INE & Pordata ... 22
2.5. Portugal Segmentation – State of the Art ... 23
2.5.1. Territorial Division ... 23 2.5.2. Statistical Division ... 25 2.5.2.1. NUTS ... 25 2.5.2.2. LAUs ... 26 2.5.2.3. Geography of Census ... 27 3. Conceptual Framework ... 28
4. Methodology and Methods ... 30
4.1. Interview and Empirical Knowledge ... 31
4.2. Survey ... 32
4.3. Data Analysis ... 32
5. Results ... 36
5.1. Class A - Very Low Density ... 37
5.2. Class B - Low Density ... 38
5.3. Class C - Medium-High Density ... 40
5.4. Class D - Very-High Density ... 42
x
7. Conclusion ... 51
7.1. Limitations & Future Studies Recommendations ... 53
8. Bibiography... 55
xi
List of Tables
Table 1 - Sustainable Development main events by UN ... 5
Table 2 - Portuguese Administrative Division ... 24
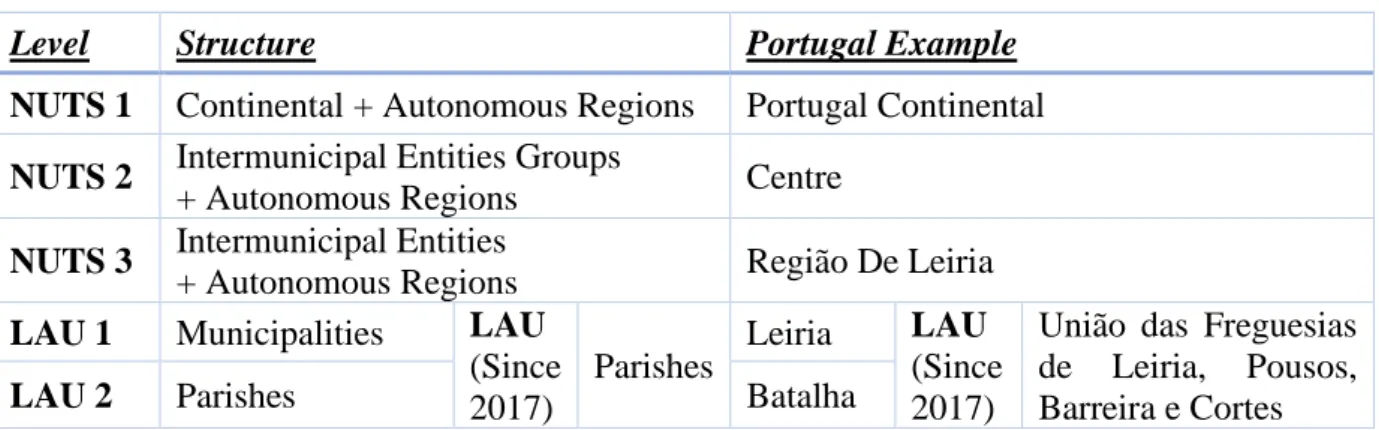
Table 3 - NUTS demographic dimension limits ... 25
Table 4 – NUTS and LAU example of Portugal ... 27
Table 5 - Sample of Municipalities with Density Population (inhabitants / km2) (Source Pordata) ... 30
Table 6 – Distribution categories of municipalities through Classes ... 31
Table 7 – Class A overall results per Category ... 37
Table 8 - Pearson’s Correlation of Indicators on Category ... 38
Table 9 – Class B overall results per Category ... 39
Table 10 - Pearson’s Correlation of Indicators on Category ... 40
Table 11 - Class C overall results per Category ... 41
Table 12 - Pearson’s Correlation of Indicators on Category ... 42
Table 13 – Class D overall results per Category ... 43
Table 14 - Pearson’s Correlation of Indicators on Category ... 44
Table 15 – Top 5 categories distribution: General and Classes ... 45
Table 16 - Pearson Correlation for top classified categories (Class A) ... 46
Table 17 - Pearson Correlation for top classified categories (Class B) ... 46
Table 18 - Pearson Correlation for top classified categories (Class C) ... 47
Table 19 - Pearson Correlation for top classified categories (Class D) ... 48
Table 20 - Model of Evaluation Cities Performance ... 49
Table 21 - Summary table with all Categories and Indicators selected as most relevant to assess, SDGs to which they contribute ... 50
xii
List of Figures
Figure 1- MDGs by UN (source United Nations) ... 8
Figure 2 - SDGs by UN (Source United Nations) ... 10
Figure 3 - Population growth by UN (Source United Nations) ... 12
Figure 4 - Population Density in Portugal, by municipalities (2018) (source Pordata) ... 13
Figure 5 - WCCD Data Portal (Source WCCD Portal) ... 19
Figure 6 – Pordata example of number of crimes per 1,000 inhabitants (Source Pordata website) ... 23
Figure 7 - Portugal Administrative Divisions - Sintra example. ... 24
Figure 8 - NUTS in Portugal (Source Pordata) ... 26
Figure 9 - Distribution of Answers by Municipalities ... 30
Figure 10 - Distribution of answers by class (absolute numbers) ... 36
Figure 11 - Distribution of answers by class ... 36
Figure 12 – Class A answers distribution ... 37
Figure 13 – Class B answers distribution ... 39
Figure 14 – Class C answers distribution ... 41
1
1. Introduction
Migration phenomena is deeply involved in society development. Probing for better conditions has been considered the original trigger, but other external factors promote several changes in the root cause of this practice. During the 18th century, Europe faced Industrial Revolution and, from that moment on, Migration increase to numbers never seen before. That was the turning point of an important social phenomenon, and since then the numbers are growing exponentially.
By the year of 1950, there was about 750Mi people living in the urban areas and today this number extraordinarily reach 4.1Bi. Facing this, urban cities had to change their governance, organization and policies to host more 3.5Bi people in less than 70 years. Cities had to reinvent themselves to answer this challenge considering the fact that this number never stops (Ritchie & Roser, 2018).
Society evolves, and cities must follow that growth. Its needs are not stable as it changes through time. Our grandparents did not had electricity in their house; thus, their main need was to get it. Today, the millennial generation knows the possibility of running out of potable water 100 year, thus the main need is to save it to future generations and work on parallel solutions. City mayors and/or administrators must be able to understand those needs and prepare a bearable response to it. This challenge is very complex once society is an open system influenced by internal factors such laws and policies, and external such, for instance, economic crisis, natural disasters or new scientific discoveries.
During the second half of the 20th century some scientists, politicians and other personalities start to raise a flag about an issue called sustainability and thinking about the future of Earth. By the year of 1987, the UN request to the World Commission on Environment and Development a global agenda for change, asking for new strategies to sustainable development, ways of co-operation between country’s to achieve common objectives, ways and means to deal more effectively with environmental concerns and to help defining shared perceptions of environmental issues and the efforts needed to successfully deal with it. It was a long-term agenda and outline ambitious goals to world population (World Commission on Environment and Development, 1987). Was an extensive report where the sustainable development topic was finally discussed and defined as the “development that meets the needs of the present without compromising the ability of future generations to meet their own needs” (World Commission
2 on Environment and Development, 1987). As conclusions, the authors of the also called Brundtland Report state that they were “unanimous in our conviction that the security,
well-being, and very survival of the planet depend on (…) changes, now” (World Commission on
Environment and Development, 1987).
Back to 21st century, these concerns are present in our quotidian. Today there are already some strategies taught in schools and well established in society that aim sustainable development. From the simple ones as recycling, to scientific complexity such renewable energy sources, world community is doing this path. These strategies were designed because issues were analysed, and it was concluded that We were going in the wrong direction and must do something to mitigate that.
In 2015, the United Nations define 17 Goals to Sustainable Development, which focus our biggest challenges today, such those associated with poverty, inequality, climate, environmental degradation, prosperity, and peace and justice. The Goal number 11 focuses precisely in cities sustainable development, arguing that efficient urban planning and
management practices are in place to deal with the challenges brought by urbanization. At the
same time, the International Standards Organization, ISO, developed a global framework with 100 indicators to help cities to analyse their situation and compare with others to, eventually, improve their status.
Both of these initiatives are a tremendous incentive to municipalities draw their path to sustainable development.
This project starts with a set of questions related to performance and smart cities. This set of questions made me start looking and searching for literature in that direction.
To clarify a set of concepts, web of science was used and, the search, focus on key words and expressions such smart cities, performance evaluation, smartness, big data in cities and/or
cities evolution. At the end of this first search, peer-reviewed journal articles and papers were
selected, to analyse and investigate. High percentage of these articles addressed the concepts and the influence of IoT (Internet of Things) in the existence of smart cities. Despite understanding its importance, that was not the project subject that was delineated for the thesis, and so, it was decided to go further and searching for topics such sustainability, governance and sustainable development. Quickly, the research hit papers where the centre of discussion was the ISO 37120 and sustainability. Ever since that moment, the research started to be more incisive and the models of ISO and 2030 Agenda came up as baseline to this dissertation.
3 Thus, with the subjects more structured, each of the models were analysed and concluded that those were related, as the ISO standard contributes to Sustainable Development Goals of UN. Both models were developed to provide monitoring, consulting and evaluation parameters of public services, to promote sustainable growth in a homogeneous way (Moschen, Macke, Bebber, & Benetti Correa da Silva, 2019). And so, ISO 37120 starts to be deeply analysed on the literature, to comprehend this standard purpose, evolution, dimensions and gaps.
1.1. Objectives & Research Questions
This dissertation will focus on the global goal of Sustainable Development. The main objective of this thesis is to propose a model to evaluate the performance, in terms of sustainability and quality of life, explicitly to Portuguese municipalities. The main questions that this thesis aims to answer are:
1. Is it possible to adapt ISO37120 into Portuguese municipalities?
2. Are Sustainability and quality of life requirements different within Portuguese municipalities?
3. How can a framework of indicators help Portuguese municipalities reach 2030 Agenda targets?
During this thesis, these questions will be addressed. Based on the Literature and in the methodology used throughout this work, Discussion and Conclusion sections will elucidate the importance of these topics.
4
2. Literature Review
2.1.Sustainable Development
The first sustainability idea emerged by the hand of a German forester called Hans Carl von Carlowitz, when in his book titled Sylvicultura Oeconomica formulated the idea of sustainable use of forests (Carlowitz, 1713). The book was published in 1713 when Europe faces the need for vast quantities of wood and forests progressively become deforested. Von Carlowitz suggests the conservation and planting of trees, to reduce the risks of people suffer great difficulties. Forests management, in von Carlowitz idea, should contribute to its sustainability, by getting the most significant harvest without overexploiting it, guaranteeing its regeneration (Carlowitz, 1713)(Turcu, 2013).
Through the years, despite the comprehensive definitions along with the literature, Sustainability and Sustainable Development have not a specific and unambiguous definition. In many definitions, there are different approaches to goals, strategies or methods (Schaltegger, Hansen, & Spitzeck, 2016). Nevertheless, the definition of von Carlowitz (1713) was the kick-off for many other authors to give their inputs and to spread the ideal of Sustainability (World Ocean Review, 2015).
Already in the ‘80s, WCDE becomes the first institution to defines Sustainable Development globally. The Brundtland Commission, in 1987, define it as the development that meets the
needs of the present without compromising the ability of future generations to meet their own needs (World Commission on Environment and Development, 1987). This definition is built
under two key concepts: needs, which manly refers to the poor around the world and who needs should be a priority; And, the idea of limitations imposed by technology and social structure on the environment's. Environment and Development are the main concerns, being Sustainable Development an effort to link both economic progress and environment stability while a long-term value of the environment is guaranteed. Herewith, the Brundtland Report was unique in the literature, once it addressed the need for economic development without compromising natural resources. Dernbach (2003), based on the previous definition, argues that Sustainable Development protects and restores the environment, rather than damages or pollutes it. The idea of Sustainable Development address the global environmental degradation and global poverty, without harm economic development, social well-being, peace and security - similarly to the definition from the Brundtland Report - is also defended by the author (Dernbach, 2003).
5 The meeting following the General Assembly of 1987, was the conference known by Earth
Summit (United Nations Conference on Environment and Development), in Rio de Janeiro
1992. The principal purpose of holding this conference was that Sustainability was too complicated for each of the member states face it individually. Therefore, the Earth Summit was the table for all member states, to share knowledge and to collaborate with each other. As outcomes, some significant documents with a common target – achieve Sustainable Development – were developed. A political declaration of principle to environment and development - Rio Declaration on Environment and Development; An action plan to implement Sustainable Development - Agenda 21; and a document with recommendations for preservation and sustainable development in forests - Forrest Principles.
To monitor the outcomes of the Earth Summit, the UN create a department dedicated to Sustainable Development. The UN Commission on Sustainable Development (CSD) was officially established in December 1992, as a functional commission of the UN Economic and Social Council. It was the entity responsible for promoting and overseeing the outcomes of Rio Conference - CSD (United Nations Commission on Sustainable Development, 2019).
After all debates, a complete definition of Sustainable Development emerged. Was delineated that the concept of Sustainable Development considers three base pillars - which are economic, social and environmental – as well as the interlinkages between them. These three dimensions are intrinsically related, in such a way that the progress of Sustainable Development depends on the development of each dimension independently, and on the development generated collectively (Forum & Secretariat, 2011).
2.1.1. Sustainable Development by the United Nations
This thematic is a deep concern for the United Nations. Since the 1990s, the path has been mapped, and objectives were defined, aiming sustainable development worldwide. See, below, the main events and outcomes since the 90s until today:
Table 1 - Sustainable Development main events by UN
Event Main Outcomes Description
1992
Earth Summit
R.J, Brazil.
Agenda 21
Agenda 21 was adopted by around 180 countries It comprehends a global plan of action, undertaken by governments and big institutions.
Following the conference, the UN created the Commission on Sustainable Development (CSD) – to monitoring and controlled the
6 implementation of the actions stated on the Agenda. 2000 Millennium Summit NY, USA Millennium Declaration: Millennium Development Goals (MDGs)
Millennium Summit in NY, Millennium Development Goals were elaborated. It is main objective was to reduce poverty worldwide within by the year of 2015. 2002 World Summit on S.D. South Africa Johannesburg Declaration on Sustainable
Development and the Plan of Implementation
It was adopted at the World Summit on Sustainable Development in South Africa and endorsed the global commitments to poverty eradication and the environment. It was built on Agenda 21 and the Millennium Declaration by including more emphasis on multilateral partnerships
2012
UNCSD (Rio 20)
R.J, Brazil.
"The Future We Want"
This document was adopted by members of the UN. Here they decided, to introduce a process to develop a set of SDGs to build upon the MDGs. On the forum, the UN also establish the UN High-level Political Forum on Sustainable Development. It also contained other measures for implementing SD, including obligations for future programmes of work. 2013 Open Working Group General Assembly
- Open Working Group to develop a proposal
on the SDGs. 2015 Sendai Framework for Disaster Risk Reduction -
Based on the previous Hyogo Framework, it defines feasible goals and a framework for disaster risk reduction. Climate change adaption and disaster risk reduction were two dimensions highlighted by UN members; 2015 Addis Ababa Action Agenda on Financing for Development -
This framework aims to align financing flows and policies with economic, social, and environmental priorities 2015 Paris Agreement on Climate Change -
The first world’s extensive climate agreement. The main goal assents to decrease global warming by the reduction of greenhouse gas emissions and increases the usage of renewable energy and energy efficiency. Its long-term goal is to reduce the increase of global average temperature and limit it to 1.5 ºC, once it reduces the risks and effects of climate change;
7 2015
Transforming our world: the 2030 Agenda for
Sustainable Development
-
Adopted at the UNSDS in New York, it describes the 17 Sustainable Development Goals,
2.1.2. Since Habitat Agenda to SDGs
United Nations Agency for Human Settlements – UN-HABITAT - section was created after the Habitat I Conference, in Vancouver 1978, where the main concern was to prevent issues promoted by rapid urban growth worldwide. Following this, during the late 80s, Indicators start to be used in a collective form when UN-HABITAT start to help countries and cities to collect and apply indicators data using Housing Indicators Programme (United Nations Human Settlements Programme, 2004). This framework focuses mainly on housing issues and aspires to help defining policies who face those problems (Flood, 1997).
The success of the project led to its improvement and orientation to other assignments, such as sustainable urban development, and, in preparation to the Habitat II Conference, in Istanbul, the Urban Indicators Programme (1993) was developed, having a strong focus on urban issues and concerns. This framework, per si, was conceptualized to collect essential data on cities aiming the monitoring of its performance (Flood, 1997). Hence, during the conference in Istanbul, in 1996, a large number of stakeholders evolving representatives of high-level governments, personalities from the private sector, NGOs, media, researchers and academics, discuss universal goals such human shelter, healthier and safe cities, anticipating the new millennium changes. Its main outcome was named Habitat Agenda, a statement where the need to improve the quality of human settlements to instigate well-being and quality of life is highlighted, and that defined commitments and recommendations to countries worldwide (United Nations Human Settlements Programme, 2004).
UN-HABITAT was responsible for monitoring the progress of the Agenda implementation, and, to report trends worldwide. To achieve that, developed a system of indicators composed of 20 key indicators and nine qualitative subsets, which were the minimum required to accomplish those commitments defined (United Nations Human Settlements Programme, 2004).
8
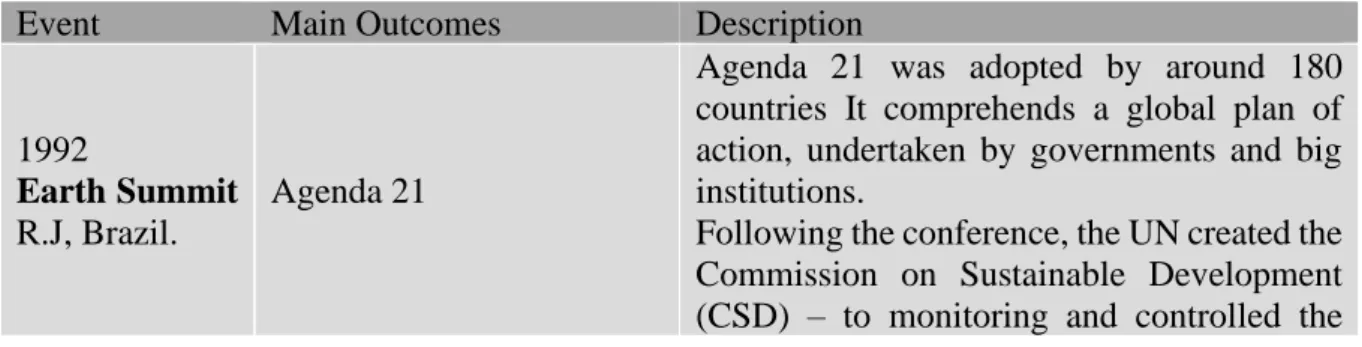
2.1.3. Millennium Sustainable Development Goals (MDGs)
MDGs were the principle outcome of the Millennium Summit in 2000, which take place in New York. The Summit was the result of previous meetings with participation of a thousand ONGs from worldwide. During this meeting, the forum approached several issues such as poverty eradication, environmental protection, human rights and protection of the vulnerable and, as a consequence of the discussions, in the Millennium Summit Declaration was established. MDGs represent a global partnership commitment. As all people share the same principles of dignity, equity and equality, global leaders have the responsibility to sustain and improve. In particular, Leaders had an obligation to all humans and especially to future generations. (United Nations, 2000). Globalization as a particular focus in the MSGs. Facing this phenomenon, the UN had to guarantee that it takes a positive impact on everyone’s life. Although it provides great opportunities, costs and benefits are unevenly distributed, where countries, in developing and third world countries face serious difficulties under this circumstance. On the other hand, established countries, had more flexibility and are well structured, conditions that facilitate the process.
Therefore, policies and measures must be developed to help the vulnerable countries, allow them to participate and cooperate to a shared future. Through this plan, globalization is moving toward a fully inclusive and equitable scenario. The policies and measures were formulated and implemented with the inputs of every countries, despite its conditions. For this cooperation, the UN enumerate some values which consider being vital for international relations in the 21st century: Freedom, Equality, Equality, Solidarity, Tolerance, Respect for Nature and
Shared Responsibility. (United Nations, 2000)
Figure 1- MDGs by UN (source United Nations)
9
2.1.4. Transforming our world: the 2030 Agenda for Sustainable Development
2030 Agenda focuses on actions oriented to people, to the planet and to reach prosperity. It is a
guide to achieve Sustainable Development, where the principal requirement is to eradicate
poverty, in any dimension of the concept (United Nations, 2015).
Towards the path of the world, the UN define these steps to change into a sustainable and a resilient direction. To achieve it, partnerships and collaboration between all stakeholders are the keys.
The Agenda aims to achieve Sustainable Development in a balanced and integrated way through three main dimensions: economic, social and environmental. For that, there are 17 SDGs defined, with 169 targets segregated through those three (United Nations, 2015).
This plan is a re-form of Millennium Development Goals. Facing a new reality, new issues and new subjects appear. Consequently, MDGs become outdated. By adding new goals and targets the Agenda fulfil that gap, being a direct evolution of the MDGs (Woodbridge, 2015).
The SDGs are centred and concerned with fives “P’s”: People – To end poverty and hunger and provide to humans’ tools to have a life with dignity, equity in a healthy environment;
Planet – Protect the earth from degradation, through efficient consumption and production, as
a sustainable managing of natural resources, supporting the needs of our generation and the future ones; Prosperity – A prosperous life, with economic, social and technological progress;
Peace – Promote peaceful, inclusive societies without fear and/or violence; Partnership –
Global solidarity focus on particular needs, is the required attitude (United Nations, 2015). Based on these five concepts, worldwide leaders worked together, as a team, to develop a universal policies agenda and draw a path to SD. These policies were created to be universally applicable, despite the technological, economic or social level, where Governments define how to incorporate global goals and targets within their country strategies.
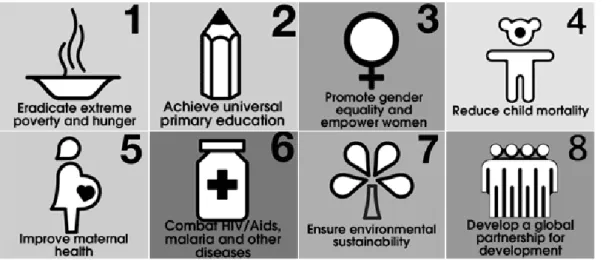
The 17 Sustainable Development Goals are:
1. End poverty in all its forms everywhere;
2. End hunger, achieve food security and improved nutrition and promote sustainable agriculture;
3. Ensure healthy lives and promote wellbeing for all at all ages;
4. Ensure inclusive and equitable quality education and promote lifelong learning opportunities for all;
10
5. Achieve gender equality and empower all women and girls;
6. Ensure availability and sustainable management of water and sanitation for all; 7. Ensure access to affordable, reliable, sustainable and modern energy for all;
8. Promote sustained, inclusive and sustainable economic growth, full and productive employment and decent work for all;
9. Build resilient infrastructure, promote inclusive and sustainable industrialization and foster innovation;
10. Reduce inequality within and among countries;
11. Make cities and human settlements inclusive, safe, resilient and sustainable; 12. Ensure sustainable consumption and production patterns;
13. Take urgent action to combat climate change and its impacts;
14. Conserve and sustainably use the oceans, seas and marine resources for sustainable development;
15. Protect, restore and promote sustainable use of terrestrial ecosystems, sustainably manage forests, combat desertification, and halt and reverse land degradation and halt biodiversity loss;
16. Promote peaceful and inclusive societies for sustainable development, provide access to justice for all and build effective, accountable and inclusive institutions at all levels;
17. Strengthen the means of implementation and revitalize the Global Partnership for
Sustainable Development.
(United Nations, 2015)
Figure 2 - SDGs by UN (Source United Nations)
11
2.2.Cities
Cities play an important and unique role in people’s life, and urbanization has a tremendous impact on the world economy. About 80% of the global gross domestic product is generated in cities. In terms of population, World Bank data estimates that today over 4Bi people lives in cities, which represents more than half of the earth population. This trend will continue to grow and, by 2050, it is predicted that the urban population will double and 7 out of 10 people will live in cities (Ritchie & Roser, 2018).
In this context, world city leaders must be able to strategically plan cities path to a sustainable direction, to provide services, infrastructure, houses and green areas, ensuring the quality of life to their citizens.
With this emphasis, urban cities, if well managed, may contribute to global sustainable growth. Nevertheless, facing this fast-growing of population, urbanization also brings challenges, and if the leaders are not aware, it could be catastrophic. Those mentioned above - services, infrastructures, houses and green areas – and others such jobs, health care or education, can be part of the solution if well managed, or part of the problem, if not considered. Climate, per si, is a field where urban cities contribute most worldwide, which is not positive. More than 70% of global greenhouse gas emissions came from it, being consumed 2/3 of the entire world energy. This increases the climate risk and makes cities more vulnerable to environmental disasters such as storms or increased sea level.
To protect and guarantee the future of communities, governments must take steps to promote and disseminate well-being and quality of life. These actions should lead the city to become more inclusive, secure and resilient, following the path of sustainability.
The phenomenon of rapid urbanization is a serious matter in urban cities. Monitoring cities performance on sustainability become highly significant. It is the only way to understand the as-is state and take the actions needed to reach the primary goal.
2.3. Population and Population Density
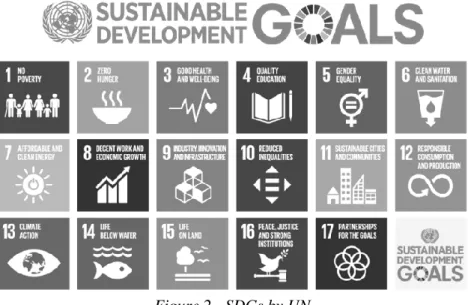
The UN (2019) project that by 2050 the world population reaches 9.7Bi people. A 26% increase in today’s population (UN DESA, 2019). It brings serious concerns in terms of sustainability and to SDGs.
12 In terms of global trends, the decrease of mortality rate and increase of fertility rates, increase in food production which nourishes the population, and the increase of urbanization and migration, are promoting this population growth (UN DESA, 2019).
For Biology, population refers to the total number of organisms living in the same area (Biology Dictionary, n.d.). Population Biology studies the characteristics, size and distribution of population, as well as how it is influenced (Biology Dictionary, n.d.). A key measure on this field is population density, once it gave a unique vision about the relation population/space (Weinstein, Boulder, & York, 2015).
𝐷𝑒𝑛𝑠𝑖𝑡𝑦 = 𝑄𝑢𝑎𝑛𝑡𝑖𝑡𝑦 ÷ 𝐴𝑟𝑒𝑎
Density is the distribution of a quantity per unit of space or the number of individuals per unit
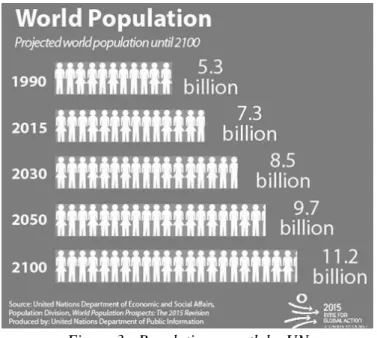
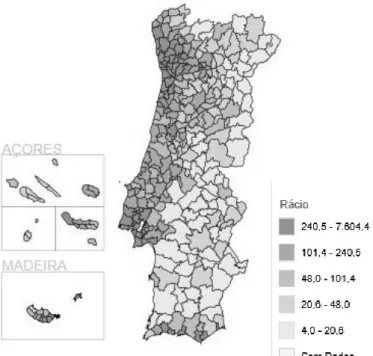
area (Khan Academy, n.d.). For instance, for Portugal, the Population density is 111,7 inhabitants per kilometre square, in average (see figure below). For the UK, it is about 279,1 (UN DESA, 2019). The country with the highest population density rate is Macau, with 21419,59 inhabitants per km2 (UN DESA, 2019).
This measure allows the comparison between geographic areas. It reflects many aspects of the urban system, so much that it is a relevant input of city planning policies, being considered by
Figure 3 - Population growth by UN (Source United Nations)
13 literature as on policy making tool to decision makers (Millward, 2008) (Ehrlich, Kemper, Pesaresi, & Corbane, 2018).
With population density, governments can understand the intensity and the distribution of population and the level of urbanization (Ramírez-Aguilar & Lucas Souza, 2019), once it is an element of urban form (Jenks & Jones, 2010). Predictably, municipalities that are urban centres with high levels of employment, diversified commerce and industry, and tendentially with high road traffic, are considered high densely municipalities.
Urban Planners see population density as an opportunity (Urban Hub, 2016) to better understand and to define population needs. Millward (2008), share the same idea, and argues that to assess of the intensity of residential development it is the right measure. Although, it is important to mention that Density is more useful to small areas, instead of big regions or countries (Rosenberg, 2019).
It is a measure that is used to several purposes and to understand specific phenomena’s (Weinstein et al., 2015). It is possible to assess different types of density by using specific types of individuals/populations. Weinstein and Pillai (2015) also argue that it is possible to assess, for instance, the density of ethnic groups, races, families living in poverty, and much more. Following this idea, Ehrlich, Kemper, et al., (2018) claim that with population density it is possible to quantify the spatial extent of human presence and it is used to evaluate social impacts on climate issues, both on local or global scale. Ehrlich, Kemper, et al., (2018) also add that this measure combined with other variables/indicators might bring interesting results. For
Figure 4 - Population Density in Portugal, by municipalities (2018) (source Pordata)
14 instance, by crossing information of people living in poverty and population density it is possible to assess the exposure of people to that risk.
To the SDGs, population density play an important role. For some of those, is required the definition of the urban areas, and therefore, population density is the primary measure. As SGDs are all about monitoring, this assessment is used over time in distinct goals defined on SDGs (Ehrlich et al., 2018).
2.4. Indicators
According to Cambridge Academic Content Dictionary, the noun Indicator means “something
that shows what a situation is like”, and on the economic and finance field, “something that shows what a situation is like or how it is changing”. In this way, the OECD states that an
indicator “is a quantitative or a qualitative measure derived from a series of observed facts that
can reveal relative positions in a given area”. Thus, to define the as is state, the use of
Indicators it is the natural process. When evaluated at regular intervals, it can point out the direction of change across different units and through time, identify trends and outliers, and be very helpful to benchmarking and monitor performance. Once knowing the as is state, it is possible to identify where to go – targets – and by policies and strategies move in that direction. For cities, to monitor their performance in a wide range of fields, it is particularly important. By the earlier 20th century, governments use most economical and social indicators to assess performance. Unemployment Rate, GDP (gross domestic product), GNP (gross national product), Balance Sheets or Inflation, are examples of Indicators that have been used by governments to assess their cities or countries. Although, some global events that occur had a great impact on many grounds, and the need expanding the assessment fields emerged. World War II is the turning point, where some international groups such World Health Organization (WHO), the OECD and UN start to track the cities and nations performance in the various campus. Health, Economic and Social issues and phenomena start to be measured and collated to assess productivity and performance.
Since the 90s, this concern for monitoring has proliferated to other sectors such as public administration and services – as education or public health. Also, the measurement of cities
character, with characteristics as competitiveness, quality of life and well-being being
15 In this way, governments can assess cities corner to corner, defining their strengths and weaknesses, and finding their opportunities and threats. By the end of the day, with the help of indicators, municipalities were able to assess their performance, study trends and monitoring their improvements on the various dimensions and use all the conclusions to make decisions and communicate the accomplishments to all the stakeholders (Singh, Murty, Gupta, & Dikshit, 2012). Indicator points to the right direction and the right attitude should be No policies without
indicators, no indicators without policies (Flood, 1997). Indicators and policies, to be efficient
and effective, should, and must, have a parallel evolution (Flood, 1997).
2.4.1. Framework of Indicators – ISO
International Organization for Standardization is an NGO based in Geneva who promotes standards worldwide. Fields as Technology, Agriculture and Healthcare are covered and normalized by ISO standards through specification for products, services and systems.
At present, ISO has members from 161 countries, 245 technical committees and several subcommittees responsible for developing the standards, and at the moment more than 22.000 International Standards and documents were published, covering almost features of technology and manufacturing processes (ISO, n.d.-a).
International Standards guarantee an excellent level for products and services. For consumers, it ensures products safety and good quality, being ISO a stamp of quality assurance certificate. On the other side, for companies, it helps to minimize waste and to increase productivity. Furthermore, ISO is the bridge to entering new markets and to act globally (ISO, n.d.-a). The process for developing ISO Standards is triggered by need. If a market needs, people who will be impacted and will use it is engaged in the process of creation. Their level of expertise will help to develop the standard. It is an interrelation between the 161 national standards bodies, the Experts and the Central Secretariat, which coordinates all the process and publish the standards (ISO, n.d.-a).
Scientific Management is the mother of Standardization (Taylor, 1911). It leads to uniformity, reducing the variance level and increasing efficiency (Gilson, Mathieu, Shalley, & Ruddy, 2005).
16
2.4.1.1. ISO Technical Committee 268 (ISO / TC268) - Sustainable Cities and Communities
This Technical Committee (TC) was created in 2012 with the scope of standardization within Cities and Communities. The TC divides itself into working groups, to develop requirements, frameworks, supporting and techniques and tools, aiming sustainable development. The committee concern is to help Cities and Communities - both rural and urban - to become more sustainable
The outcomes of TC268 contribute directly to the UN SDGs - previously addresses in this dissertation. It has already contributed with five ISO standards. The application of these undertakes the path to sustainability, encouraging the development and implementation of integrated approaches to achieve the targets of the 2030 Agenda the main goals (ISO TC 268, 2013).
Whether the location, the context or the stakeholders, suppliers and service providers need to have guidelines and recommendations to improve their service and to become resilient on it. This committee purpose is to help to build the bridge between the need to increase efficiency and the need for sustainability. It is expected that through this standardization, the ultimate goal become clarified. Moreover, along with the vast number of Sustainable Development definitions present in the literature, such as the various frameworks and assessment tools, turn this into a blurry reality. TC268 engage cities representatives and experts to develop those standards and to contribute with their know-how to spread and share knowledge globally. As ISO is responsible for more than 20k standards and recommendations to help companies, society and other types of organizations, standards are created upon a strong and solid base, providing the tools and awareness to a better performance aiming resilience and sustainability (ISO, 2017).
2.4.1.2. ISO 37101 - Sustainable development in communities
This ISO developed a management system for sustainable development. This standard was published in 2016 and establishes a managerial system for Sustainable Development in communities, aiming consistency with policies in that purpose. It helps to link Sustainable Development to communities by turning it in something measurable. It is achievable through the transparency of the use of programs, implement strategies, develop projects, plans or
17 services, and sharing the results with the community. This community engagement will improve their contribution to the sustainable process. ISO 37101 also requires the measure of progress towards sustainability.
For ISO, this standard should be implemented by an organization designated by the community, which should establish an organizational framework and provide the resources needed to support management environmental, economic and social performance outcomes. It is also stated that it is applicable to any community, despite size, structure or type, or even despite the context of its location, being this a point which will be discussed in the next paragraphs.
2.4.1.3. ISO 37120 - Sustainable development of communities
This ISO is a set of indicators for city services and quality of life, It was primarily published in 2014, and as it is now on the second edition. This standard follows the ISO37101, and it defines and establish methodologies with indicators to measure and manage performance in cities, and introduced a mutual basis for reporting, comparison and benchmarking. It helps cities municipalities and city leaders to set tangible targets. This approach enables cities to evaluate their as-is state and compare it to other cities and seeing where they stand in relation to other cities, no matter where in the globe. By knowing the as-is, cities can define a to be state and strategically delineate a plan to improve, achieving quality of life and sustainability.
ISO 37120 standard is divided by nineteen different areas, which are Economy, Education, Energy, Environment and Climate Change, Finance, Governance, Health, Housing, Population and Social Conditions, Recreation, Safety, Solid Waste, Sport and Culture, Telecommunication, Transportation, Urban/Local Agriculture and Food Security, Urban Planning, Wastewater and Water (ISO, 2018).
There are 132 indicators categorized in three levels – mandatory, supportive and profile – and defined how to measure it. In total, there are 25 profile, 46 fundamental and 59 supporting indicators to measure and report.
In the ISO 37120 publication, were found the areas, indicators and also the way to collect them. Please, see the example of the city’s unemployment rate, which is part of the Economy category, and is considered a core indicator.
18
A city’s unemployment rate shall be calculated as the number of working-age primary residents who during the survey reference period were not in paid employment or self-employment, but available for work and seeking work (numerator) divided by the total labour force (denominator). The result shall be multiplied by 100 and expressed as a percentage. Unemployment shall refer to individuals without work, actively seeking work in a recent period (past four weeks) and currently available for work. Persons who did not look for work but have a future labour market stake (arrangements for a future job start) are counted as unemployed (International Labour Organization). Discouraged workers or hidden unemployed shall refer to persons who are not actively seeking work because they believe the prospects of finding it are extremely poor or they have restricted labour mobility, face discrimination and/or structural, social and cultural barriers. They are not counted as part of the labour force and are therefore not considered to be unemployed. Not actively seeking work shall refer to people who have not taken active steps to seek work (e.g. job searches, interviews, informational meetings) during a specified recent period (usually the past four weeks).
Labour force shall refer to the sum of the total persons employed and unemployed who are legally eligible to work and who are primary residents of the city.”
(ISO, 2018).
This standardization, promoted by the ISO standards, offers a more rational municipal management. Indicator act as a decision-making tool, once express the real picture of the city and, knowing this, the actions are taken more accurately. Also, as it is applicable in large scale – this ISO standard is globally applicable – cities may learn from each other’s, for instance, a strategy applied by city A to answer to low performance on indicator X, may be used by city B who has the same lack of performance on such indicator. This stimulates cities to interact with others and benchmark them against other cities globally, being possible to classify cities for their performance. For this, WCCD stipulates five levels of recognition for cities, according to the number of indicators collected. Thus, cities can be recognized with the Aspirational medal, when there are 30-45 core indicators collected; Bronze medal, when collect 46-59 indicators where 46 are core and the others 13 are supporting; Silver medal, with 60-75 indicators with 46 core and between 14-29 supporting; Gold medal, collecting 76-90 indicator with 46 core and 30-44 supporting; and, with 91-100 indicators, divided by 46 core and 45-54 supporting, collected, the Platinum medal is the top level certification a city can get.
As examples of this practice, cities like Los Angeles, London, Helsinki, Buenos Aires or Amsterdam had assessed themselves using this framework. In fact, Amsterdam had assessed its performance in 2014, 2015 and in 2016, being an example of how this framework must be used – on a yearly basis, to monitor and evaluate the progress. In Portugal, there are two cities recognized as certificated with ISO37120: Sintra, in 2017, with a Platinum medal and Porto in
19 2016 and 2017 with a Gold and Platinum medals respectively (World Council on City Data, n.d.)
2.4.2. World Council on City Data (WCCD)
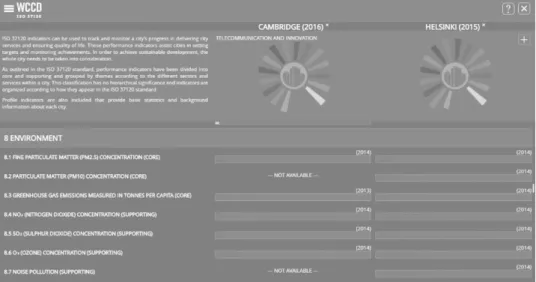
WCCD is a global platform which aims to build liveable and better cities globally, through city data. Sustainable Development Goals are also part of WCCD goals, and such, its portal means to help cities leveraging their quality – reducing the gap between them – by globally comparable data, achieving this way their commitments with SDGs (James, 2017). It is the official partner of ISO37120 to list and centralize the information about cities who use and apply the standard. Cities registered in WCCD must have its data verified by a third-party and then provide it to WCCD Open City Data Portal (James, 2017).
Data is distributed by the 17 themes and 100 indicators and there are around 1.2M combination available, where it is possible to forecast, benchmarking, monitoring and analyse trends. To facilitate the link with ISO37120, the portal is divided in profile – which provides background information (such, for instance, Population, Land Area, Population Density) of the city -, core and supporting indicators, as it is grouped by themes according to different sectors and services. It follows the logical order of standard. Please, see figure below.
Figure 5 - WCCD Data Portal (Source WCCD Portal)
20
2.4.3. ISO 37120 Critical Analysis
ISO standardization offers to consumers offers a product quality assurance, guaranteeing its safety, reliability and confidence needed to use. It is the mission of ISO and, it is addressed to any object aiming standard coverage (ISO, n.d.-b).
ISO helps governments and private organizations to increase their efficiency and to reduce or eliminating their waste (for instance, of time, of productivity, of resources) (ISO, n.d.-a). The International Standard 37120 does that for cities. Governments, using this tool, can understand what is wrong with their community, in an overall view, and take some actions to change the scenario. It is important to mention that ISO37120 is an assessment tool and, therefore, it should be considered for decision making (Ahvenniemi, Huovila, Pinto-Seppä, & Airaksinen, 2017).
The approach should be surrounded by a PDCA – Plan, Do, Check and Act - cycle: define goals and processes needed to achieve results (Plan); Implement procedures and practices (Do); Monitor and control the procedures and practices implemented, report and measure it against the goals defined in plan phase (Check); and, afterwards analysing the results take some actions to reach the goals (Act) (Fitsilis, 2018). This decision-making process brings founded and quality decisions to the table. Inevitably, cities, proceeding with this get better results in their way to sustainability and quality of life. Knowing their actual performance, it is easier to define objectives to evolve into a favourable level of performance and offer high quality of life to its communities, making the Governance much more effective.
ISO 37120 came in 2014 to answer to a relevant issue of sustainability frameworks: There were no standardized indicators (Mcmanus & Haughton, 2006)(Tanguay, Rajaonson, Lefebvre, & Lanoie, 2010)(Shen, Jorge Ochoa, Shah, & Zhang, 2011)(McManus, 2012).
Nevertheless, through an interview with consultants who are experts in the implementation of this standard, it was realized that this is an unusual scenario. Governments commonly use the ISO37120 as advertising material to campaigns and to promote their work as government, using the international certification as a stamp of proper management. It is not necessarily bad – it can demonstrate that there was a concern to realize where they could improve –, but the process is frequently abandoned halfway. Once getting the certification according to their level of analysis, the D, C and A of PDCA are forgotten.
Despite this common uncomplete use of the standard, the process of getting indicator collected, help governments to know where they stand when comparing to other cities. This competitive environment has a positive impact on cities, as among them they can learn and share knowledge
21 and practices, helping each other to evolve straightforward to the common objective. ISO 37120 presents itself as a standard that might be used by any municipality despite its location, dimension and level of development, which aims to know its performance. As a global standard, it precisely allows benchmarking and shared knowledge. On the other hand, this global coverage is not fair when it comes to cities personality. The city uniqueness might not be captured by global and standardized indicators, and so the use of the framework as a tool for decision making might be skewed (Deng, Liu, Wallis, Duncan, & McManus, 2017; Elisa K. Tatham, Daniel A. Eisenberg, 2014; Krank, Wallbaum, & Grêt-Regamey, 2013; Moreno Pires, Fidélis, & Ramos, 2014; Sharifi & Murayama, 2015; Turcu, 2013).
It is also possible that cities have already established a strategy and a method of reporting sustainability and performance. This new pack of indicators might not fit in (Elisa K. Tatham, Daniel A. Eisenberg, 2014; Moreno Pires et al., 2014).
Each city has its own characteristics, which are the base to its economy and social environment. For instance, a city as Nazaré (Portugal), traditionally known as a fishing town, where one strong pillar of economy and social life is the fishing activity, cannot compare itself with a city as New York (USA), globally known as a financial and commercial metropole, or to a city in deep India where no electricity and sanitation exists. This is not a reasonable comparison. Unsurprisingly, developed cities had a higher range of services, almost in every sector/area, being able to assess more (probably all) indicators, getting a better certification. Less developed cities are, historically, linked to some particular sector/industry, and are directly connected to each other: when the industry has good results, and it is profitable, the city follows that trend; when the business is not going well, the city suffers side effects. Metropolis, per si, have a high diversity of businesses, which support the economy and social life.
This standard is also very wide in the fields of assessment. It has +100 indicators, based and developed to cities by cities, divided by 19 themes, already mentioned above. This allows a deep and full range assessment, giving a complete performance evaluation. For instance, section 6 – Education – have as core indicator the percentage of female school aged population enrolled
in schools; on section 12 – Health –, also a core indicator, the number of in-patient hospital beds per 100.000 population; and, last example, on section 18 – Transportation – the core
indicator of annual number of public transport trips per capita (ISO, 2018). It allows the governance to get fully detailed information about its city and community.
It is undoubtedly a transversal assessment, but is it suitable for every city? Might be, however consultants state that in some cases it is as complete as it becomes impossible to measure. In some cases, there are indicators that not fit in the real context. Here are again the first cons
22 mentioned in this paragraph. For instance, in the Education section (6) one core indicator is the
percentage of students completing primary education. In Portugal it is mandatory, so it might
be redundant to measure. Otherwise, in under-developed countries, this might be important to measure and to monitor progress. The needs are different, and so, to be more effective, the indicator must be adapted according to some criterions.
This dissertation aims to develop a model specifically to Portuguese cities, where the indicators will be used to measure according to cities characteristics and biggest needs.
First, cities context in Portugal will be explained, and thus, limits of the model will be defined.
2.4.4. Measurement Challenges
Measurement is not linear as it should be, it faces some challenges in the overall process of collecting, implementing and continuous monitoring.
These global standards – as mentioned on the critical analysis of ISO 37120 – flawed, in part, for being too wide. The indicators are, in some cases, very difficult to obtain. Especially in countries under-development. In these, city-data is very difficult to get, because the governments do not collect the data (Bosworth, 2017). Sometimes, the data that exists is not detailed, which may compromise the overall analysis and, in the worst-case scenario, be the basis to decisions misaligned with reality (Bosworth, 2017).
Still, in the indicators field, the frameworks had as an advantage the possibility to compare cities between each other. Despite being true, it has some criteria to do that correctly. This is only possible if the data is well collected from trustworthy sources and with consistency on the analysis (Mavrič & Bobek, 2015).
2.4.5 INE & Pordata
In Portugal, as a 1st world country (World Population Review, n.d.), to get general statistic data it is reasonably simple. Portugal has two main sources – which are INE (National Institute of Statistics) and PORDATA – who are powered by Census, EU Statistics, Public Entities data, private studies and other databases.
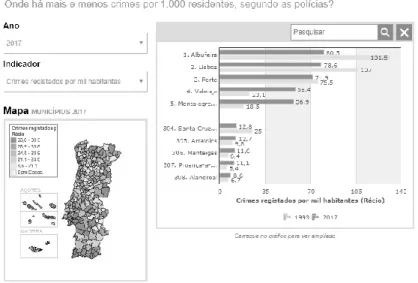
PORDATA divides its statistics by three groups: municipalities, Portugal and Europe. In terms of municipalities statistics, PORDATA, per si, has about 773 tables divided by 15 subjects. In the portal, it is possible to see indicators data individually (by chosen a municipality) or in general. In Portugal, it presents statistics of the country. Moreover, in Europe, it is possible to
23 see statistics of European countries and even to compare them, in a similar way of the municipality’s comparison.
These two entities are good sources of data, where municipalities can access to information about themselves and analyse the overall scenario. However, it does not allow a global comparison, when relating to ISO 37120. It demonstrates the values; the user has to manage that information.
ISO has a framework to allow the comparisons and it is global. By the end of the day, it is no nonsense to say that databases as INE and PORDATA will supply ISO indicator analysis.
2.5. Portugal Segmentation – State of the Art
2.5.1. Territorial Division
Portugal has two different territorial divisions, which are the administrative division - through
freguesias, municípios and the distritos – and, statistical division – with UE standardization
strategy NUTs, LAUS, Census among others.
The Administrative Division is the older division legally established. On the Portuguese Republic Constitution (PRC) of 1976, the government determines autarquia local as a legal entity to represent the people within territorial limits and it is responsible to promote the public interests. In continental Portugal, there are 3 levels of autarquias locais, the freguesias,
Figure 6 – Pordata example of number of crimes per 1,000 inhabitants (Source Pordata website)
24
municípios and distritos. In the autonomous regions, the autarquias locais are simply freguesias
and municípios. In the same PRC, it gives to both archipelagos their own political and administrative capacity, mostly due to their particularities in economic, social, cultural and geographical dimensions. By the same year of 1976, the Political-Administrative Constitution of Autonomous Regions of Madeira and Azores, was approved and the 1st level of autarquia
local is assumed for the archipelagos. Nevertheless, despite of distritos, it is used ilha (island)
(INE, n.d.).
In this way, the Administrative Division is structured as:
Table 2 - Portuguese Administrative Division
1st Level Distrito (continental Portugal) Ilha (Madeira and Azores) 2nd Level Município
3rd Level Freguesia
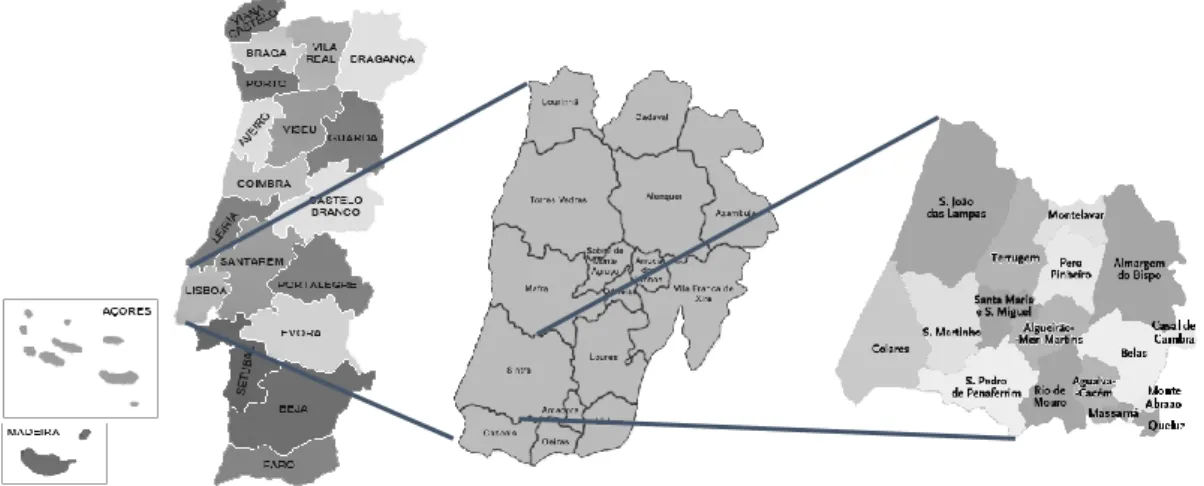
Nowadays, Portugal has 18 distritos and two islands – Azores and Madeira. Then, those 18 districts are segregated in 308 Municipios (old concelhos). In the islands, they are also segregated in municípios, in which Madeira as 11 and Azores 19. The third level of division is about parishes. Portugal, since 2013 (during this year, Portugal reorganize its territorial division with the RATF program - Reorganização Administrativa do Território das Freguesias), has 3092 parishes (Freguesias de Portugal, n.d.).
The figure above represents how the divisions work. It is the example of Sintra. Sintra is part of Lisbon district - who has 16 municipalities - and aggregates 17 parishes. Each of these had the junta de freguesia, responsible for the governance of the parish. Sintra, as a municipality,
25 has the câmara municipal, responsible for the governance of its territory. It is the executive body of the municipality (Quintela, 2019).
2.5.2. Statistical Division
Despite Administrative Divisions, it has been necessary to develop some different territorial divisions for statistical purposes (INE, n.d.). Facing different scenarios of population growing, urbanization or even the continuous search of statistical information, the analysis must arrange different levels and criteria. The most well-known statistical division is NUTS - Nomenclature of Territorial Units for Statistics.
2.5.2.1. NUTS
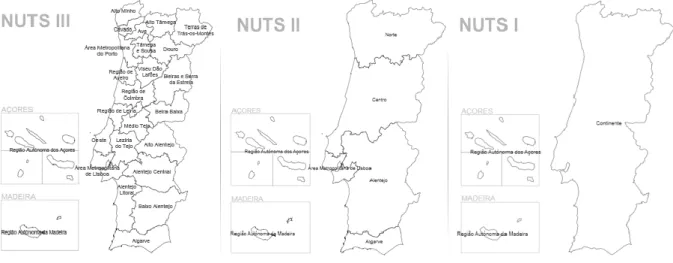
Was developed under the needs of policy making and design, regional issues analysis and with the main objective of construct a single, coherent system for dividing up the EU's territory in order to produce European statistics (Dijkstra & Poelman, 2017). NUTS started as a gentleman’s agreement and, by nearly 00s it achieves legal status, being approved and regulated by the European Parliament in 2003. European Commission state that since that moment on “…all Member States' statistics transmitted to the Commission, which are broken down by territorial units, should use the NUTS classification, where applicable” (European Parlament, 2008). NUTS guarantee stability in the statistics, as this classification assures that data refers to the same regional units for a certain range of time (legally imposed of 3 years, at least) (Eurostat).
Currently, the classification in force refers to NUTS 2016. It is a hierarchical system for the division of EU economic territory to collect, develop and harmonize EU statistics, analyse the regions in a socio-economic dimension and to frame the policies regionally. This is valid since 1st January of 2018, and it has 104 NUTS 1, 281 NUTS 2 and 1341 NUTS 3 regions. These levels are determined according to the principle of population. NUTS 1 refers to main socio-economic regions, NUTS 2 to regions and NUTS 3 for sub-regions (INE, 2015).
Note the following table:
Table 3 - NUTS demographic dimension limits Level Minimum Maximum
26
NUTS 1 3.000.000 7.000.000
NUTS 2 800.000 3.000.000
NUTS 3 150.000 800.000
There are other two principles. NUTS classification favours administrative divisions of each country, which is supportive of the availability of data and increases policies implementation capacity. Moreover, it is also susceptible to amendments, regular or extraordinary. Despite not being common to happen within a period of 3 years, when a relevant event occurs, it might be susceptible to revision. As an example of that, when Portugal required to the EU Commission an extraordinary revision due to a relevant reorganization of the administrative structure. Portugal reduces the number of NUTS 3 from 30 to 25 and 16 of them suffer changes in territorial dimensions, and 12 receive a new designation (Economia e Finanças, n.d.).
Figure 8 - NUTS in Portugal (Source Pordata)
2.5.2.2. LAUs
LAUS (also developed by Eurostat) aims to meet the demand on statistics at the local level. NUTS, as mentioned above, were developed up to regional level. Therefore, there was the need to be more specific in statistics. Thus, NUTS 3 regions were subdivided and then all territory was covered: LAU 1 and LAU 2 (Eurostat, n.d.)