Universidade de Lisboa
Faculdade de Ciências
Departamento de Engenharia Geográfica, Geofísica e Energia
Enabling solar electricity with electric vehicles in future
energy systems
Pedro Rudolfo Martins Nunes
Doutoramento em Sistemas Sustentáveis de Energia
Universidade de Lisboa
Faculdade de Ciências
Departamento de Engenharia Geográfica, Geofísica e Energia
Enabling solar electricity with electric vehicles in future
energy systems
Pedro Rudolfo Martins Nunes
Tese orientada pelo Prof. Doutor Miguel Centeno Brito e coorientada pelo
Prof. Doutor Tiago Lopes Farias, especialmente elaborada para a obtenção
do grau de doutor em Sistemas Sustentáveis de Energia
Para
A Mónica. Os meus pais.
Todos os outros que me são queridos nesta vida. Sem esquecer o Fagulha.
“What concerns me is less the mechanics of the transition – the shift from brown to green energy, from sole-rider cars to mass transit, from sprawling exurbs to dense and walkable cities – than the power and ideological roadblocks that have prevented any of these long understood solutions from taking hold on anything close to the scale required.” “…climate change changes everything.” Naomi Klein, This Changes Everything
Acknowledgments
I am deeply grateful to my supervisors, Prof. Miguel Brito and Prof. Tiago Farias, for readily having accepted me and giving me the opportunity to continue my Ph.D. They generously have proposed me this fruitful working area and placed in me their trust. Later, in the course of my work, they led me in the right path with invaluable comments and suggestions. Especially Prof. Miguel Brito, the main supervisor and with whom I worked closer, taught me to distinguish the essential from the accessory in scientific research and allowed me to develop my academic and research skills.
Special thanks to Prof. João Serra, the coordinator of the MIT Portugal Program in Faculty of Sciences of the University of Lisbon (FCUL), for always providing me with support.
I would like also to thank Fundação para a Ciência e Tecnologia (FCT) for funding my Ph.D research work, scholarship SFRH/BD/51130/2010, and the MIT Portugal Program on Sustainable Energy Systems for the framework provided.
Finally, many thanks to all my colleagues and fellows and friends at FCUL. They know who they are.
i
Resumo
As alterações climáticas estão na agenda dos líderes mundiais e dos decisores políticos, pois contê-las é fundamental. Neste quadro, a União Europeia traçou metas ambientais exigentes, como a redução das emissões de gases com efeito de estufa em 80-95% até 2050. Para isso, os sistemas de energia terão de assentar em energias renováveis, particularmente em energia fotovoltaica, uma vez que no futuro esta parece ser a forma com maior potencial de geração de electricidade limpa. Porém, esta situação contribuirá para o desfasamento entre a produção e o consumo, com geração de energia solar em excesso durante o dia. Esta energia em excesso pode ser convenientemente canalizada para a mobilidade eléctrica, aproveitando a capacidade das baterias dos veículos eléctricos a funcionar como armazenamento controlável e distribuído.
Na presente tese, com base em cenários do ano 2050 para o caso de Portugal, exploram-se as sinergias entre a energia fotovoltaica e os veículos eléctricos, determinando-exploram-se os níveis mínimos de penetração que permitem o cumprimento das metas na área do ambiente. Analisa-se em que medida a energia fotovoltaica permite uma maior integração do veículo eléctrico, e vice-versa. Os impactos na rede de energia eléctrica são determinados quantitativamente, assim como a penetração necessária de uma tecnologia que permite a implantação da outra.
Os resultados do modelo mostram que as metas para as emissões de CO2 só podem ser
alcançadas com elevadas penetrações de energia fotovoltaica e veículos eléctricos, o que reforça a necessidade da existência de infraestruturas para carregamento dos veículos durante o dia, tal como nos locais de trabalho. Mostra-se que 100% de energia eléctrica renovável é possível com determinadas combinações entre as duas tecnologias e que as metas ambientais para redução de emissões de CO2 são apenas alcançáveis com pelo
menos 40% de penetração de veículos eléctricos no mercado.
A presente tese contribui para a literatura sobre a integração na rede eléctrica de elevados níveis de energia renovável e sobre a interacção entre energia renovável e veículos eléctricos.
Palavras-chave: Veículos eléctricos; Cenário energético; Energia fotovoltaica; Sistema
iii
Abstract
Climate change is on the agenda of many world leaders and policy makers, and its containment is of exceptional importance. Within this frame, ambitious environmental targets have been established by the European Union, including the reduction in greenhouse gases emissions by 80-95% until 2050. To do so, energy systems will require a large share of renewable energies, particularly solar photovoltaic power, since it appears to have the greatest potential for decarbonized electricity generation. However, relying on such renewable energy sources is expected to generate a mismatch between production and consumption, namely considerable excess solar electricity during day time. This excess power may be conveniently used to power electric mobility, taking advantage of the battery capacity of the electric vehicles acting as distributed controllable storage.
In this thesis, based on 2050 scenarios for the case study of Portugal, the synergy between photovoltaics and electric vehicles is explored, determining the minimum penetration levels that allow fulfilling the climate and energy targets. It is analyzed the extent to which photovoltaic energy can further transport electrification integration, and vice-versa. The technical impacts on the electricity system are determined quantitatively, as well as the required penetration of one technology that enables the deployment of the other.
Model results show that CO2 emissions targets can only be achieved with high levels of
photovoltaics and electric vehicles, reinforcing the need for day time charging infrastructures, presumably at or near work facilities. It is shown that a 100% renewable energy based electricity supply is possible for certain combinations of these technologies and that the environmental targets to reduce CO2 emissions can only be
reached with at least 40% of electric vehicles market share.
The present thesis contributes to the literature on integration of high levels of renewable energy sources on the electric grid and on interactions between renewable energy and electric vehicles deployment.
Keywords: Electric vehicles; Energy scenario; Solar photovoltaics; Energy system;
v
Publications list
This doctorate is sustained by the following original publications. The submitted manuscript of Article I and Articles II-IV are reproduced at the end of the thesis.
Publications on the basis of the thesis and included on it:
I. Pedro Nunes, Tiago Farias, Miguel C. Brito, “Enabling solar electricity with electric vehicles smart charging”, submitted to Energy journal (Jan. 2015).
II. Pedro Nunes, Tiago Farias, Miguel C. Brito, “Day charging electric vehicles
with excess solar electricity for a sustainable energy system”, Energy, 80, 263– 274 (2015). doi:10.1016/j.energy.2014.11.069
Other authored or co-authored publications during the doctorate included in the thesis:
III. Miguel C. Brito, Killian Lobato, Pedro Nunes, Filipe Serra, “Sustainable energy systems in an imaginary island”, Renewable and Sustainable Energy Reviews, 37, 229–242 (2014). doi:10.1016/j.rser.2014.05.008
IV. Pedro Nunes, Maria Lerer, G. Carrilho da Graça, “Energy certification of
existing office buildings: Analysis of two case studies and qualitative reflection”, Sustainable Cities and Society, 9, 81–95 (2013). doi:10.1016/j.scs.2013.03.003
Other selected publications during the doctorate not included in the thesis:
V. Pedro Nunes, Tiago Farias, Miguel C. Brito, “Synergies between electric vehicles and solar electricity penetrations in Portugal”, EVS27 Conference Proceedings (2013). doi:10.1109/EVS.2013.6914942
VI. Pedro Nunes, Tiago Farias, Miguel C. Brito, “Photovoltaic and electric vehicle
large scale deployments: opportunities and complementarities”, EU PVSEC28 Proceedings (2013). doi:10.4229/28thEUPVSEC2013-6CV.5.42
vi
VII. Pedro Nunes, Maria Lerer, G. Carrilho da Graça, “Building Energy Certification
System: Application to a Building in Lisbon and Paths to a Future Enhanced Scheme”, Energy Engineering, 110 (4), 37–41 (2013). doi:10.1080/ 01998595.2013.10707933
VIII. Pedro Nunes, Maria Lerer, G. Carrilho da Graça, “Building Energy Certification System: Application to a Building in Lisbon and Paths to a Future Enhanced Scheme”, International Conference for Enhanced Building Operations (ICEBO) 2011 Proceedings. ESL-IC-11-10-52
vii
Table of contents
Resumo ... i
Abstract ... iii
Publications list ... v
List of abbreviations and nomenclature... xvii
1. Introduction ... 1
1.1. Research questions and purpose ... 5
1.2. Contents outline ... 6
2. Background and state of the art ... 9
2.1. Introduction ... 9
2.1.1. Solar photovoltaics ... 9
2.1.2. Electric vehicles ... 12
2.1.2.1. Smart charging ... 19
2.2. Relevant studies ... 29
2.2.1. Modelling high RES penetration in the electrical system ... 32
2.2.2. Modelling interactions between the RES and EV ... 36
2.2.3. Summary ... 46
3. Methodology ... 49
3.1. The EnergyPLAN software ... 50
3.1.1. Model functioning ... 52
3.1.1.1. General aspects ... 53
3.1.1.2. Smart charging ... 58
3.2. General approach ... 59
3.3. Model calibration ... 62
3.3.1. The Portuguese electric-power system in 2011 ... 63
3.3.2. 2011 Simulation ... 68 3.4. 2050 Scenarios ... 71 3.4.1. Scenarios modelling ... 71 3.4.2. Electricity system ... 73 3.4.2.1. Solar PV scenarios ... 73 3.4.2.2. Common assumptions ... 74 3.4.2.2.1. System flexibility ... 79
3.4.2.3. System stabilization share ... 80
viii
3.4.3. Mobility ... 84
3.4.3.1. EV market uptake ... 84
3.4.3.2. Common assumptions ... 88
3.4.3.3. Summary ... 89
3.4.4. PV and vehicle scenarios combined ... 89
3.5. Day and night charging ... 91
3.6. Smart charging ... 93 3.6.1. General assumptions ... 93 3.6.2. Ancillary services ... 95 3.6.3. Driving patterns ... 96 3.6.4. Battery draining ... 99 3.6.5. V2G connection ... 100 4. Results ... 103
4.1. Day and night charging ... 105
4.1.1. General insights ... 105
4.1.2. Day charging vs. night charging ... 107
4.1.3. Impacts of different EV market shares ... 109
4.1.3.1. CEEP ... 109
4.1.3.2. CO2 reductions ... 111
4.1.4. Impacts of different solar PV deployments ... 112
4.1.4.1. PV share ... 112
4.1.4.1. CEEP ... 114
4.1.4.2. CO2 reductions ... 115
4.1.5. Arrangements between PV and EV scenarios ... 117
4.1.6. Sensitivity analysis ... 121
4.2. Smart charging ... 123
4.2.1. General insights ... 123
4.2.2. V2G charging profile ... 126
4.2.3. Impacts of different EV market shares ... 127
4.2.3.1. CEEP ... 127
4.2.3.2. CO2 reductions ... 129
4.2.4. Impacts of different solar PV deployments ... 130
4.2.4.1. PV share ... 130
4.2.4.2. CEEP ... 132
ix
4.2.5. Grid stabilization of V2G ... 135
4.2.6. Arrangements between PV and EV scenarios ... 136
5. Closure ... 141
5.1. Conclusions ... 141
5.2. Limitations and future work ... 144
References ... 147
Article I ... 163
Article II ... 197
Article III ... 211
xi
List of figures
Figure 1. Outline of a typical parallel HEV ... 13
Figure 2. Outline of a typical series PHEV ... 14
Figure 3. Outline of a typical PEV ... 15
Figure 4. Smart grid scheme with V2G functionality operating under the VPP approach ... 21
Figure 5. RES and EVs integration into the smart grid with V2G capability ... 23
Figure 6. EnergyPLAN procedure analysis ... 54
Figure 7. Model approach ... 60
Figure 8. 2011 electricity shares ... 63
Figure 9. Registered 2011 weekly energy production and demand ... 64
Figure 10. Inter-seasonal average load along 2011 ... 65
Figure 11. 2011 normalized load duration curve ... 66
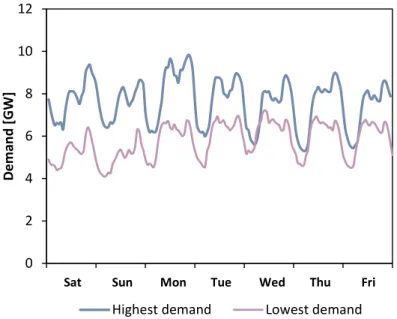
Figure 12. Demand for the two weeks of the year with highest and lowest consumption ... 67
Figure 13. Averaged daily load patterns along the year ... 67
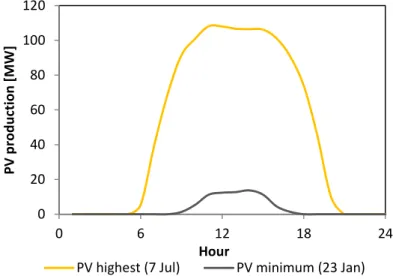
Figure 14. PV maximum and minimum productions for the entire year ... 68
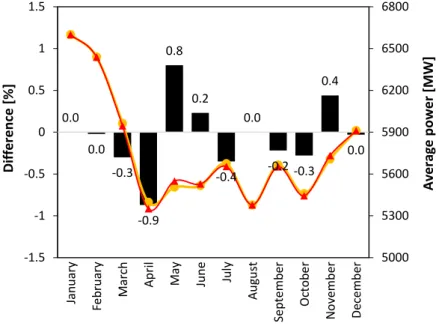
Figure 15. Monthly basis real and simulated average power demand for 2011 ... 70
Figure 16. Development of technology penetration ... 72
Figure 17. Scenarios of evolution of the PV installed capacity ... 74
Figure 18. Modeled evolution of the total installed capacity of natural gas fired based power plants ... 75
Figure 19. Modeled biomass, waste and biogas based fired capacity evolution until 2050 ... 76
Figure 20. Evolution of onshore wind installed capacity ... 77
Figure 21. Evolution of electricity demand ... 78
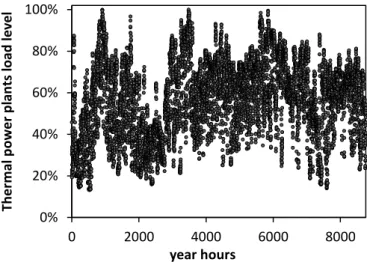
Figure 22. Load level of the thermal power plants aggregate relative to their annual peak production ... 80
Figure 23. Load level of the grid stabilization capable power plants aggregate relative to total production ... 81
Figure 24. Evolution of the electric power capacity installed (PV Central scenario) .... 83
Figure 25. Modeled passenger cars density evolution until 2050 ... 85
Figure 26. Population projections and modeled passenger car stock evolutions until 2050 ... 86
xii
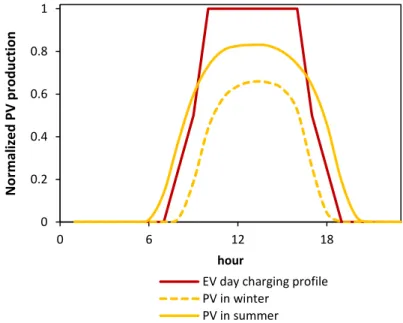
Figure 27. Sales and total car stock evolution until 2050 for the different EV scenarios ... 87 Figure 28. EV normalized night and day charging profiles ... 91 Figure 29. Normalized daily average PV production for summer and winter and
normalized EV day charging profile ... 92 Figure 30. Probability distribution used to define the EV daily journeys during
weekdays ... 98 Figure 31. Probability distribution used to define the EV daily journeys during the weekends ... 98 Figure 32. Weekly EV battery-to-wheel demand for the EV Central scenario ... 100 Figure 33. Weekly V2G connection available for the Central EV scenario... 101 Figure 34. Simulated 2050 hourly load diagram for the C0 scenario in a selected 7-day period in mid of April ... 106 Figure 35. Simulated 2050 hourly load diagram for the CC scenario for the same 7-day period of Figure 34 (day charging) ... 106 Figure 36. Simulated 2050 weekly energy production and consumption for the CC scenario (day charging) ... 107 Figure 37. CEEP given in share of total production and CO2 emissions as function of
PV installed capacity and EV charging profiles for the Central EV scenario ... 109 Figure 38. Daily average power demand and production profiles for the whole year for different EV scenarios combined with the Central PV scenario (day charging) ... 110 Figure 39. Unusable energy production as functions of the EV market share for the three PV scenarios (day charging) ... 111 Figure 40. CO2 reductions as function of EV market share for the three PV scenarios
(day charging) ... 112 Figure 41. PV share and PV in excess in the power system varying with the PV installed capacity for the Central EV scenario (day charging) ... 113 Figure 42. PV share in the system as function of CEEP (day charging) ... 114 Figure 43. Total CEEP in the system as function of the installed PV capacity (day charging) ... 115 Figure 44. CO2 reductions as functions of the PV penetration (day charging) ... 116
Figure 45. CO2 reductions rate as function of the PV penetration (day charging) ... 117
Figure 46. Arrangements between EV market share and PV capacity that lead to 80% reductions in CO2 (day charging) ... 118
Figure 47. Scenarios ordered by its merit concerning fossil fuel consumption (natural gas, diesel and gasoline) and reductions in CO2 emissions (day charging) ... 119
Figure 48. Unusable energy as function of deviations in the PV and wind installed capacities in the CC scenario ... 121
xiii
Figure 49. CO2 emissions as function of deviations in the PV and wind installed
capacities in the CC scenario ... 122 Figure 50. Simulated 2050 hourly load diagram for the CC scenario in a selected 7-day period in mid-April (smart charging) ... 124 Figure 51. Weekly energy production and consumption for the CC scenario (smart charging) ... 125 Figure 52. Normalized annual daily average profiles in the CC scenario of EV charge, PV generation and total non dispatchable generation ... 126 Figure 53. Daily average power demand and production profiles for the whole year for different EV scenarios combined with the High PV scenario (smart charging) ... 128 Figure 54. Relative CEEP as function of EV market share for the different PV scenarios (smart charging) ... 129 Figure 55. CO2 reductions attained in the PV scenarios as function of EV market share
(smart charging) ... 130 Figure 56. PV share and PV in excess in the power system varying with the PV installed capacity for the Central EV scenario (smart charging) ... 131 Figure 57. PV share in the system as function of CEEP (smart charging) ... 132 Figure 58. Total CEEP in the system as function of the installed PV capacity (smart charging) ... 133 Figure 59. CO2 reductions as functions of PV penetration (smart charging) ... 134
Figure 60. CO2 reductions rate as function of the PV penetration (smart charging) .... 135
Figure 61. V2G stabilization services provision along the year in the CC scenario .... 136 Figure 62. Arrangements between EV market share and PV capacity that leads to 80% reductions in CO2 and to 0-0.01 TWh/year of CEEP (~0% CEEP) ... 138
Figure 63. Scenarios ordered by its merit concerning fossil fuel consumption (natural gas, diesel and gasoline) and reductions in CO2 emissions (smart charging) ... 139
xv
List of tables
Table 1. Electric vehicles penetration targets according to country ... 18 Table 2. Overview of the literature according to subjects ... 47 Table 3. Input and operation of the EnergyPLAN components ... 57 Table 4. Model calibration results ... 69 Table 5. Capacity installed and yearly energy productions for the different PV scenarios considered in this study ... 74 Table 6. Modeled installed capacities in 2011 and 2050 ... 83 Table 7. Total capacity installed in 2050 according to the type of generation ... 84 Table 8. Modeled power plants efficiencies and grid flexibility and stabilizations levels ... 84 Table 9. Common assumptions to all EV scenarios ... 89 Table 10. Fleet and demand characterization of the different EV scenarios ... 90 Table 11. Arrangements between PV and EV scenarios ... 90 Table 12. Battery storage overall size and power capacity of grid to battery connection ... 94 Table 13. Assumptions made in the V2G model ... 95 Table 14. Average unusable power for the different mobility scenarios (day charging) ... 110 Table 15. RES share in the electricity mix, RES share in the primary energy supply, CO2 reductions, CEEP, PV share in the electricity mix and PV energy used for the
scenarios arrangements (day charging) ... 120 Table 16. Correlations factors between the profiles shown in Figure 52 ... 127 Table 17. Average unusable power for different mobility scenarios (smart charging) 128 Table 18. RES share in the electricity mix, RES share in the primary energy supply, CO2 reductions, CEEP, PV share in the electricity mix and PV energy used for the
xvii
List of abbreviations and nomenclature
AC Alternating Current
CCGT Combined Cycle Gas Turbines
Ccharging Maximum charging power of the entire V2G fleet
CEEP Critical Excess of Electricity Production CV2G V2G connection capacity
(V2G)i Transport demand at hour i
dflex Flexibility factor
DSM Demand Side Management DSO Distribution System Operator
dstab Minimum grid stabilization demand
Dtotal Total electricity demand
DV2G Annual transport demand
EEP Excess of Electricity Production
Esource Energy produced by the source in question
estab Electricity production from regulation capable sources
eth Total electricity production from sources with flexibility constraints
Etotal Total electricity produced on the system
EU European Union
EV Electric Vehicle GHG Greenhouse Gases
charge Charging efficiency
HEV Hybrid Electric Vehicle ICE Internal Combustion Engine IEA International Energy Agency
INE Instituto Nacional de Estatística (the national statistical office)
M Million
MIBEL Mercado Ibérico de Electricidade NEP Annual number of hours at full power
xviii
OECD Organization for Economic Co-operation and Development PES Primary Energy Supply
PEV Pure Electric Vehicle
PHEV Plug-in Hybrid Electric Vehicles
PP Power Plant
PV Photovoltaics
RES Renewable Energy Sources
SO System Operator
SOC State Of Charge
T&D Transmission and Distribution Toe Ton of oil equivalent
TSO Transmission System Operator
UK United Kingdom
US United States
USD United States Dollar V2G Vehicle-to-grid VPP Virtual Power Plant
Chapter 1 - Introduction
1
1. Introduction
On the context of the need of developed countries to drastically reduce world greenhouse gases (GHG) emissions, with the goal of limiting climate change below 2ºC1 [1], the European Union (EU) envisages a low carbon footprint society for the
future. Ambitious environmental targets have been established, such as those from the Energy 2020 strategy [2] and the longer term goals from the Energy Roadmap 2050 [3], in which it is proposed reducing overall GHG emissions by 80-95%, compared to 1990 levels. More recently, an intermediate binding milestone of at least 40% reduction in GHG emissions by 2030 was adopted [4].
The energy sector is responsible for the biggest share, approximately 30%, of GHG emissions in the EU [5] and transport is right after, responsible for around a quarter, with the road transport alone answering for a fifth of total emissions [6]. Consequently, such reduction target can only be achieved by the intensive use of renewable energy sources (RES) and major alterations to the transport sector, still a growing source of GHG emissions with a substantial 36% increase over the past two decades, putting it presently 8% above the 1990 level [6]. The Roadmap 2050 shows that the targeted GHG emissions reduction will have to be met largely domestically within the EU and, thus, within each member state [3].
Chapter 1 - Introduction
2
Electricity will play a major role in the decarbonisation of society, given its increasingly importance as an energy vector in modern societies [7], [8] and its potential cleanliness when produced using RES.
In particular, solar electricity generated from photovoltaic (PV) technology appears to be in the future the most attractive form of decarbonized electricity generation, due to its ample resource available [9], noiseless nature, scale flexibility, simple operation and maintenance [10], [11] and price competitiveness trajectory [9], [12], [13]. Hence, solar PV is projected to be the dominant source of electricity in a global warming limiting scenario [14].
This is particularly true for Portugal, with one of the highest insolation levels among Europe [15] and, at the same time, very dependable on external energy supply, with imports accounting for about 80% of internal energy demand in 2011 (mostly oil, coal and natural gas) [16]. With other RES installed capacity or planed installed capacity almost tapped, namely hydro and onshore wind, and not having bet on nuclear power, PV in Portugal is the most promising source of clean, abundant and free of concerns of security of supply2 energy.
Nevertheless, Portugal just started to explore its solar potential, having only 282 MW of solar PV installed [17]3. The reasons have to do with a low price competitiveness of the solar PV energy when compared to other electricity sources, but this is changing. Since 2008 solar system prices have decreased by two thirds in most markets [18] and grid parity4 has already been partially reached in Spain, Germany and Italy [19] and it is
expected that the same happens gradually in the rest of the European countries [20].
2 Given the universally deployable and distributed nature of solar PV energy.
3 As a comparison, Germany had 35.7 GW of PV installed at the end of 2013. With a resource
of 1200 kWh/m2/year [197], it has 438 W/person of solar PV installed [198] and Portugal, with
a resource of 1900 kWh/m2/year [197], has 28.2 W/person [17].
4 Competitiveness is assessed by grid parity: PV will reach it when the electricity produced by a
Chapter 1 - Introduction
3
Comparing to the present, by 2050 the cost of solar technology is estimated to have lowered 65% [18].
On the other hand, in the context of the EU environmental targets, in particular the intention to reduce transport-related emissions of CO2 by at least 60% by 20505, electric
vehicles6 (EVs) are a key technology. The EVs are potentially much cleaner than internal combustion engine (ICE) models, because the carbon footprint of EV driving is directly related to the electricity used to charge the batteries, which, on the limit, can be 100% carbon free. Portugal is well positioned to adopt this technology, given its governmental plan of electric mobility, with the deployment of a public recharging infrastructure with 1300 normal charging stations (3.7 kW) and 50 fast charging stations (50 kW) [21], and a green taxation system promoting the adoption of EVs [22].
For these reasons, PV and EVs are expected to have mass adoption in the coming decades across the globe [12], [14], [23]–[25], leading to well-known and relevant impacts on the national energy systems, e.g. possible mismatch between production and consumption of solar electricity and higher electricity demand for EV mobility. Abundant non-dispatchable renewable energy, whose output is conditioned by meteorology and therefore variable, is difficult to articulate with existing base load power generation capacities, that possess limited flexibility and ramp rates (i.e., limited ability to balance rapid changes in renewable generation and demand by adjusting their output) and high minimum output levels7, leading to an endogenous electricity
production superavit, which may have to be curtailed or, when similar amounts of
5 Compared to 1990 levels.
6 In this study, when EV is referred it means electric vehicles in general, comprehending pure
electric vehicles, i.e., vehicles propelled solely by electricity, with no internal combustion engine used for propulsion, and plug-in hybrid electric vehicles. These technologies are discussed in Section 2.1.2.
7 Moreover, sufficient load following capable generating power has to be available ahead of
periods with high load and low non dispatchable renewables output, reducing the overall system efficiency and increasing the energy cost [26].
Chapter 1 - Introduction
4
variable generation are installed in surrounding markets, exported at low prices8 [26]. There are thus critical challenges to integrate large-scale PV in the electricity grid, limiting ultimately its contribution to the electricity sector if the deployment is done without articulation with other technologies and careful planning [27], [28]9.
Hence, the installation of storage devices to absorb this energy is highly beneficial [29]. The EVs, with their large battery capacity10, if seen as a whole, acting as distributed
controllable loads and storage [30], may be an answer to avoid increasing worldwide excess of energy [31]–[33]. Indeed, the most significant impact on the electricity system of EVs is their ability to assist the integration of renewable energy into existing power grids [34]. That is, their benefits lie outside the transport sector, since the vehicles storage capacity can serve the upstream electric grid [30]. Additionally, storing energy on EVs batteries should be cheaper than using dedicated grid-scale energy storage technologies, since the cost involved is just the marginal cost of using the batteries because they have been paid for its other purpose: the electric vehicle.
For the particular case of a PV-EV based energy system, there are also other relevant benefits to the transport sector. For example, mid-day solar charging has the potential to increase the daily driving range for commuters’ vehicles, important for diminishing driver’s range anxiety, a phenomenon seen as a barrier to the EV market uptake [35]. For the particular case of plug-in hybrid EVs (this technology is addressed in Section
8 It can be exemplified by peak wind generation hours, usually overnight, which do not match
the peak load periods that happen during the day, hence leading to negative electricity prices in energy markets. Another example is on sunny days, when PV combined with wind pushes down mid-day demand for fossil fuels power, again leading to negative energy prices, in particular at weekends, when demand is lowest, something which has been anticipated [27], [28] and has already happened [199], [200].
9 Recently, a non-binding target of interconnection reinforcement between Iberia and France
until 2030 [4] has been settled, which may facilitate PV deployment, but it is not a PV enabler per se, rather than one measure among several others that contribute to integrate fluctuating RES [117].
Chapter 1 - Introduction
5
2.1.2), this would increase the fraction of miles driven electrically, hence decreasing traveling on ICE mode and petroleum use [36], contributing to the accomplishment of environmental goals.
However, the effects of uncontrolled EV charging are negative, with consequences both at the distribution and generation levels, particularly if the additional electricity demand occurs during peak hours. It is usually assumed that small scale EV introduction (up to 5% of a national fleet) will not pose a significant threat to advanced distribution grids [37], but beyond that the effects may be significant.
1.1. Research questions and purpose
In spite of the scientific and societal relevance of the interactions between PV and EV, in the literature there seems to be a lack of depth of analysis on it, as it has been recently highlighted in [34] and as discussed in detail in Section 2.2, particularly within the scope of the EU environmental goals. Thus, the following research questions, addressed in this thesis, emerge:
1. What are the synergies between PV and EV?
2. How can PV and EV be articulated to better explore their synergies? 3. What is the best EV charging strategy?
4. What levels of PV and EV, individually and separated, are needed to comply with the EU energy-climate targets?
Therefore, the purpose and object of this thesis is to explore the synergies and conflicts between the large penetration of PV and the widespread deployment of EVs in future sustainable energy systems, using energy scenarios for Portugal in 2050 as case study. The analysis considers the effect of different EV charging strategies, including smart charging.
The extent to which PV energy can further transport electrification integration, and vice-versa, is analyzed, providing an overview of the possible impacts of the
Chapter 1 - Introduction
6
introduction of PV in articulation with EVs. The technical impacts on the electricity system are determined quantitatively, as well as the required penetration of one technology which enables the deployment of the other, combining and simulating several alternative scenarios representing combinations between both technologies. This research concerns Portugal, but qualitatively the conclusions may well be generalized to other similar contexts. It contributes to the literature on integration of high levels of renewable energy sources on the electric grid and on the interactions between renewable energy and electric vehicles deployment.
1.2. Contents outline
This thesis comprises five chapters and four articles, referred to in the text as Articles I– IV. See the list of publications for complete references.
Chapter 1 provides an introduction to the European and Portuguese context and, within
it, to the positive and negative effects on the electricity grid of mass deployments of photovoltaics and electric vehicles, individually and combined. It also explains the purpose of this thesis and the research questions addressed.
Chapter 2 provides the necessary background on the topic before proceeding,
explaining the main concepts. It includes a state of the art overview with a summary of the most important works existing in the literature.
Chapter 3 contains a detailed explanation of the methodology used to conduct the
work. It is composed of a presentation of the energy tool used and of descriptions of the general approach, the model calibration, the scenarios modelling process and the charging strategies tested.
Chapter 4 presents and discusses the results of the simulations, divided according to
the charging strategy.
Chapter 5 provides a wrap up, with the main conclusions, limitations and suggestions
Chapter 1 - Introduction
7
Article I, “Enabling solar electricity with electric vehicles smart charging”, has been
submitted to Energy journal, being currently under review. It explores the synergy between PV and EV technologies, determining the minimum penetration levels that allow fulfilling the climate and energy targets based on an EV smart charging strategy.
Article II, “Day charging electric vehicles with excess solar electricity for a sustainable
energy system”, has been published in Energy journal, vol. 80, pages 263-274 (2015). It explores the possible complementarities between wind and solar power and electric vehicles charging using a day and night EV charging profiles.
Article III, “Sustainable energy systems in an imaginary island”, has been published in
Renewable and Sustainable Energy Reviews journal, vol. 37, pages 229-242 (2014). It presents an overview of the state of the art sustainable energy systems methodologies for isolated systems and describes the complete analysis of the energy system of a fictional case study, including electricity supply and demand, heating and mobility. It details the methodology used to build a 100% renewable energy system from scratch. This methodology requires reviewing the different renewable energy technologies, energy demand conditioning tools and energy storage alternatives, which are extensively discussed. It shows from first principles how to integrate and coordinate electric vehicles in a renewable energy based system. It is a work developed for an Energy Systems module lectured at the University of Lisbon on the context of the MIT Portugal Sustainable Energy Systems doctoral program.
Article IV, “Energy certification of existing office buildings: Analysis of two case
studies and qualitative reflection”, has been published on Sustainable Cities and Society journal, vol. 9, pages 81-95 (2013). It presents the application of the Portuguese building energy certification system to two large office buildings in Lisbon, and a cost– benefit analysis of different energy optimization scenarios based on calibrated building thermal simulation models. The results are used to examine the principles and energy indicators of the Portuguese energy certification scheme, resulting in a qualitative reflection about its limitations and opportunities for improvement. It was published following the line of research that first was embraced in the doctorate, before a divergence to the topic of the present thesis.
Chapter 2 - Background and state of the art
9
2. Background and state of the art
To have a proper understanding about the research issue addressed in this work, it is essential to know the background and to have an insight on previously existing reference literature. This background along with a summary of the most important works in this field, which served as backbone to outline, design and perform this study, are presented in this chapter.
2.1. Introduction
2.1.1. Solar photovoltaics
The sun is an inexhaustible resource worldwide, constantly delivering to the Earth’s upper atmosphere 1366 W/m2, the solar constant, which is reduced to 1000 W/m2 by atmospheric scattering and absorption and to 125-305 W/m2, or 3-7 kWh/m2/day, by latitude, seasonal and diurnal variations [42]. The planet has an average PV generation potential of 3.6 × 10⁴ TW, compared to an average demand of 17 TW [38]. In Portugal, the annual value of average irradiance is of 250 W/m2, which, considering
Chapter 2 - Background and state of the art
10
weather factors, such as cloud cover, diminishes to 210 W/m2, or 5 kWh/m2/day – still around 650 fold more than the country’s total primary energy consumption.
However, the solar resource is inherently variable, posing a challenge for satisfying constant human energy needs with solar power. There are two types of variability: (1) deterministic variability, which is the result of diurnal and seasonal variation as well as local climate, thus predictable; (2) stochastic variability, which is the result of cloud cover and weather. It is predictable just to a certain degree.
The variability is managed according to time and length scale: local, short-term variations are smoothed by geographical averaging, i.e., power distribution over geographical areas larger than clouds and weather systems, or by demand management. Larger or longer-term variation requires grid-scale energy storage or deployment of dispatchable complementary energy sources [39].
In spite of this variability, it is consensual that solar PV is the most promising form of sustainable electricity generation in the future [10]–[12], [40], [41]. The conversion of sunlight into electricity is done without the help of machines or any moving parts, providing PV systems with long lifetime (>25 years) and minimum maintenance cost. The systems are simple to design and their stand-alone installation can provide outputs from W to MW, making the technology suitable to both distributed and centralized production. Unlike thermal generators or wind turbines, which lose efficiency with reduced scale, small PV arrays are no less efficient than the large ones [39]. Photovoltaic cells absorb photons and produce free electrons through the PV effect, generating electricity. Multiple PV cells form a PV module and multiple PV modules connected in series or in parallel form a PV system. The present average commercial module efficiency is 14.5%, expected to grow to 20.5% by 2020 [41].
Today there are mainly two types of technologies involved in solar PV, crystalline and thin semiconducting films. Crystalline solar cells represent about 90% of the world market, divided between mono-crystalline (35%) and multi-crystalline (55%) [39], with China and Taiwan as the largest cell and module producers. In the future, thin film type multi-junction devices, operating in a wide range of the solar irradiation spectrum and suitable for large-scale production, may increase their market share [38]. The same for
Chapter 2 - Background and state of the art
11
other emerging PV technologies, based also on thin film cells (organic, polymeric, etc.), due to their potential for very low cost and acceptable efficiencies. For a complete insight on PV cells and modules technology, see [39].
The PV industry is rapidly developing, and is the fastest industry growing worldwide [38]. The global PV cumulative installed capacity has been growing exponentially in the recent years: it was 2.6 GW in 2003, 15.8 GW in 2008 and 138.9 GW in 2013, i.e., a fifty-fold growth in ten years and a nine-fold growth in the last five years [42]. In spite of that, in 2013 it produced 160 TWh, only 0.5% of the global electricity demand [38]. It is projected that will rise to 16% in 2050 [18]. In Europe, with the largest share of PV installed in the world (55%), PV in 2013 covered 3% of the electricity demand. In a business as usual scenario, it is projected to grow to between 7% and 11% by 2030 [42]. The price of the kWh produced from PV is steadily declining, putting it on a competitiveness trajectory. This is due to: (1) the PV module production costs have been decreasing, from 10 EUR/Wp in 1990 to less than 0.8 EUR/Wp in 2013 [43]; (2)
innovation in materials technology; (3) increase in the PV module production, leading to economies of scale; (4) improvements in cell efficiency; (5) PV systems longer lifespan; (6) favorable public policies for renewable energy [41].
However, large scale deployment of PV requires support by public policies to promote carbon emissions reduction and technological innovation. The main support mechanisms to finance renewable energy development are described in [8], where the authors compare feed-in-tariffs, tax incentives and tradable green certificate as support mechanisms to finance RES development programs. The energy policies to promote PV deployment are reviewed in [44] and in [10] and, more recently, in [45], which also gives an updated perspective on the solar PV energy developments. For a discussion on how high PV quotas will affect electricity markets, see [13]. For a complete discussion on global prospects, progress, policies and environmental impact of solar PV power generation, see [38].
Chapter 2 - Background and state of the art
12
2.1.2. Electric vehicles
There are three main types of EVs: hybrid electric vehicles (HEVs), plug-in hybrid electric vehicles (PHEVs) and pure electric vehicles (PEVs). Among other differences addressed below, in the HEVs the battery is not externally rechargeable while in the PHEVs and PEVs it is.
The HEV combines two distinct power sources in order to provide driving power, a conventional internal combustion engine (ICE) and an electric motor coupled with a battery, as Figure 1 shows. Typically, the low efficiency ICE is used in combination with a much higher efficient electric system, achieving better fuel economy and better performance than a conventional ICE. It has a hybridization ratio defined as the division between the maximum power of the electric motor and the maximum power of the power train. Full HEVs are able to drive in conventional vehicle transmission mode by utilizing the ICE or in electric power mode or both. The HEVs have an electric motor/generator system which operating as a generator produces electricity, through the ICE or regenerative braking, to charge the battery; when used as a motor, propels the vehicle [46]. As stated, the HEV does not have a plug-in connection to the electricity network.
Chapter 2 - Background and state of the art
13
Figure 1. Outline of a typical parallel HEV. Adapted from [47]
The PHEVs, introduced in the market later than the HEVs, are similar to the latter to the extent that both have an ICE and an electrical drive-train. By definition, PHEVs are HEVs that have a battery of at least 4 kWh, a means of recharging it from an external source and the ability to drive 16 km or more in pure electric mode [48]11. They can run
on gasoline/diesel or on electricity or on a combination of both. They are more efficient than HEVs since a more limited use of the ICE increases the overall vehicle efficiency, allowing at the same time the ICE to be used closer to its peak efficiency by operating only at high speeds – which leads to several advantages such as reduced dependence on oil, increased fuel economy, increased power efficiency, lower GHG emissions and the ability to be smart charged12 [46], [49].
11 Today’s maximum driving range for PHEVs in pure electric mode is 20-60 km [46]. 12 Smart charging is addressed in Section 2.1.2.1.
Chapter 2 - Background and state of the art
14
These vehicles have a battery pack that can be completely charged by plugging the vehicle into a standard European electrical outlet of 230 V AC. In addition, as with HEV, regenerative braking also provides an on-vehicle battery charging alternative. When charged from the power grid, over a well-to-wheels life cycle PHEVs may emit less CO2 and other pollutants than ICE vehicles and HEVs [50], provided that the grid
electricity is cleaner than gasoline or diesel [36]. This electricity may come from any energy sources, including RES with zero-emissions, in this case turning PHEVs GHG emissions close to zero [51].
There are three designs of PHEVs: series, parallel and combo. In the series design the wheels are propelled just by the electric motor, as Figure 2 shows, fueled by electricity from a generator turned by the ICE [49]. The battery stores any charge produced in excess by the ICE. In the parallel design, similar to the HEV design of Figure 1, both the ICE and the electric motor can propel the wheels, independently or simultaneously through mechanical coupling. The combo design allows the vehicle to operate in either series or parallel mode [46].
Chapter 2 - Background and state of the art
15
Pure electric vehicles are propelled only by an electric motor (Figure 3). Part of the electricity used is generated onboard through regenerative braking, but most of it comes from the power grid, since the battery can be charged using a standard electrical outlet or at charging stations. It means that, compared to ICE vehicles, PEVs provide a significant decrease of GHG emissions if charged from green electricity. Comparing to PHEVs, the reductions are also potentially much higher [46], [53]. Pure electric vehicles also have some advantages in performance compared to ICE vehicles, such as higher torque at low speeds without the need of transmission or clutch system.
All major vehicle manufacturers have, or plan to have, PEVs on the market [54]. The more recent models use state-of-the-art Li-ion type batteries13, having improved
performance compared to NiMH vehicles or older Li-ion technology. The drive range of PEVs is 120–390 km, with a typical top speed of 200 km/h [46].
Figure 3. Outline of a typical PEV [55]
Since PEVs do not have an ICE, their battery is operated across the whole range of speeds, increasing its demand. Additionally, to minimize driver range anxiety, the battery capacity needs to be high enough to guarantee at least a driving range sufficient
13 The great advantages of Li-ion batteries compared to other technologies are longer lifespan
and higher energy and power densities. Nonetheless, Li-ion batteries research and development needs to be carried further to match enough energy and power densities for EVs. For a review on the potential of this technology, see [186].
Chapter 2 - Background and state of the art
16
to cover a daily routine driving [56]14. These requisites imply the need for high-power and high-energy batteries15 able to withstand high charging and discharging currents,
being at the same time light enough, which is a costly technology. This is the most significant factor contributing to the high cost of PEVs today, representing the central barrier to their market uptake [46], [57].
Presently, battery charging is done mostly using conventional household outlets. A 230 V outlet with a 16 A fuse allows a present day PEV such as the Nissan Leaf, with a battery of 24 kWh, to fully recharge in 6-7 h. It is a long period, a factor that together with the need for vehicle charging outside has resulted in the project and/or implementation of public charging stations, such as [21], some offering high-speed charging mode with much reduced charging times. A mass provision of charging points, strategically located, is essential to facilitate the EVs penetration and their establishment as a competitive alternative to conventional vehicles [46].
The existing power grid has its electricity generation capacity mostly sitting idle as operating reserve during off-peak demand hours, and during RES generation peak-hours power production may be higher than the power demand. By articulating EV charging with these periods, the EVs may allow for a more efficient use of the installed capacity, leading to both improved operating efficiencies and use of generating units. However,
14 In [56] a fleet of 484 gasoline vehicles was monitored in the United States to infer the
potential market share for EVs with limited-range, assuming that EV drivers have the same driving patterns and that they charge their vehicles once a day. The authors found that 9% and 21% of the vehicles never exceeded 160 km and 240 km in one day, respectively. It means that these drivers could substitute their current ICE vehicles with EVs existing now on the market without any adaptation in their driving. If drivers are willing to make adaptations on two days per year, the 160 km EV range would meet the needs of 17% of drivers, and if they are willing to adapt six times per year it would serve 32% of drivers. The authors conclude that even EVs with today’s limited battery range, if marketed to segments with appropriate driving behavior, comprise a large enough market for substantial EV market sales uptake.
15 As a disadvantage, an increased battery energy density increases largely the charging time
Chapter 2 - Background and state of the art
17
EV charging pose some concerns about possible negative impacts on the power grid. The major issues identified during EV charging are increased transformer loading, thermal loading of conductors, unbalance of network, reductions in voltage levels, power losses and harmonic distortion [46], [58].
The EV charging most concern is about exceeding grid power and grid infrastructure capacities. In case of a large load of uncontrolled EV charging, e.g. a large quantity of EVs charging at the same time, there is a substantial increase in power demand, which can be higher than the available local transformer power supply, causing transformer overload, or higher than the current capability of the transmission and distribution grid infrastructures, causing thermal loading of conductors. When vehicle charging takes place during peak periods or in the case of fast charging, the issue is aggravated. As an example, presently in the United Kingdom (UK) the high voltage transmission network can manage the demand of about one million of EVs, but not above that, according to [46].
Even though unregulated EV charging tends to be random, decreasing the risk of transformer overloads, it may cause imbalance on distribution networks, especially when charging is through single phase electric outlets, resulting in increased voltage drops and power losses. These impacts need to be quantified to preserve the reliability of the grid. Increased power harmonics related to EV charging can pose an additional impact on distribution grid transformers, widely diverse in across different parts of the power grid. Thus, future distribution network planning needs to assess EV market uptake scenarios and adapt the local grids accordingly [46]. This issue will be discussed in further detail in Section 2.2.
Future market penetration of EVs has been targeted more or less ambitiously by national governments and other entities. For Portugal, in 2011 it has been established by the government an over ambitious market share of 10% by 2020 [59]. For other countries targets, see Table 1. However, EVs are at the moment noncompetitive with conventional vehicle technology [60], since costs are still high and battery technology is still under developing. To foster EV penetration, a set of policies is essential. In [61] the authors identified ten concrete measures to support the adoption of electric vehicles in the urban environment and classified them according to their effectiveness, efficiency
Chapter 2 - Background and state of the art
18
and feasibility. According to this classification, the most urgent measure is the adoption at European level of a standard charging plug. In [62] the EVs challenges and opportunities are addressed in the context of Lithuania, where it was found that significant positive impact on the local EVs market can be created using policies such as tax reliefs or rebates, income tax relief for purchasing an EV and free of charge EV charging points.
Table 1. Electric vehicles penetration targets according to country [54]
Country
(EU) target
Country
(non EU) target
Germany 1M EVs on the
road by 2020 USA
62% market share by 2050
UK 350.000 EVs on
the road by 2020 Japan
50% in sales by 2020 Sweden 600.000 EVs on
the road by 2020 Canada
500.000 EVs on the road by 2018 France 2M EVs on the
road by 2020 New Zealand
60% market share by 2040
Belgium 30% market share
by 2030 China
5M EVs on the road by 2020 Ireland 40% market share
by 2030 South Korea
10% of small vehicles market by 2020
The notion that policies are essential to promote EV sales take-off is reinforced in [63] for China, in which the factors explaining the timid EV sales on that country are identified: (1) protectionism by regional governments; (2) uncertainty over what EV technology is to be promoted and what consumers are willing to pay; (3) lack of investments in charging infrastructure; (4) conservative investment behavior by automakers and battery manufacturers.
Besides policies, for an EV market uptake the technology has to have consumer acceptance. In [64] the authors measured the extent to which real experience of drivers with EVs may affect their preferences and attitudes towards it. The study included attributes regarding purchase price, driving costs, driving performance, environmental performance, driving range, charging possibilities and battery lifetime. The results
Chapter 2 - Background and state of the art
19
found that low driving range is a major concern related to EVs, not due to misconceptions but to a true mismatch between the range the drivers wish to have available in their everyday life and what the EVs provide. The results also show that top speeds below 120 km/h are not acceptable – it is not an obstacle for the EV adoption, since the majority of the commercialized EVs have top speeds above that. The possibility to charge at work, the number of charging points along travel roads and in the general public space are important attributes to increase the demand for EVs [64]. As detailed in [65], there are two main strategies for EV charging: (1) uncoordinated charging, in which the EVs start charging as they park, leading to potential critical impacts on the grid; (2) coordinated charging, in which charging is at a convenient time, such as during off-peak hours. It can be based on a simple set of rules, such as delayed charging (i.e., pre-programed charging), or it can be smart charging, i.e., an optimized charging under the command of an operator, based on price, load or regulation [66].
2.1.2.1. Smart charging
The EVs shift the energy source from petroleum to electricity – but their potential is beyond: the EV batteries makes them a form of controllable distributed energy storage. This is the concept of vehicle-to-grid (V2G). Since EVs are parked more than 90% of the time [36], [67], they offer the possibility for demand response in smart grids, namely load shifting. As a whole, they can be seen as a nation sized battery [68]: (1) they can charge when it is more convenient for the system operator, substituting large-scale energy storage systems (namely hydro-pumping); (2) they can provide ancillary services (explained below) to the power system, substituting dedicated units for that; (3) they can supply electricity to the grid (battery-to-grid), substituting traditional power generation16. Vehicle-to-grid implies: (1) a smart-grid type distribution infrastructure,
with a unidirectional or bidirectional connection to the grid; (2) a control device
16 The typical example of battery-to-grid is to supply electricity to the grid when it is
Chapter 2 - Background and state of the art
20
communicating with the system operator and following its signals; (3) an on-board meter device. It should be noted that in this study the V2G concept implies the provision of an EV service to the grid, such as load shifting or ancillary services, not implying necessarily electricity flow from the batteries to the grid.
The V2G concept was already addressed in 1997 by Kempton and Letendre [69], when the nomenclature and the acronym did not yet exist. The authors conceptualized the EVs fleet from an analytical perspective normally used by electric utilities, modelling EVs as a peak power resource. They concluded that, if a fraction of the United States’ (US) vehicle fleet becomes electrified, the electro-producer systems will be less concerned with real time match between generation and load. Therefore, the system would be more receptive to intermittent renewables, though the implications of the needed modifications on it are profound [69]. Since then, V2G was amply addressed in the literature, such as in [66], [67], [70]–[77].
The V2G concept depends on the smart grid, which, as defined by [78], is an electricity network that efficiently delivers sustainable, economic and secure electricity supplies integrating intelligently the actions of all users connected to it – generators, consumers and those that do both. It relies on a combination of hardware, management and reporting software built atop a communications infrastructure, constituting a great sophisticated and intricate network. This structure can be unidirectional or, to fully exploit the smart grid potentialities and enable the electric vehicle battery as an energy and power buffer of the grid, bidirectional. It gives to consumers, system operators and utilities tools to manage, monitor and respond to energy issues [72]. In Figure 4 it is shown schematically the smart grid scheme with V2G functionality operating under the virtual power plant17 (VPP) approach. The VPP control center dispatches the aggregated battery power whenever requested by the Distribution SO (DSO) and Transmission SO
17 Virtual power plant is defined as an aggregation of different type of distributed resources
which may be dispersed in different points of medium voltage distribution network. It can be used to make contracts in the wholesale market and to offer services to the system operator [202].
Chapter 2 - Background and state of the art
21
(TSO) and centralizes the energy and communication flow management between energy market players (i.e., producers and consumers) and the operators.
Power generation
Communication flow Unidirectional power flow Energy market TSO Charging Management System Aggregator/ local VPP Clustered EVs DSO EV status Power request VPP Control Center EV Management System Ancillary services Ancillary services DSM response Energy demand Power request/status
Figure 4. Smart grid scheme with V2G functionality operating under the VPP approach
(adapted from [57])
The smart grid technology is getting increasing attention from the academia, industry, public and private entities, since it can be an answer to safely integrate more RES, EVs and distributed generators into the electricity grid. It needs an advanced metering infrastructure, constituting a collection point, i.e., an interface between buyer and seller where data can be gathered and analyzed. These systems capture data, typically at the meter, to provide information to utilities and to consumers. The smart grid can shape the load curve and enables consumers to have greater control over their electricity
Chapter 2 - Background and state of the art
22
consumption and to actively participate in the electricity market. At this stage it is not yet a mature technology or widely deployed, existing only in pilot projects in Europe – in essence, the electrical grid today may be considered to be mostly dumb [79]. For an inventory on the smart grid research, development and demonstration projects in Europe, see [80].
One of these projects is the InovGrid [81] in Portugal, implemented by the local DSO. Its main purpose is to develop an advanced metering system and define a set of functionalities to provide the distribution grid with the necessary intelligence. It has a strong focus in the management of small distributed generation and control of the low voltage network, while providing to the customers the conditions to access innovative services. This project has an intrinsic extension, the REIVE project [82], with a purpose to develop an enhanced technical and market integration of small RES distributed generation and EVs. It is focused on the identification, specification and testing of solutions which allow that goal. The main outcomes of both InovGrid and REIVE projects are presented in [83].
Previous studies have found that, in addition to suppress power fluctuations from RES, advanced EV charging smart techniques can also mitigate and better control overloads on the distribution network [46]. Such techniques include stagger charging, i.e., controlled charging of batteries across household outlets to allow load balancing and prevent overloads, and household load control, i.e., postponement of non-essential loads to recharge EVs more rapidly [46]. Studies have additionally found that smart charging is advantageous in reducing technical issues concerning grid power quality [84]. Therefore, EV charging should be coordinated by operators and other multi-agent systems.
Figure 5 schematizes the integration into a power system of both EV and RES. It is assumed that all necessary communication and control schemes are available, as described previously and shown in Figure 4. The electric vehicles are considered aggregated at the charging stations located in public or office parking spaces [57].
Chapter 2 - Background and state of the art
23
TSO
DSO
CCGT Power Plant Biomass Power Plant
T2 T1
T3
T4
Wind farm Charging station Solar farm Residential house Bidirectional power flow Unidirectional power flow
PCC
Figure 5. RES and EVs integration into the smart grid with V2G capability. Ti stands for power
transformer and PCC for Power Control Center (adapted from [57])
The provision of V2G services to the SO is ultimately determined by its profitability for the parts. There are four power markets where V2G can be integrated, as it was analyzed by [73] and [74]:
1. Base load, i.e., power generation paid on an energy basis that is running most of the time at low cost to cover for constant demand. However, the authors concluded that V2G is not suitable for this market, because cannot be price
Chapter 2 - Background and state of the art
24
competitive due to EV limited energy storage, limited battery lifespan and high energy cost;
2. Peak power, i.e., power generated during times of predictable higher demand, e.g. cold periods. It is paid also on an energy basis. Normally, it is provided by combined cycle gas turbines (CCGT) power plants, which can be switched on for short periods of time. This energy is relatively expensive, making in some cases V2G competitive for peak power. Units operating in peak power mode work sometimes up to 5h, posing difficulties for V2G operate in this market because of storage limitations of each vehicle, which can be overcome drawing power sequentially from different sets of vehicles;
3. Spinning reserves, i.e., energy supplied promptly by permanently online rapid expensive generators in case of loss of programmed generation, e.g. equipment failure or failure of a power supplier to meet contract conditions. Typically, this generation is called for a few minutes a few times per year and is paid for the time available online. These conditions make spinning reserves market especially attractive for V2G;
4. Frequency regulation, i.e., generators that are used to keep the grid frequency and voltage stable. Typically, they are called for up to a few minutes several times per day. By contract, the calls could be limited in number and in duration for each individual EV. The authors concluded that V2G is highly competitive in this market. From the electrical utility perspective, this is a new source of high quality grid regulation and, from the EV buyer perspective, a revenue source that further encourage the purchase [75].
These conclusions are in agreement with [85], where the economic feasibility of using PHEV batteries for V2G aggregated as a grid-scale energy storage is analyzed according to [76]. The authors pointed out that the different uses of V2G technology in the various types of energy markets are not mutually exclusive, since, in fact, they can exist simultaneously. They propose that it is especially profitable for PHEV owners to use V2G for regulation on a daily basis and for peak reduction just on exceptionally high electricity demand days.
![Figure 4. Smart grid scheme with V2G functionality operating under the VPP approach (adapted from [57])](https://thumb-eu.123doks.com/thumbv2/123dok_br/19204601.955349/49.892.139.737.234.840/figure-smart-grid-scheme-functionality-operating-approach-adapted.webp)
![Figure 18. Modeled evolution of the total installed capacity of natural gas fired based power plants [155], [156]](https://thumb-eu.123doks.com/thumbv2/123dok_br/19204601.955349/103.892.231.665.337.652/figure-modeled-evolution-total-installed-capacity-natural-plants.webp)
![Figure 19. Modeled biomass, waste and biogas based fired capacity evolution until 2050 [155], [156]](https://thumb-eu.123doks.com/thumbv2/123dok_br/19204601.955349/104.892.203.677.444.849/figure-modeled-biomass-waste-biogas-based-capacity-evolution.webp)
![Figure 26. Population projections [177] and modeled passenger car stock evolutions until 2050](https://thumb-eu.123doks.com/thumbv2/123dok_br/19204601.955349/114.892.274.617.163.538/figure-population-projections-modeled-passenger-car-stock-evolutions.webp)
![Figure 30. Probability distribution used to define the EV daily journeys during weekdays [192]](https://thumb-eu.123doks.com/thumbv2/123dok_br/19204601.955349/126.892.240.629.181.467/figure-probability-distribution-used-define-daily-journeys-weekdays.webp)