A Work Project, presented as part of the requirements for the Award of a Master Degree in Management from the NOVA – School of Business and Economics.
BENCHMARKING PHILANTHROPY IN EUROPE
Tomé Guerreiro de Oliveira Salgueiro #3448
A Project carried out on the Master in Management Program, under the supervision of: Professor Miguel Alves Martins
2 BENCHMARKING PHILANTHROPY IN EUROPE
Abstract
The lack of organized information about activities and the performance of players in the third sector hinders the development of more and better philanthropy. Furthermore, the great diversity of countries, languages and more importantly giving cultures within Europe, is not inviting of international cooperation, creating challenges when learning from other practices across the continent. This thesis, and the major project it encompasses, is the first step by the Calouste Gulbenkian Foundation to benchmark and learn from the best initiatives in some of the most developed and fastest growing giving cultures in Europe.
Special thanks to the Calouste Gulbenkian Foundation and the European Research Network On Philanthropy for their invaluable support throughout this Work Project. Special recognition is due to Professor Miguel Alves Martins, Professor Pedro Santos (NovaSBE), Dr. Barry Hoolwerf (ERNOP), Dr. Aleksandra Vesić (Catalyst Balkans) and Dr. Irina Krasnopolskaya (HSE Moscow). For their irreplaceable ideas and feedback, many thanks to Matej Hanzel, Marie Jacklin, Miguel Cortes Rodrigues and Inês Freire de Andrade. To my brother, my grandmother and parents for their unconditional support.
3 Table of Contents 1. Introduction ... 4 2. Literature Review ... 4 3. Methodology ... 6 4. Results ... 7
4.1 Country profiles: Top 3 High Performing Countries (HPC) ... 8
4.2 Country profiles: Top 3 Highest Growth Countries (HGC) ... 12
4.3 Analysis of Results ... 16
5. Limitations of the work project ... 21
6. Conclusions and recommendations ... 22
7. Annexes ... 27
7.1 Literature Review Annexes ... 27
7.2 Methodology Annexes - Complete Methodology... 27
7.3 Results Annexes ... 32
7.4 Players & Initiative Profiles A ... 34
7.5 Inquiry sent to experts ... 44
7.6 List of experts cooperating with the project ... 45
8. References ... 46
4
1. Introduction
The main goal of this thesis is to be a pilot-project that establishes the ground work for a systematic and continuous analysis of the third sector in Europe. Due to its size and scope limitations, it cannot, and does not pretend to be a comprehensive benchmarking study, but instead, it is the first step to identify and describe the benchmarking process of successful players and initiatives. This work is part of a larger study commissioned by the Calouste Gulbenkian Foundation (CGF) to Nova SBE, that will result in a final report on some of the top philanthropy practices across the world, including: the identification of successful initiatives of foundations, the private sector, public policy, the application of European funds and academia. As one of the most relevant players in the Portuguese philanthropic landscape, CGF has expressed the need to further develop their range of action, with the goal of fortifying what is deemed a subpar giving culture in Portugal (ranked 104 out of 139 in the World Giving Index ranking). An analysis and a barometer of Portuguese context were done as part of other ongoing work projects, but a benchmark process is the next step in the achievement of this goal: to learn the most effective practices in other successful philanthropic ecosystems, including who the most effective players and initiatives are, so that these findings may eventually benefit the Portuguese third sector.
2. Literature Review
Though the line between charity and philanthropy can be quite blurred, today one could argue that, unlike charity, philanthropy addresses the root causes of the problem at hand (Leisinger and Schmitt 2011) in a long term perspective (Dietlin 2010), by giving to a cause without necessarily expecting anything in return. The intention of philanthropy is therefore the elimination of the problem, while most times charity, while not deprived of great purpose, only appeases an immediate need. According to the ERNOP report entitled “Giving in Europe” (ERNOP 2015), the recent era of austerity in Europe caused a “rediscovery” of philanthropy as
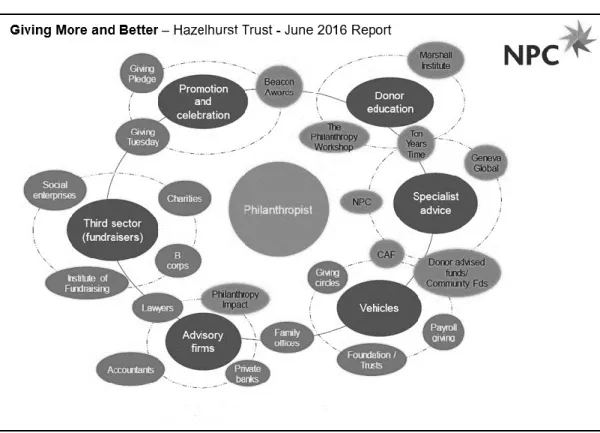
5 a major “source of funding for public good and social innovation”. In fact, the same study provides a conservative estimation of the total size of the philanthropy sector in Europe, at €92.8 billion in 2013. A more recent 2016 study, from Foundation Center (McGill 2016), estimates that the 147,000 registered foundations alone have annual expenditures of €60 billion. With this number in mind, one can only assume that the philanthropy sector is actually much bigger, since this value excludes all the individual and corporate giving. However, both these studies agree there is a lack of aggregate data, stating that there is a “gap in information” due to the lack of any standardized accounting and reporting on national giving. A significant characteristic of philanthropy in Europe is the impact of cultural diversity on giving across the many different nations. In an effort to understand this diversity, Norine MacDonald and Luc de Borms identified in their 2008 report “Philanthropy in Europe – A rich past, a promising future” (MacDonald and Borms 2008), four main models that should be kept in mind when looking at the philanthropy landscape: the Anglo-Saxon model (where civil society is expected to counterweigh the state presence in social causes), the Rhine model (where social corporatism has an important role and civil society organizations are sub-contracted by the state), the Scandinavian model (where a strong welfare state plays along with strong volunteering initiatives) and the Latin/Mediterranean model (where the state provides social services, and the church complements with an important charitable role). Since this work project concerns the benchmarking of philanthropy in Europe, it is crucial to look at the players that usually constitute developed philanthropic ecosystems. There is very little formal information on benchmarking of such initiatives, but recently, a study entitled “Giving More and Better – How can the philanthropy sector improve” (Kail, Johnson, and Bowcock 2016) established six main categories of players that work with philanthropists: promotion and celebration players (e.g. telephone/TV campaigns, institutions that celebrate great philanthropists, "giving" events, etc.); third sector players (e.g. NGO's); advisory firms (e.g. banks, law firms, consultancy offices that also advise donors); specialist advice players (entities whose entire focus is advising philanthropists, charities or donors);
6 vehicles (e.g. funds or foundations) and; donor education players (entities fully dedicated to research, education and/or networking for individuals, corporations and foundations, to promote better philanthropy). A comprehensive illustration of this landscape and the way each player interacts with one other can be seen in the annexes (Figure 2). More generally, while some publications (Charities Aid Foundation 2017b) have conservative estimates (pointing to only “a slight increase” in a 5 year average in the aggregate giving score of Europe) others have no doubts, describing it as a “flourishing” sector (Observatoire de la Fondation de France 2015). Indeed, though less rich that its US counterparts, in Europe, foundations are “more numerous”, “more dynamic” and the sector is described as “catching fire in terms of innovation” (BNP Paribas 2016). There is room then, to learn from the best practices in Europe, in view of replicating them in regions where such “fire” has not yet caught up.
3. Methodology
This work project can be succinctly divided in 5 stages: 1) First: data from the World Giving Index Reports (2010-’17) was compiled and analyzed, assisting in the categorization of the most successful philanthropic ecosystems in Europe. 2) A literature review on the philanthropy ecosystem was run for each of the top 3 countries with the highest percentage of people donating- the so called “High Performing Countries”. The same was done for the top 3 “Highest Growth Countries” over an 8-year period. 3) After, an enquiry was sent to experts in the 3rd sector, asking
them to name the most successful players and initiatives present in their home country. 4) From this feedback, a short list of players was briefly characterized. 5) Finally, this allowed us to reach a set of recommendations for areas of improvement.
Due to space constraints, a full and complete Methodology was moved to the annexes. For a full understanding of the following results, please consult before proceeding.
7
4. Results
After compiling the information available in all the World Giving Index Reports (see Table 9 in the Annexes), filtering out countries bellow 0.8 on the Human Development Index, and under 1 million inhabitants, countries were listed from highest to lowest, for both their 8-year average and the difference between the 3-year average from (2015-’16-’17) and (2010-’11-’12). Results are displayed in Table 1:
Table 1 - Selection criteria
Top 3 Countries
8-year average of pop.
donating money (%) Top 3 Countries
Growth - Difference between the average of the last 3 years and first 3 years (percentage points)
United Kingdom 73% Norway +18pp
Netherlands 71% Croatia +16pp
Ireland 65% Russian Federation +9pp
The results show that, considering the referenced criteria, the UK is the European country where more people donate, followed closely by the Netherlands. The behavior of the highest growing countries over the last 8 years, as well as it’s linear average (in blue) is illustrated in Figure 1.
Figure 1 - Giving performance amongst the highest growth countries
A closer analysis of giving over time shows that 3 countries observed significant increases: Norway, Croatia and the Russian Federation. This increase is particularly significant in the case of Norway, since it already showed positive results in the early 2010’s, but towards the end of this decade it is clearly positioning itself as a high performing country, with more than half of the population donating. Next, we explore the profiles and context of the philanthropy landscape
0% 10% 20% 30% 40% 50% 60% 70% 2 0 1 0 2 0 1 1 2 0 1 2 2 0 1 3 2 0 1 4 2 0 1 5 2 0 1 6 2 0 1 7 A V E R A G E P E R C E N T A G E O F P O P U L A T I O N D O N A T I N G ( % ) Norway Croatia Russian Federation
8 of the selected countries, dividing them in to 2 groups: Highest Performing Countries (HPC) and Highest Growth Countries (HGC):
4.1 Country profiles: Top 3 High Performing Countries (HPC)
United Kingdom
The meaning of philanthropy, as we know it today, probably had its origin all the way back in Tudor times in the UK, following the schism between Catholicism and Protestantism (Rhodri Davies 2017). The schism eventually led to a new approach to giving, one not focused on saving one’s immortal soul, but instead a more secular approach in view of addressing social problems and their underlying causes. Furthermore, being one of the first countries to see mass-urbanization during the industrial revolution, it’s society had to find a solution for the industrial workers that lived in extreme poverty within the ever-growing city boundaries. When the very-rich could no longer overlook and ignore the volume of needy individuals, they started coming together and pooling donations into intermediary organizations, with the objective of dealing with the root causes of urban poverty (Pharoah and Zimmeck 2015). Gradually, towards the early 20th century, society realized philanthropy was unable to deliver a universal system of welfare, which lead to the establishment of a full-blown welfare state. The 1980’s wave of public sector outsourcing eventually lead to a modern environment where many welfare services are now commissioned by the state, but delivered by the third sector. In the UK, the government, public entities and regulators have a relatively strong influence on the actions of charities. Each country belonging to the UK has its own Charity Commission, to which they need to submit Annual Audited Accounts (Pharoah and Zimmeck 2015). A range of tax reliefs are available to donors, corporations and charities, including income, corporate and even capital gains tax, if the purposes of the activity are considered charitable. Today, UK’s philanthropy ecosystem is thriving, ranking in 1st place in our Highest Performers category, with an 8-year average of 73% of its people donating to a cause. Indeed, the total amount given donated in 2016 was £9.7 billion or
9 €11.8 billion (Charities Aid Foundation 2017a). In the UK, our consulted experts recommended the following players in their responses to our inquiry:
Promotion and Celebration Comic Relief
Major Successes: It’s alternating biennial
telethons (Red Nose Day and Sport Relief) are probably the most successful televised events of the year. The Red Nose Day event in 2017 pulled in € 92,7 million. The 24-hour televised event included comedy shows (LOL-a-thon), concerts and even the participation of famous vloggers and YouTube stars.
Description & Objective: Launched in 1985 by Richard Curtis and Lenny Henry,
comedians, Comic Relief has become one of the two biggest telethon events in the UK. They are a grant making charity with more than 2,000 projects in the UK and worldwide focused on: eradication of domestic violence, malaria and other diseases, health, gangs and violence, LGBT rights, refugee crisis, sanitation and suicide, to name a few. Their goals include remaining a preeminent UK fundraiser and delivering an ambitious grant program.
Stakeholders – Staff: 304; Volunteers: 355 (celebrities/sports figures); Board of Trustees: 14; State presence:
yes. Through BBC, the national public broadcaster; Expenditures with Program (2016): €133,9 million;
Program Expense percentage: 86%; Total Net Assets: €114 million; Website: https://www.comicrelief.com/
Third sector
Motor Neurone Disease Association
Major Successes: The Association joined The Ice Bucket Challenge in August 2014 and raised over 7 million pounds in donations. The challenge consisted of a series of viral videos on social media where donors would drop a bucket of cold water over themselves and challenge other people to do the same, while donating to the cause.
Description & Objective: The Association goal is to eradicate MND. They care for
and support people with MND and their families, raising awareness so that the needs of everyone involved are recognized by society. MNDA fund and promote global research but are also focused in treatment of people in England, Wales and Northern Ireland.
Stakeholders - Staff: 189; Volunteers: 7,000; Board of Trustees: 15; State presence: no; Expenditures with Program (2016): €16.5 million; Program Expense percentage: 78%; Total Net Assets: €12.7 million; Website: https://www.mndassociation.org
Advisory firms
BLP Private Wealth –Berwin Leighton Paisner
Major Successes: It’s parent company has
been awarded Law Firm of the year eight times since 2004. They have helped more than 5,000 wealth owners and their families since inception. BLP is also ranked as a Tier 1 firm by Legal 500 for personal tax, trusts and probate and contentious trusts. It has helped established charities that donate more than €610 million every year.
Description & Objective: BLP is a focused unit of the international law firm Berwin
Leighton Paisner that advises ultra-high net worth individuals in everything from cross-border tax, to investment, creating trusts and foundations, as well as succession plans for them and their businesses. BLP also advises charities and trustees, and BLP partners sit on the board of over 100 charities.
Stakeholders – Staff: At least 18 Private-Client specialists; Volunteers: N/A; Board of Trustees: 12; State presence: no; Expenditures with Program (2017): N/A; Program Expense percentage: N/A; Total Net Assets: N/A; Website: http://www.blplaw.com
Specialist advice
National Council for Voluntary Organisations (NCVO)
Major Successes: NCVO has become a strong
lobbyist organization by representing around a third of the voluntary sector workforce in England. It has influenced policy and collaborated with public services by identifying key challenges for small/medium charities. They have also been selected to develop guidance policies for the NHS and BBC to promote volunteering. They have been able to move to a paid-for model by generating revenue from membership fees, donations, advisory services, investments and even publicity in their publications, while maintaining free-access to content for organizations with revenues below €122,000.
Description & Objective: NCVO specializes in providing training, information
and guidance to close to 12,750 member charities and NGO’s. Its strategic aim is to champion the voluntary sector, strengthen voluntary organizations, connect people and organizations. They are experts in training and events, they have consultancy services, set quality standards, negotiate preferential arrangements with suppliers for their members and have their own publications on topics that range from campaigning, governance or financial management. Its Institute for Volunteering Research publishes the UK Civil Society Almanac and they organize a major Voluntary Sector and Volunteering Research Conference annually.
Stakeholders – Staff: Just over 100; Volunteers: N/A; Board of Trustees: 12; State presence: Yes
(funding of website); Expenditures with Program (2017): €8.7 million; Program Expense percentage: 84%; Total Net Assets: €26.9 million; Website: https://www.ncvo.org.uk
10
Vehicles Wellcome Trust
Major Successes: For a long time, the Wellcome
Trust has been funding projects that include finding ways to beat malaria, malnutrition, HIV and improve palliative care. It has also been focused on growing the size of its endowment. Its investment portfolio returned €4.3 billion between mid-2015 and mid-2016, an increase of 18.8%. By growing at this rate, the trust hopes to continue to increase its spending (already doubled from 2006, when it was around €609.8 million/year).
Description & Objective: A biomedical research charity established with the
legacy of Sir Henry Wellcome. Their goals include remaining an independent global charity dedicated to improving health, research into any biosciences, discover and improve any cure, treatment or diagnosis process to improve human beings, animal or plant life. Wellcome is essentially a grant-making entity.
Stakeholders – Staff: 1,832; Volunteers: N/A; Board of Trustees: 9; State presence: no; Expenditures with Program (2016): €1,210 million; Program Expense percentage: 85%; Total Net Assets: €23.9
billion; Website: https://wellcome.ac.uk
Donor education Charities Aid Foundation
Major Successes: CAF is a pioneer in banking for
charities. CAF-Donate processed in 2016 more than €60.9 million in donations to more than 2,300 charities. CAF is currently the largest provider of donor advised funds, with major private clients donating more than €346.3 million in 2016/2017. Among its services to companies the payroll giving scheme Give As You Earn (GAYE) allows companies to use tax breaks effectively and staff to donate directly from their salary paycheck. They help 250,000 staff and their companies give over €90.2 million each year through this system.
Description & Objective: CAF is focused on providing assistance services to
charities, businesses and donors. It supports major donors at every stage with strategic advice and work with both donors and charities to allocate resources effectively. It operates its own Bank, which offers banking services for charities, providing them funding and finance. Among other things, it also operates an online platform that gives charities the tools to fundraise through the internet, mobile devices or Facebook – CAF Donate. CAF also promotes Social Investment solutions through CAF Venturesome. Crucially, one of its most successful activities is research and publication of countless reports about the sector, including the annual Giving Reports and the World Giving Index.
Stakeholders – Staff: 532; Volunteers: 35; Board of Trustees: 16; State presence: no; Expenditures with Program (2016): €586.5 million; Program Expense percentage: 93%; Total Net Assets: €1.59
billion; Website: https://www.cafonline.org
Contributions and selection done by:
• Dr. Beth Breeze, the Director of the Center for Philanthropy - University of Kent • Dr. Debra Morris, Head of School of Law and Social Justice - University of Liverpool
• Dr. Carol Mack and Dr. Emma Hutchins, respectively, the CEO and Policy and Communications Officer at the Association of Charities.
Due to space limitations, the recommended players for the remaining analyzed countries, were moved to the Players & Initiative Profiles AAnnexes.
Netherlands
Philanthropy has been a strong characteristic of Dutch society, a long time before any kind of welfare state was introduced. It was primarily motivated by the will of the elite guilds and churches to maintain public order, gain status, seek influential involvement and the salvation of soul (Beck and Casu 2015). Deeply rooted in Dutch history is also the society’s intention to avoid building a strong centralist state and instead provide plenty of provincial and local autonomy (Burger and Dekker 2001). More recently, in the 20th century, two main forces acted on the philanthropic culture: “pillarization” of society and the rise of social democracy. Pillarization was essentially the division of society into “pillars”, among which the Roman
11 Catholic, and the Orthodox Calvinist churches rose once again to prominence. Pillarization reflected itself in the segregation of these communities from each other along religious, socioeconomic and political lines. This resulted in the creation of independent organizations like parties, unions, housing associations, media groups and even schools and hospitals. At the same time, the social democratic movement led to the creation of extensive social security and welfare services. The opposition of these two forces led instead to the creation of a strong, nonprofit, non-governmental response, that is still reliant on public funding. According to a EUFORI report (Hoolwerf, Karamat Ali, and Gouwenberg 2015), in the Netherlands it is relatively easy to start a foundation or a nonprofit, as long as it’s aim is clearly in the pursuit of idealistic or social goals, and does not distribute profits to the founders. They have however a subtle distinction from other institutions in that they do not necessarily need a charitable or public benefit aim, allowing them to pursue commercial activities and allow board members to receive salaries. There are numerous fiscal incentives, including the exclusion of corporate, inheritance and capital gains (this last one does not exist in the Netherlands). However, they have got to keep transparency, and after 2014 in order to benefit from these fiscal facilities, they must report their mission, income, expenses, salaries and policy to the Dutch Tax Authority. The Netherlands rank 2nd in our Highest Performers list with an 8-year average of 71% of people donating to a cause.
Ireland
According to The Palgrave Handbook of Global Philanthropy (Beck and Casu 2015), Ireland’s philanthropic culture has deep roots in its history, and a lot of it is related to the presence of strong religious influences within the country. Back in the 1700’s, when Ireland was still greatly influenced by Protestantism, and also more recently with the emancipation of the Catholic clergy, the church has had a pivotal role alleviating poverty and providing social services to those in need. By the beginning of the 20th century, most health care and education services were provided by religious orders. This trend has carried on to recent years, with many of these organizations
12 still in existence and having partnered with the government to receive public funds to carry their social endeavors. Indeed, up until 2012, around 96% of schools in Ireland, though mostly publicly funded, were still denominational (most of them Roman Catholic) (Coolahan, Hussey, and Kilfeather 2012), which speaks to the strength that these institutions hold in Irish society. That same year, a report about Nonprofit relations in Ireland (Donnelly-Cox et al. 2012) stated that “nonprofit organizations are often the main providers of many state-funded services such as education, disability support (… and) health care.”. Despite the 2008 economic crisis, which saw “internal tension in nonprofits struggling to fulfill their advocacy commitments and their service delivery roles with shrinking resources”, the sector has since bounced back and seen a 15% annual average increase in fundraising and donations between 2013-15 (Benefacts 2017). In fact, just the charities sector, is made up by more than 8,000 organizations, generates more than €5 billion, employing more than 100,000 people and catalyzes the engagement of more than 500,000 volunteers every year, according to the Register of Charities (Website#6). Nevertheless, some are still very critical of the role of the government and the tax incentive laws, which seem to be hindering the development of the giving culture. Some of the criticism focuses on the several caps on incentives and the fact that no personal benefit is available on individual donations (Power, Connor, and Street 2017). Ireland ranks 3rd in our High Performers list with an 8-year average of 65% of people donating to a cause.
4.2 Country profiles: Top 3 Highest Growth Countries (HGC) Norway
According to a EUFORI report, in what appears to be due to a series of historical circumstances, Norway has “a weak philanthropic tradition” (Sivesind and Arnesen 2015). In fact, going back to the 19th century, the upper-middle class was small in number and not very “self-confident”,
while the lower classes, even if extremely poor (farmers and fisherman), enjoyed a kind of freedom and equality, unparalleled in Europe. Since there was not a lot of wealth concentration,
13 distributing it was not a priority, and was viewed as something that would potentiate laziness. Despite this, labor intensive civic engagement was well and truly alive, and people seemed to prefer donating their time rather than money (Lorentzen 2004). Before the 1960’s Norway was, by all accounts, a poor country with weak industrial output, mountainous and mostly unfarmable land, and modest standards of living. It was only with the discovery of massive reserves of oil and the implementation of social-democratic ideologies in the last 50 years, that Norway saw a dramatic transformation. While other countries like the UK saw an early emergence of a rich class of industrialists, merchants and nobility in urban areas, Norway did not build a strong middle class until much later, when a powerful welfare state was already firmly established. According to Lorentzen (2004), the strong role of the social-democratic regime in providing modern welfare, reduced voluntary associations into simple “interest groups” whose only goal was to relay their demands to the state. They embraced the role of “provider of premises”, instead of “provider of services”. Our analysis however, brings to light a change in Norway’s third sector. People seem to be more willing to donate money, a finding that is corroborated by a recent Deloitte Report on Fundraising (Deloitte 2016). It finds that regular donations have been increasing to the tune of almost 10% per-year on average, from 2012 to 2015. This has been accompanied by a strong emergence of social media as a marketing channel, and even been spurred by the growth of popular payment apps like “mCash” and “Mobilepay”. Some causes have been particularly endearing to Norwegians: UNICEF Norway and the Norwegian Refugee Council have seen the largest increases in donations throughout 2015, in particular to their Syrian refugee campaigns. As a matter of fact, our analysis shows a 18% increase in the percentage of people donating money in the 3-year average between 2010-’11-‘12 and 2015-’16-‘17. On average, 43% of the population donated in those first 3 years, while 61% donated in the last 3.
14 As early as the 15th century records have been found that show foundations run by the church that would mainly provide scholarships in what today is recognized as Croatia (AED CroNGO 2003). In the 19th century Austro-Hungarian Empire, there were already a series of prominent
and wealthy industrialists setting up foundations and working together with the Catholic church, to provide social welfare (Bežovan and Zrinščak 2007). It seems this was relatively common across the Empire: to have nobles and well-off families providing resources to institutions. To the extent that in 1913 there were around 241 such institutions, just in Zagreb. These were mostly funded by donors known as mecena (European Research Network on Philanthropy 2017). After the First World War, the role of the Catholic Church became crucial to provide help to the poor, and a significant number of secular organizations were either suppressed or nationalized during the socialist authoritarian regimes that then followed in the wake of World War II. This essentially led to an undeveloped philanthropic ecosystem towards the early 1990’s, when yet another war for the country’s independence started (1991-‘95). Surprisingly, the war seems to have catalyzed Croatian solidarity and the rise of self-organized citizen associations. Though “systematic, organized philanthropic actions ceased to exist”, (…) “citizens would regularly contribute on a totally voluntary basis to humanitarian causes” (AED CroNGO 2003). More recently, the entire third sector seems to have gained new life. According to a 2013 Report (Catalyst 2013), Croatian nonprofits are “more successful fundraisers than similar organizations in other countries of the region”, there is an increasing number of instances where philanthropy is addressed in media and there is even a growth in giving to causes outside of Croatia (e.g. Syrian war refugees), which singles out the country from its regional counterparts. The same report states that though Croatian non-profits tend to be small, they are very trusted, so Croatians feel confident in giving money and volunteering their time (Croatia happens to be the leading country in terms of time donated in the Balkans). The government seems to have an important role in this process. Indeed, since the early years of the 2000’s, they have seen a series of tax incentives which were introduced to individuals and companies (up to 2% of income is
15 deductible), as well as total tax exemption for NGO’s and foundations for any income, property, inheritance or gifts (Council on Foundations 2017). Our analysis of Croatia shows an increase of 16% in the number of people donating money in the 3-year average, between 2010-’11-‘12 and 2015-’16-‘17. On average, 17% of the population donated money in those first 3 years, while 33% donated in the last 3.
Russian Federation
According to the Palgrave Handbook of Global Philanthropy (Beck and Casu 2015), charitable giving in Russia first appeared around the 10th century, making this one of the oldest records of philanthropy amongst the countries in our analysis. It is reported that at that time, one of the priorities of the Russian Orthodox Church and its nobility was almsgiving, so it would be common for them to give to the poor. Despite this, the true institutionalization of philanthropy only began in the second half of the 18th century, when members of the privileged classes started gathering to support a specific cause. After serfdom was abolished in the 1860’s, the Era of Great Reforms ushered in a new age of civil society development and engagement in public-driven initiatives. This was a time when many great philanthropists established hospitals, schools and museums. Indeed, “by 1902 Russia had 11,040 charities”, and “the government accepted and even welcomed the presence of NPO’s” (Beck and Casu 2015). This all changed in 1917 with the Soviet revolution. From then on, and until it’s fall in 1991, the state took over the role of most existing non-profits, and though it supported education, health care and distributed money by quotas, all private businesses and NPO’s were eliminated. Not even the churches were allowed to interfere in anything else but religious service. This led to the elimination of their schools and support services for the poor. More recently, during Gorbachev’s perestroika, the third sector started slowly to reassume its long-lost role in Russian society. This advancement was delayed however by the strong economic recession of the 1990’s, and it was only resumed when Russia finally started experiencing economic recovery and the emergence of the middle
16 class (CAF Russia 2017a). Today, according to the Russia Giving CAF report, contrary to popular belief, Russians, though infrequent, tend to be generous givers. The last estimate points to an average annual donation around 2,000 RUB, despite the high levels of mistrust and the widespread belief that “charitable activities aid tax evasion” (CAF Russia 2014). Russians prefer to donate directly to the beneficiary and are particularly keen to assist distressed children, and they are less prone to support nonprofits related to the environment, culture, or marginalized groups (e.g. HIV patients). One particular initiative that has recently helped develop philanthropy, is the CAF Russia and the World Bank proximity program entitled: “Local Self-Governance and Civic Engagement in Rural Russia” (CAF Russia 2017b). This program provides free consulting, financial support and information which in turn has resulted in more than 70 Community Foundations being created throughout rural Russia, triggering the development of local philanthropy and fundraising from businesses and federal grants. Another example of the fast-paced transformation is the way Russians have embraced technology: in 2014, 15% said they donated through the internet, while in 2017 that number more than doubled to 34%. Indeed, our analysis of the Russian Federation shows an increase of 9% in the percentage of people donating money in the 3-year average, between 2010-’11-‘12 and 2015-’16-‘17. On average, 6% of the population donated in those first 3 years, while 15% donated in the last 3.
4.3 Analysis of Results
To allow a comparison of the players from both HPC and HGC, the collected aggregate data was organized in tables. Though all the players and initiatives were assumed to be “the best” for each country, and there are good lessons in all of them, there are some differences in the choice pattern of experts as well as the intrinsic characteristics of each group of countries.
Main findings on the characteristics of Promotion and Celebration players:
Our experts recommended 6 successful players and initiatives: 2 Telethons (Comic Relief -UK; 3FM Serious Request -Netherlands), 3 Donor Award Ceremonies (Philanthropist of the Year
17 Award from CFI: Community Foundation Ireland; Social Entrepreneurs Award from FERD -Norway; Award for Female Philanthropist from Zamah -Croatia), 1 Celebratory Campaign
Day (#GivingTuesday from CAF -Russia).
Table 2 - Comparative Analysis: Promotion and Celebration High Performing
Countries
Highest Growth Countries
Countries that have Promotion and Celebration players present 3/3 3/3
Players that have state presence 2/3 1/3
Players that have a religious denomination 0/3 0/3
Range of number of professionalized staff* 14 – 304 7 – 225
Range of number of volunteers involved* 355 Tens of thousand
Provides full financial disclosure 2/3 2/3
Range of expenditures with program* €5.7 million – €133.9 million €50,500 – €6.5 million
Range of program expense ratio* 86% – 90% 72% – 96%
Range of total net assets* €50.5 million – €114 million €152,500 – €1.1 million
*When data is available
▪ Telethons make up 2 out of 3 of the recommended players in HPC, while 2 of 3 award ceremonies were picked by experts in HGC;
▪ The state has a significant presence, taking part in half of all the selected initiatives;
▪ Of those that disclose financial information (4 of 6), Comic Relief (UK) has the highest program expenditure (€133.9 million), but CAF Russia has the best program expense percentage at 96%.
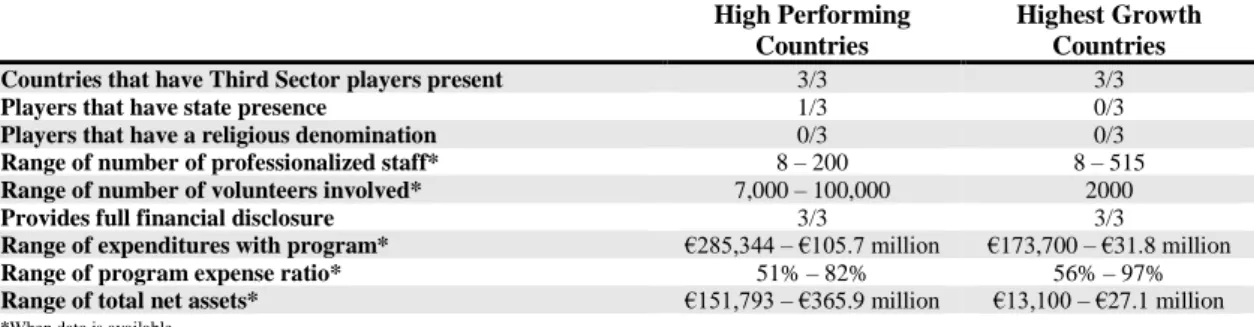
Main findings on the characteristics of Third Sector players:
Our experts recommended 6 successful players: 2 Associations (Motor Neurone Disease Association -UK; Dutch Cancer Society -Netherlands), 1 Venture Capital Fund (SIF: Social Innovation Fund -Ireland), 1 Social Enterprise by a Charity (FRETEX -Norway), 1 Charities (“Give Life” -Russia), and 1 Foundation (Slagalica Community Foundation -Croatia).
Table 3 -Comparative Analysis: Third Sector High Performing
Countries
Highest Growth Countries
Countries that have Third Sector players present 3/3 3/3
Players that have state presence 1/3 0/3
Players that have a religious denomination 0/3 0/3
Range of number of professionalized staff* 8 – 200 8 – 515
Range of number of volunteers involved* 7,000 – 100,000 2000
Provides full financial disclosure 3/3 3/3
Range of expenditures with program* €285,344 – €105.7 million €173,700 – €31.8 million
Range of program expense ratio* 51% – 82% 56% – 97%
Range of total net assets* €151,793 – €365.9 million €13,100 – €27.1 million
18 ▪ 2 out of 3 HPC players are civil associations, while in the HGC, all 3 of the selected philanthropic
initiatives are led by charities or a foundation;
▪ Social entrepreneurship and venture capital are already amongst the selected initiatives in both HPC and HGC. Instead of providing funds, grants or donations, they are approaching philanthropy from a business point of view, investing in/or operating social businesses;
▪ All the players show a high level of financial and operational transparency. The Dutch Cancer Foundation (Netherlands) has the highest program expenditure (€105.7 million) but the highest program expense percentage belongs to the “Give Life” Charity (Russia) with a 97%.
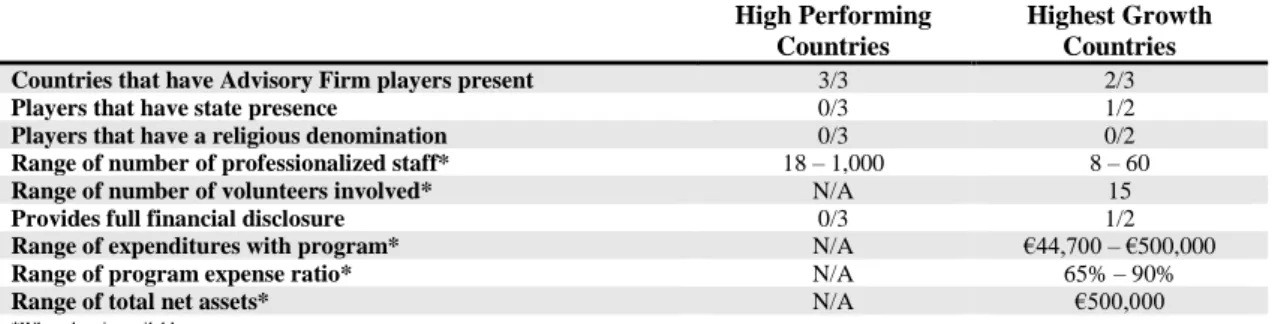
Main findings on the characteristics of Advisory Firm players:
Our experts recommended 5 successful players: 1 Law Firm (Berwin Leighton Paisner -UK); 2
nonprofits (LCS: Lawyers for Civil Society -Russia; PFC: Partnership for Change -Norway), 1 Bank (ABN-AMRO -Netherlands) and 1 Financial Advisors (Davy Charities –Ireland). Only
one country lacked such Advisory Firms: Croatia.
Table 4 - Comparative Analysis: Advisory Firms High Performing
Countries
Highest Growth Countries
Countries that have Advisory Firm players present 3/3 2/3
Players that have state presence 0/3 1/2
Players that have a religious denomination 0/3 0/2
Range of number of professionalized staff* 18 – 1,000 8 – 60
Range of number of volunteers involved* N/A 15
Provides full financial disclosure 0/3 1/2
Range of expenditures with program* N/A €44,700 – €500,000
Range of program expense ratio* N/A 65% – 90%
Range of total net assets* N/A €500,000
*When data is available
▪ There seems to be a lack of for-profit players operating in this space in HGC, and while the state has an important role funding one of the HGC examples (LCS in Russia), no state is present in any of the 3 examples chosen by experts for HPC. In Croatia, such advisory services do not exist and in Russia, a nonprofit is providing legal counselling;
▪ In the Advisory Firm segment, the lack of transparency and information about the application of funds in philanthropy is common to almost all players selected by our experts. There is almost
19 no disclosure about any practical results of their advising efforts, except in the case of PFC (Norway). There could be several reasons for this, but it might be related to the secretive nature of the service providers themselves, or because clients prefer to give privately.
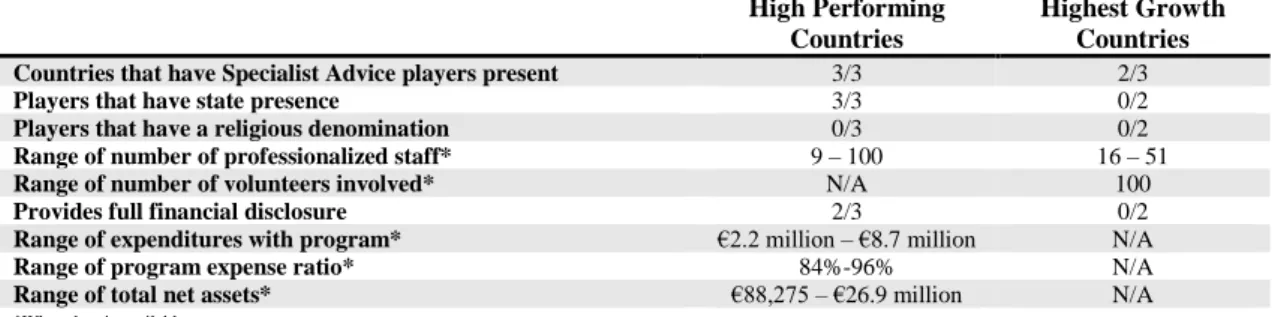
Main findings on the characteristics of Specialist Advice players:
Our experts recommended 5 successful players and initiatives: 1 Lobbying Representative (NCVO: Nacional Council for Voluntary Organizations –UK), 1 Research Center (CPS: Centre for Philanthropic Studies VU Amsterdam –Netherlands), 1 Public-private Nonprofit (Genio Company & Trust -Ireland), 1 Community Centre (Impact Hub: Moscow –Russia) and 1
Centre of Excellence (euphoria –Norway). Croatia lacked any Specialist Advice players. Table 5 - Comparative Analysis: Specialist Advice
High Performing Countries
Highest Growth Countries
Countries that have Specialist Advice players present 3/3 2/3
Players that have state presence 3/3 0/2
Players that have a religious denomination 0/3 0/2
Range of number of professionalized staff* 9 – 100 16 – 51
Range of number of volunteers involved* N/A 100
Provides full financial disclosure 2/3 0/2
Range of expenditures with program* €2.2 million – €8.7 million N/A
Range of program expense ratio* 84%-96% N/A
Range of total net assets* €88,275 – €26.9 million N/A
*When data is available
▪ The state is always present, either by sponsoring or providing funding to specialist advice players in HPC, while not present in the HGC;
▪ Financial transparency is still an issue, particularly in HGC, where none of the players have full disclosure. Among those that report it (2 out of 5), NCVO (UK) has the highest program expenditure (€8.7 million), while Genio (Ireland) is the best performer, with a 96% program expense percentage.
Main findings on the characteristics of Vehicle players:
Our experts recommended 6 successful players: 1 Foundation (IKEA Foundation -Netherlands;), 2 Trusts (Wellcome Trust -UK; Kavli Trust -Norway), 3 Charitable Funds (basis.point -Ireland; “Enjoyable Aging” -Russia; Zaklada Mikec Fund -Croatia).
20
Table 6 - Comparative Analysis: Vehicles High Performing
Countries
Highest Growth Countries
Countries that have Vehicle players present 3/3 3/3
Players that have state presence 0/3 0/3
Players that have a religious denomination 0/3 0/3
Range of number of professionalized staff* 0 – 1,832 0 – 20
Range of number of volunteers involved* 100 20,000
Provides full financial disclosure 3/3 1/3
Range of expenditures with program* €68,609 – €1,210 million €106,000 – €7.4 million
Range of program expense ratio* 85% – 99% 92% – 100%
Range of total net assets* €248,059 – €23.9 billion €42 million
*When data is available
▪ Most vehicles run grant-making programs, though some choose to host their own activities. Some rely on a growing endowment from a single major donor (of which growth is achieved through financial operations). However, a few simply act as fundraisers and disbursers (typically Charitable Funds), giving away almost all their funds yearly, and reinitiating fundraising operations the following year. The latter tend to have the best program expense percentages; ▪ While all players in HPC disclose financial information, only 1 out of 3 HGC do so. The best
performer was Zaklada Mikec Fund in Croatia with a program expense percentage of 100%.
Main findings on the characteristics of Donor Education players:
Our experts recommended 6 successful players: 2 Foundations (CAF -UK; FPCSD: Foundation for Partnership and Civil Society Development -Croatia), 2 Associations (Philanthropy Ireland -Ireland; Effektiv Altruisme -Norway), 1 Funds (Donors Fund -Russia), 1 Philanthropy
Consultancy Agency (Beter Geven -Netherlands).
Table 7 - Comparative Analysis: Donor Education High Performing
Countries
Highest Growth Countries
Countries that have Donor Education players present 3/3 3/3
Players that have state presence 0/3 2/3
Players that have a religious denomination 0/3 0/3
Range of number of professionalized staff* 2 – 532 6 – 11
Range of number of volunteers involved* 35 20 – 7,117
Provides full financial disclosure 2/3 0/3
Range of expenditures with program* €440,000 – €586.5 million €88,800 – €117,000
Range of program expense ratio* 79% – 93% 33% – 55%
Range of total net assets* €490,000 – €1.6 billion N/A
*When data is available
▪ All the countries analyzed already had donor education players, though for most of the players, this was not their primary activity or focus;
21 ▪ Financial transparency remains an issue for both groups, particularly in the HGC. Players in HGC have very low program expense percentages (between 33%-55%) when compared to its counterparts in HDC (79%-93%). The player with the highest program expenditure (€586.5 million) and the highest program expense percentage is CAF (UK) with 93%.
5. Limitations of the work project
Though this work project is solely based on the opinions of some of the most reputable figures in the European third sector, it is not without some significant limitations:
First, there is a lack of consolidated information on what constitute “good practices”, a great scarcity of clear examples of “recommended players” or any European equivalent to rating systems like “GuideStar” or “Charity Navigator” in the USA. There is also an obvious language barrier with annual reports and other available material (e.g. Russian Federation). Furthermore, our ranking of countries is based on the results of the following question from Gallup’s World View World Poll: “Have you in the past month donated money to an organization?”. This means that the survey only takes into consideration those donations that were made within the month prior to the enquiry. This could allow us to get a sense of regular giving (and therefore the giving culture), if the survey was conducted over time. Unfortunately, since we don’t have information on the timing of the survey, we should assume that it might take part during a relatively short period of time, and might be capturing some giving “waves” triggered by one-time events like natural disasters or seasonal giving.
A third significant limitation is that the study relies on the opinions of some selected experts that were procured either through snowball sampling or by contacting authors and academic researchers that have published material about philanthropy (many EUFORI authors were contacted, for example). However, in some cases the author of this work project had to resort to interviewing preeminent social workers or managers of some of the active players in each
22 ecosystem. This obviously creates a lack of distancing and an exemption issue, where some of the experts tend to refer to their own organizations as “good examples”. This could only be avoided if more people were interviewed, as well as cross-analyzing and validating more answers. Therefore, due essentially to time constraints on the inquiry of experts, the study suffers from possible autophagy in the player identification process. Another limitation of this work project concerns the distinction made between charity and philanthropy and the role of some of the players described. It could be argued that some of the expert-selected players are not actually working in the realm of philanthropy, but instead, charity.
6. Conclusions and recommendations
After analyzing all the selected countries, we can indeed attest to the existence of several different giving cultures in Europe as stated by MacDonald and Borms (2008). What was found was that the 4 models proposed by these authors overlook, perhaps, an important set of countries that have also given significant steps to improve their giving culture the last few years. These are post-socialist countries, where the “market economy still has some functional deficiencies (…) and there is a lack of philanthropic traditions, (and) corporate social responsibility“ (Oprea 2015). The major examples uncovered by this study are Croatia and the Russian Federation, that have noticed significant increases in giving over the last 8 years on record.
For all intents and purposes of this work project, we can put forward a few precursory results: We have plausible reasons to conclude that Award Ceremonies are an effective tool to motivate and increase donor engagement. One of the reasons that might explain this is the importance given to a “seal of approval”, especially in countries were philanthropists still face reputation concerns, as people are more doubtful of the intentions of givers (e.g. Croatia). In developed ecosystems, the state media is mobilized and allocates significant air time to philanthropic causes on a continual basis. Social media is now one of the main tools to build fundraising awareness
23 along with the use of mobile apps. This micro-transaction tool is unlocking funds that were not accessible before, particularly from the millennial segment of the population.
Social entrepreneurship and venture capital funds are decidedly a growing trend and among some of the more highly recommended third sector approaches. Indeed, the pursuit of profitable endeavors with philanthropic goals, when both means and ends are transparent, is pointed out by experts as being beneficial, not detrimental, to those causes.
States and governments in developed philanthropic cultures seem to also have an important role funding specialist advice players, either through academia or public-private efforts. From our results, it became apparent that one of the major distinctions between a highly developed and a growing philanthropic ecosystem is the presence of for-profit players, like banks, law firms or consultancy agencies providing advisory services. When it comes to vehicles, our analysis shows that charitable funds seem to have better program expense percentages, meaning that a bigger percentage of the funds raised goes directly to the causes, resulting in lower overhead costs associated. They seem however to be a lot more limited in their scope of action, usually focusing only on one or two grant programs, so they might not be as effective in certain contexts. Finally, it becomes clear that (generally) players in the most developed giving cultures tend to fully disclose financial information to the public.
Final considerations: Throughout the creation of this work project, there were talks and email
exchanges with 50 third sector experts from all corners of the world, and some of them were willing to provide more insights about their own experience. One such case was that of Dr. David Rosado, Manager at Foundation Center in the USA. Dr. Rosado calls attention to the role of Community Foundations. According to him, they combine a more “traditional way” of operating with “more innovative ways” of giving, allowing community members to “take charge of a piece of their local grantmaking”. Indeed, our study shows this kind of foundation has already a huge impact in the case of the Russian Federation. For Dr. Rosado, philanthropic advisory firms are
24 also helping the implementation of “positively impactful strategies” while, as a trend for the future, he underlines the importance of impact investing as a way of foundations “generating a financial return” and being able to keep funding their philanthropic operations.
From a telephone interview (22 December 2017), Dr. Sagi Melamed (Vice-President at the Yezreel Valley College in Israel), underlined the importance of content creation and consulting support for institutions themselves. This includes the publishing of “how to guides” that allow the democratization of access to fundraising and management methods, contributing to the advancement and professionalization of non-profit structures.
Another expert that provided important insights was Dr. Kate Bahen, Managing Director of Charity Intelligence Canada. According to Dr. Bahen, both in Canada and in the US, the players that are “transforming giving” are donor platforms like “Charity Navigator, GuideStar and GiveWell”. According to her, “confidence and trust are the foundation of donor giving” and the rating systems have ripple effects over charities whilst at the same time keep donors informed. These kind of rating platforms are forcing players to become more “transparent, accountable and focused on results”. It appears that the main problem which seems to be hindering the development of more and better philanthropy is the lack of accountability and transparency. It makes sense then to recommend the establishment of a player like GuideStar in Europe (see
GuideStar Profile 1). GuideStar is an organization that disseminates information about tax, finances, impact and reputation of programs and governance of different players in the third sector. It currently oversees more than 2.4 million organizations, has 7.2 million users and acts simply as a repository of data that can be accessed by the public when trying to make an informed giving decision. Once audited and monitored, charities and nonprofits now have a positive drive to improve and demonstrate results, generating better philanthropy. Because the information is available and there is accountability for the money raised, people are more willing to trust institutions, increasing donations and therefore generating more philanthropy.
25 Because this work project report is part of ongoing research and a benchmarking process, the results and conclusions obtained are preliminary in nature. It is the author’s opinion that a valid benchmarking process has been reached: a comprehensive review of the giving culture of countries and its constraints, followed by expert consultation and the profiling of “best in class” initiatives. However, this can be only the beginning of a far more comprehensive study, given the significant database of both experts (more than 50 collaborating in 28 countries) and initiatives (more than 332) established, and the amount of interest already demonstrated by at least 3 institutions (the ACPNS: Australian Centre for Philanthropy and Nonprofit Studies, BNU: Beijing Normal University and RUN: Radbound University Netherlands), some steps could be taken to lead this project further:
▪ Consider the conception of a Good-Practices Manual, and explore the chance of getting financial support from existing partners or others that might be interested.
▪ Resume contacts with: Dr. Barry Hoolwerf from VU University in Amsterdam and ERNOP, Dr. Wendy Scaife from ACPNS in Australia, Dr. Chan Yu from BNU in Hong Kong and Dr. Irina Krasnopolskaya from RUN.
▪ Resume expert identification and inquiry. ▪ Enhancing and growing the case study database.
▪ Initiating a double checking and validation process for each player and initiative described.
▪ Finding committed country-coordinators for each of the analyzed countries to help expand the existing country profiles using national, reliable sources.
▪ Finding regional editors (essentially in Asia, Oceania and America) to help compile the collected information.
▪ Aggregate all the available information to trace the dominant characteristics of the best philanthropic ecosystems, and the characteristics of countries that are experiencing high growth in their giving culture.
▪ Identify future philanthropy tendencies.
26 A Work Project, presented as part of the requirements for the Award of a Master Degree in
Management from the NOVA – School of Business and Economics.
ANNEXES
BENCHMARKING PHILANTHROPY IN EUROPE
Tomé Guerreiro de Oliveira Salgueiro #3448
A Project carried out on the Master in Management Program, under the supervision of: Professor Miguel Alves Martins
27
7. Annexes
7.1 Literature Review Annexes
Figure 2 - Landscape of a developed Philanthropy Ecosystem (Adapted from NPC 2016 Report)
7.2 Methodology Annexes - Complete Methodology
To identify the most successful nations when it comes to philanthropy and charitable commitment, given this is highly subjective field, some metrics had to be established that allowed us to measure such performances, preferably over time. On this topic, no study has a bigger scale or scope than the Charities Associations Foundations (CAF) very own World Giving Index ranking. With each succeeding report, released since 2010, CAF intends to “provoke debate and encourage people, policymakers and civil society to think about what drives giving, and put in place policies to grow the culture of giving worldwide. “(Charities Aid Foundation 2017b). The report is based on data from Gallup’s World View World Poll, which is carried out in 139 countries, representing around 95% of the world population. For most countries surveyed,
28 1,000 questionnaires are sent out to what is considered a representative sample of individuals, made up of entirely civilian, non-institutionalized people, aged 15 or older. In total, Gallup surveyed in 2016 more than 146,000 people by telephone or face-to-face. Gallup states that all samples are weighted to correct for unequal selection probability, nonresponse, double coverage and matched accordingly to each nation’s demographics. The confidence level on the results being a true reflection of the entire population in each country is calculated by Gallup at 95%. The interviewees are asked 3 questions: “Have you in the past month 1) donated money to an organization?; 2) volunteered time to an organization?; 3) helped a stranger, or someone they didn’t know, who needed help?.
For our study, we will only be looking at the answers for the 1st question, on the percentage of population engaging in the donation of money. Data from the last 8 years was then compiled and the following criteria was applied, to select 6 relevant countries: 1) Country is located in Europe; 2) Country is highly developed (ranks above 0.8 on the Human Development Index (United Nations Development Programme 2016)); 3) Country has a population > 1 million inhabitants. The country should be highly developed since we are looking to improve philanthropy in countries that have some equivalence to the Portuguese reality. The HDI is a composite index of life expectancy, education and per-capita income indicators, a lot of times used to compare countries. Above 0.8 in that index, countries are considered “Highly Developed” (Portugal ranked 41th globally in 2016 with 0.843). The population criteria was also added to try to keep that equivalence to Portugal, since several small countries ranked very high in our preliminary lists (e.g. Malta or Iceland). It seems, from our country reviews, there might be some correlation between smaller communities and higher trust and giving levels, especially considering some of these countries have populations equivalent to medium-size European cities (300k-400k inhabitants). To avoid even that possibility, given that this correlation cannot be yet definitively
29 excluded, those countries were removed from the current work project, though they will be added to the final Calouste Gulbenkian report.
The countries that followed the above-mentioned criteria were then ranked according to two characteristics: the high performers over the duration of the entire sample and highest growers. The high performers are all the top countries with the highest percentual average of population donating for the 8-year period considered.
High Performing Rank =∑
% 𝑝𝑜𝑝. 𝑑𝑜𝑛𝑎𝑡𝑖𝑛𝑔 𝑚𝑜𝑛𝑒𝑦
2017𝑡=2010
8
Equation 1 - High Performing Country Ranking Calculation
The highest growers are the top countries resulting from subtracting the average of the first 3 years from the average of the last 3 years of data. A 3-year average was chosen to try and level out/minimize the risk of having a high spike in the percentage of givers in the last year, which might have been caused by a wave of donations triggered itself by, for example, a one-event catastrophe (e.g. floods or large-scale fires).
High Growth Rank = ∑ % 𝑝𝑜𝑝. 𝑑𝑜𝑛𝑎𝑡𝑖𝑛𝑔 𝑚𝑜𝑛𝑒𝑦 2015
𝑡=2017
3 −
∑2012𝑡=2010% 𝑝𝑜𝑝. 𝑑𝑜𝑛𝑎𝑡𝑖𝑛𝑔 𝑚𝑜𝑛𝑒𝑦 3
Equation 2 - High Growth Country Ranking Calculation
Following the country choice, the expert selection process was initiated. The method used was a Snowball Sampling, jumpstarted by contacts suggested by Professor Miguel Alves Martins, executive director of IES-Social Business School Portugal, and Dr. Barry Hoolwerf, executive director of the European Research Network On Philanthropy (ERNOP). Several “EUFORI Report” authors where reached during those initial stages, resulting in an initial batch of experts, chosen either because they are preeminent staff members of relevant third sector organizations, or because they are academics studying this field in their home countries. Some of these experts
30 then resumed recommending others to be surveyed. In a few particular cases, when contacts went unanswered, other non-suggested experts were contacted (e.g. Iceland).
As of the 28th of December 2017, a total of 207 international experts in 28 different countries
had been reached out by email over the final two months of 2017, and a total of 50 (24,2%) agreed to participate by providing answers to our questionnaire. Another 9 experts (4,3%) declined to participate and 143 (71,5%) of our requests went unanswered. Following this, a data base of selected initiatives was created, that includes 332 suggested players or initiatives. In this enquiry, experts were specifically asked to provide examples of the best, most relevant initiatives or players in their country right now, following the NPC proposed Philanthropy Landscape Framework (Kail, Johnson, and Bowcock 2016). According to this framework, players and initiatives in the 3rd sector can be divided in the following 6 categories: Promotion
and Celebration players (includes telephone/TV campaigns, awards, etc.); Third sector players (fundraisers, NGO's, etc.); Advisory firms (banks, law firms, consultancy offices that
are also advising donors, even if this is not their core-business); Specialist advice players (entities whose entire focus is advising philanthropists, charities or donors);
Vehicles (funds, foundations, etc.); Donor education players (players fully dedicated to
research, education and networking for individuals, families, corporations, foundations and charities to give better).
After receiving expert’s feedback, a cross-analysis of the answers took place whenever more than one expert per country gave feedback. The duplicate answers were selected, followed by the players that presented complete Annual Reports. This concluded in the final selection of 6 best initiatives and players per country, that were then described, one by one. This description of initiatives follows a model adapted from the “Advancing Philanthropy in Switzerland” report (Fondation Lombard Odier 2010), that includes a brief description of goals and purposes of the
31 institution, as well as biggest successes for each player. In addition to this, the description includes, when possible:
• Stakeholders involved: number of staff members, volunteers and board members. • Financials: Expenditures with program (i.e. solely expenses with charitable causes, all
managerial and wage costs excluded), program expense percentage and total net assets. To calculate the program expense percentage, the Charity Navigator Methodology was used (see Website 9). This is percentage is a simple ratio:
Program expense percentage = 𝑃ℎ𝑖𝑙𝑎𝑛𝑡ℎ𝑟𝑜𝑝𝑖𝑐&𝐶ℎ𝑎𝑟𝑖𝑡𝑎𝑏𝑙𝑒 𝑃𝑟𝑜𝑔𝑟𝑎𝑚 𝐸𝑥𝑝𝑒𝑛𝑠𝑒𝑠 𝑇𝑜𝑡𝑎𝑙 𝐸𝑥𝑝𝑒𝑛𝑠𝑒𝑠
Equation 3 – Program Expense Percentage calculation
This description was done for one expert-selected player for each of the 6 categories, in the 6 analyzed countries, whenever in existence, resulting in a total of 34 initiatives/players described. After careful examination of both the country profiles and the recommended players and initiatives, a comparative analysis between the High Performing Countries and the High Growth Countries was conducted. This allowed us to characterize both groups and see if there were any significant distinctions between the group of countries that has already an established giving culture, and another group of countries that is quickly developing that culture.
For all purposes, the following average conversion rates were used throughout this report (as indicated by the currency conversion website “www.xe.com” for the year of 2016 – Website 8):
Table 8 - Currency exchanges used Rates for EUR 1.00
United Kingdom GBP 0.82
Norway NOK 9.83
Croatia HRK 7.54