Vol.58, n.4: pp. 494-503, July-August 2015 http://dx.doi.org/10.1590/S1516-8913201500075
ISSN 1516-8913 Printed in Brazil
BRAZILIAN ARCHIVES OF BIOLOGY AND TECHNOLOGY
A N I N T E R N A T I O N A L J O U R N A L
Anti-obesity Effects of the Administration of
Tournefortia
paniculata
Cham Extract on
Wistar
Rats Subjected to a
Hypercaloric Diet
Anderson Assaid Simão
1, Vinicius de Oliveira Ramos
1, Angelita Duarte Corrêa
1*,
Raimundo Vicente de Sousa
2and Silvana Marcussi
11Departamento de Química; Universidade Federal de Lavras; Lavras - MG – Brasil. 2Departamento de Medicina Veterinária; Universidade Federal de Lavras; Lavras - MG – Brasil
ABSTRACT
The aim of this study was to evaluate the therapeutic and toxicologic effects of the administration of the powered vegetable extract and aqueous extract of Tournefortia paniculata leaves on Wistar rats, subjected to a hypercaloric diet for 42 days. The rats were divided into five groups and were given the following treatments by gavage: T0 (control) – 1.0 mL water day-1; T1 - aqueous extract containing 14 mg phenolic compounds kg-1 rat day-1; T2 - 14 mg quercetin kg-1 rat day-1; T3 - 50 mg powered vegetable extract from T. paniculata leaves (PVE) kg-1 rat day-1 and T4 - 100 mg PVE kg-1 rat day-1. The treatments did not significantly alter the weight, but were effective in reducing liver fat, glucose and serum triglycerides. The treatment T1 reduced food consumption and lipid peroxidation. None of the treatments showed genotoxic potential. Results showed that T. paniculata leaves possessed an anti-obesity potential. However, a more detailed study of the medicinal potential and characterization of phytochemicals in this plant would be still necessary for a better understanding of its mechanisms of action, enabling future applications in the treatment of this pathology or for various therapeutic purposes.
Key words: Obesity, medicinal plants, pharmacology, antioxidants, genotoxicity
*Author for correspondence: angelita@dqi.ufla.br
INTRODUCTION
Due to the consequences caused by the obesity and its rapid spread throughout the world, it has been considered a global epidemic, with over one billion overweight adults, from which 400 million are clinically obese, from the both developed and developing countries, including Brazil (Tucci et al.
2010). Its incidence is independent of
socioeconomic factors and age, and its
consequences range from the development of debilitating diseases to death, directly affecting the quality of life of individuals.
Among the options available for the treatment of obesity, the most used ones are balanced diets,
regular physical exercises and drug treatments, ranging from lipase inhibitors to anorectics. However, due to side effects and the high cost of drugs traditionally used in the treatment of this disease, the potential of natural products for the treatment of obesity is being widely explored, and they may be a viable alternative for the future development of effective and safe anti-obesity drugs (Park et al. 2005; Mayer et al. 2009). Mixtures of phytochemicals or isolated molecules identified from the plants represent an excellent opportunity for the development of such therapeutics (Birari and Bhutani 2007).
Tournefortia paniculata Cham., traditionally
family Boraginaceae. Its origin is attributed to the Mediterranean regions and the United States, occurring widely in the tropics and subtropics (Moraes and Sousa 2007). In Brazil, its leaves are used in folk medicine as a diuretic, anti-inflammatory in the urinary tract and in the cases of nephrolithiasis (Bertolucci 2000). There are reports that the aqueous extract of T. paniculata
leaves can act in the treatment of obesity, because of its high inhibitory activity in vitro on the
enzymes α-amylase and α-glucosidase (Simão et
al. 2012). The in vitro antioxidant potential has also been observed in the aqueous extract of the
leaves (Simão et al. 2013), if demonstrated in vivo,
could be an important tool to aid in the treatment of obesity, since many diseases directly related to obesity, such as diabetes, cardiovascular diseases, hypertension, among others, may be caused or exacerbated by free radicals (Villareal et al. 2005). Simão et al. (2013) found high contents of
phenolic compounds in T. paniculata leaves
(36.19 g/100 g dry matter); such substances could provide several benefits for the treatment of obesity and other diseases, since they have an inhibitory effect on digestive enzymes, as well as
antioxidant and antiglycemic properties.
Apparently phenolic compounds present in it could be the substances responsible for the possible anti-obesity effects of these leaves. In this study, based on in vitro results, the potential therapeutic and toxicological effects of the administration of the powered vegetable extract (rich in phenolic compounds) and aqueous extract
of T. paniculata leaves were evaluated on the
metabolism of Wistar rats subjected to a
hypercaloric diet in order to determine the possible anti-obesity properties, as well as safe and effective doses for the development of therapeutic formulations from this plant.
MATERIAL AND METHODS
Obtain the powered vegetable extract and the aqueous extract of leaves Tournefortia paniculata
Fresh leaves of T. paniculata Cham (marmelinho)
were obtained from the municipal market of Belo Horizonte, Minas Gerais, Brazil in January 2011. Its sample was deposited in the ESAL Herbarium of the Biology Department of the Universidade Federal de Lavras, under registration No. 15818. The leaves were washed under running, then with
the distilled water and were placed in forced-air oven for drying at ± 35°C for 48 h. After drying, the leaves were ground in a Wiley type mill and were then passed through an 80-mesh sieve (0.2 mm) to obtain the powered vegetable extract from
T. paniculata (PVE). The PVE was added to water
in the ratio 1:25 (w/v), kept under agitation for 60 min at room temperature and then centrifuged at 10,000 x g for 10 min and the supernatant was collected and used for the analyzes.
Bioassay
Animals and experimental conditions
The experiment was developed in accordance with the ethical principles in animal experimentation, according to the Law 11.794 of October 2008, and the project was approved by the Ethics Committee on Animal Use of Universidade Federal de Lavras (UFLA - Protocol 014/11). The experiment was
conducted over 10 weeks, using 30 male Wistar
rats (Rattus norvegicus), with initial body weight of approximately 243.15 g. The animals were kept in individual cages at 21ºC, light/dark cycle of 12 h, with access to distilled water ad libitum. During the first four weeks, the rats were given a hypercaloric diet containing 46% commercial food (Biobase Bio-tec Ratos e Camundongos), 46% condensed milk and 8% corn oil (Levin et al. 1986). Diets (1.0 kg) were prepared weekly and stored in a freezer at -24°C.
At the end of four weeks consuming the hypercaloric diet, the animals were weighed, and were divided into five groups of six animals each. They were given the hypercaloric diet and the
following treatments for six weeks: T0 (control) –
1.0 mL water/day; T1 - aqueous extract containing 14 mg phenolic compounds/kg rat/day; T2
(positive antioxidant control) - 14 mg
quercetina/kg rat/day; T3 - 50 mg powered
vegetable extract from T. paniculata leaves
(PVE)/kg rat/day and T4 - 100 mg PVE/kg rat/day. Each treatment was administered daily, diluted with water, and the administration was performed by gavage, using sterilized stainless steel cannula and syringe 1.0 mL per animal same time by the same individual.
prepared at the concentrations of 20 and 40 mg/mL, respectively. For the administration of the PVE at 50 and 100 mg, its maximum solubility in water was taken into account.
The volume administered in each treatment was calculated according to the weight of each rat. Thus, a solution volume corresponding to the dose calculated according to the body weight measured on the day was administered to each animal by gavage. The same was done for the control group, to which only water was administered.
Determination of phenolic compounds
The supernatant obtained in the preparation of the aqueous extract was subjected to the determination of phenolic compounds according to the methodology proposed by the AOAC (2005). For the quantification of these phenolic compounds, 0.05 mL of the aqueous extract were transferred to a test tube, as well as 3.45 mL of distilled water, 0.25 mL of the Folin-Denis reagent, 0.5 mL of saturated sodium carbonate solution and 0.75 mL of water, forming a mixture of blue color. After 30 min, the absorbance reading was performed at 760 nm using a UV-VIS spectrophotometer (Quimis). The calibration curve was prepared from the absorbance measurements of the standard tannic acid solution (100mg/1000mL) (Sigma-Aldrich) in 0.05; 0.1; 0.2; 0.3; 0.4; 0.5; 0.6 and 0.7-mL aliquots in the test tubes. To these volumes, distilled water was added in decreasing amounts: 3.45; 3.4; 3.3; 3.2; 3.1; 3.0; 2.9 and 2.8 mL, respectively, 0.25 mL of the Folin-Denis solution, 0.5 mL of saturated sodium carbonate solution, and, at the end, 0.75 mL of water were added. After 30 min, spectrophotometer readings were taken at 760 nm.
Body weight and daily food consumption
Body weight and food consumption were recorded daily for the evaluation of the parameters weight gain and food consumption and food consumption was calculated by the difference between the offered diet and the leftovers.
End of the bioassay
At the end of the experiment, the rats were anaesthetized with thiopental sodium (1.0 g of sterile powder dissolved in 40 mL of 0.9% saline solution) intraperitoneally at a dose of 40 mg/kg. After the collection of 2.0 to 4.0 mL of blood by cardiac puncture, which caused death by exsanguination, a 15-µL aliquot was separated for
the evaluation of genotoxicity (comet assay) and the remainder of the blood was centrifuged at 2,500 x g for 10 min for the serum, which was kept under refrigeration. After euthanasia, a necropsy was also performed with the removal of internal organs (heart, liver, kidneys and pancreas) as well as liver weighing and preparation of histological slides. The liver was divided into three parts: one for the qualitative analysis of the histology, one for the determination of lipid peroxidation, and one for the determination of ether extract. After the removal of the organs, the head, legs, tail and skin were removed, followed by washing of the carcass with salt solution.
Analysis of liver lipids and carcass
The carcass, as well as part of the liver, were weighed and lyophilized until constant weight. Then, they were crushed in a mortar and subjected to lipid measurement using the Soxhlet method (AOAC 2005).
Blood laboratory analyses
The blood serum was used to determine the concentrations of glucose, total cholesterol, HDL cholesterol, triglycerides, activity of the enzymes
aspartate aminotransferase (AST), alanine
aminotransferase (ALT) and Gamma glutamyl transferase (GGT). Blood constituents were analyzed by the commercial kits (Labtest) and analyzes were carried out with the equipment Automatic Veterinary Biochemical Analyzer Thermoplate.
Lipid peroxidation
The lipid peroxidation was determined by the
formation of thiobarbituric acid reactive
substances (TBARS) according to Winterbourn et al. (1985). The livers of the animals were weighed and homogenized in a Potter tissue homogenizer in an ice bath after the addition of buffered saline in
0.1 mol/Lsodium phosphate PBS, pH 7.4; volume
vigorously, centrifuged at 900 x g for 5 min, and the fraction containing butanol was collected and used for the determination of the absorbance at 532 nm. The TBARS concentration was calculated from the standard curve of malondialdehyde - MDA (1,1,3,3 tetraethoxypropane). The results were expressed in the moles MDA/mg fresh sample.
Comet assay
The comet assay was performed according to the methodology described by Singh et al. (1988),
with some modifications. An aliquot (15 μL) of
each cell suspension containing the treatments was
mixed with 100-μL low melting point agarose
(0.5% w/v in PBS), applied to a microscope slide previously coated with normal melting point agarose solution (1% w/v in PBS), overlaid with a coverslip (24 x 60 mm) and kept at ± 4°C for 5 min, until solidification of the agarose. For each treatment/rat, two slides were prepared. Then, the coverslips were removed and slides were immersed in lysis solution (2.5 mol/L NaCl, 100 mmol/L EDTA, 10 mmol/L Tris, 1% Triton X-100, 10% DMSO; pH 10) at 4°C for 24 h.
After the lysis, slides were kept for 25 min in a freshly prepared electrophoresis solution (1 mmol/L EDTA, 300 mmol/L NaOH; pH 13.0), allowing the loosening of bonds in DNA molecules and the exposure of alkali-labile sites. The electrophoresis was conducted at 25V for 35 min. After the electrophoresis, the slides were kept in a neutralization solution (0.4 mol/L Tris; pH 7.5) for 30 min and then dried and fixed with 100% ethanol. All the procedures were performed in the dark.
Staining and analysis
The slides were stained with 45 μL propidium
iodide solution (1.0 mg/mL), overlaid with a coverslip and analyzed in an epifluorescence microscope (Nikon ECLIPSE E400) using a 200x magnification.In order to measure the damage levels in lymphocyte DNA molecules, 100 nucleoids of each slide, two slides per
treatment/rat (totaling 200 nucleoids per
treatment/rat), were counted and classified by the same evaluator using visual score patterns described by Singh et al. (1988). The cells were classified according to the size of the "tail" and the diameter of the "head" in Class 0: no damage
(damage<5%); Class 1: low damage level (5–
20%); Class 2: intermediate damage level (20–
40%); Class 3: high damage (40–85%); Class 4:
totally damaged (damage> 85%). The average frequency of damage was calculated from the sum of the percentages of damage 1, 2, 3 and 4. The arbitrary units (0-400; where 0 = no damage and 400 = 100% damage) were calculated by the equation (1 x number of nucleoids grouped in class 1) + (2 x number of nucleoids in class 2) + (3 x number of nucleoids in class 3) + (4 x number of nucleoids in class 4) as described by Collins (2004).
Histopathology
For the histopathological analyses, slides
containing cuts from the heart, liver, kidneys and pancreas of each rat were prepared. They were immersed in 10% formalin for 24 h and kept in
70% alcohol until inclusion in paraffin. Then 4-μm
cuts were made in a rotary microtome, stained
with hematoxylin-eosin, mounted on
slides/coverslips and analyzed under light
microscopy (100x magnification) for the
qualitative analysis.
Statistical analysis
The experiment was conducted in a completely randomized design. For data on weight gain, the plots were subdivided in a 5 x 7 scheme, i.e., five treatments, a seven-week experiment with six replicates. For the data on food consumption, the plots were subdivided in a 5 x 6 scheme, with five treatments, a six-week experiment with six replications. For the other analyzes, five treatments with six replicates were used and, when the analysis of variance showed significance, the comparison of means by the Scott-Knott test (P <0.05) was performed using the Sisvar program (Ferreira 2003).
RESULTS AND DISCUSSION
The content of phenolic compounds in the aqueous
extract and powered vegetable extract from T.
paniculata leaves were 16.25 and 40.62 mg 100
mg-1, respectively. Figure 1 shows the body weight
weight loss was observed in the animals (5.8%), although not statistically different.
In another study with the aqueous extract of T.
paniculata leaves, an in vitro inhibition of the
enzymes α-amylase and α-glucosidase was
observed, and this inhibitory effect was one of the possible mechanisms responsible for weight
reduction, considering lower carbohydrate
absorption (Simão et al. 2012).
Souza et al. (2012) evaluated the anti-obesity
effects of the methanol extract of Baccharis
trimera leaves, administered to Wistar rats by
gavage. They observed a reduction in the weights of the animals and suggested a possible mechanism of action based on the inhibition of
lipases and glycosidases, which were inhibited in
vitro by the methanol extract of this plant. These
results showed that medicinal plants having digestive enzyme inhibitors in their extracts, as
was the case of T. paniculata, could be useful for
limiting the absorption of fat and carbohydrates of the diet, resulting in weight loss.
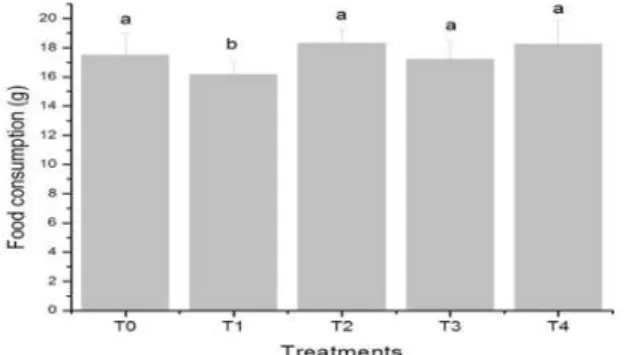
The average daily food consumption by the animals is shown in Figure 2. The treatment T1 showed a significant effect, reducing food consumption, thus was effective in reducing the appetite, which characterized an anorexigenic action by an unknown mechanism, and this inhibition could be related to the weight loss observed for this treatment (Fig. 1).
Figure 1 - Body weight of Wistar rats subjected to the treatments: T0 (control) - 1 mL water/day; T1 - aqueous extract containing 14 mg phenolic compounds/kg rat/day; T2 - 14 mg quercetina/kg rat/day; T3 - 50 mg flour from Tournefortia paniculata leaves (FTL)/kg rat/day and T4 - 100 mg FTL/kg rat/day, for six weeks. Data represent the mean of six replications ± standard deviation of the average weight for each week of experiment.
Figure 2 - Food consumption of Wistar rats subjected to the treatments: T0 (control) - 1 mL water/day; T1 – aqueous extract containing 14 mg phenolic compounds/kg rat/day; T2 - 14 mg quercetina/kg rat/day; T3 - 50 mg flour from Tournefortia paniculata leaves (FTL)/kg rat/day and T4 - 100 mg FTL/kg rat/day, for six weeks. Same letters in columns do not differ by the Scott-Knott test (P <0.05).
Table 1 shows the average weights of the livers, the liver weight/carcass weight ratio and the levels
of body and hepatic fat, with no statistical difference among the treatments for the average weights of the livers, the liver weight/carcass weight ratio and the levels of body fat. The treated groups showed levels of liver fat significantly lower than the group T0 (control), with a reduction of 18.34, 22.01, 39.32 and 34.77% for the groups T1, T2, T3 and T4, respectively.
Considering that the liver would be affected by
possible antinutritional factors present in T.
paniculata leaves, damage could reflect on
anatomical changes in the treated groups, which did not occur, thus discarding, under the conditions of this experiment, the induction of hypertrophy and hyperplasia.
T0 (control), demonstrating a higher hypoglycemic potential of the aqueous extract of
T. paniculata leaves, compared to other
treatments. This reduction could be due to the
inhibition of the enzymes α-amylase and α
-glucosidase, reducing the glucose concentration through the lower carbohydrate absorption (Simão et al. 2012), and through the lower food consumption observed for this treatment (Fig. 2).
Some authors have attributed the hypoglycemic effect of plants to the phenolic compounds present in their extracts (Figueroa-Valverde et al. 2009; Urzêda et al. 2013). Thus, these compounds,
present in T. paniculata leaves, could be
responsible for the reduction of the glucose concentration observed in the present study.
Table 1 - Average liver weight, liver weight/carcass weight, body and hepatic fat of Wistar rats subjected to treatments1 for six weeks.
Parameter T0 T1 T2 T3 T4
Liver weight (g) 7.71±1.10a 7.12±1.39a 7.79±1.01a 7.95±1.36a 8.24±0.74a Liver weight/total body weight (%) 4.49±0.85a 4.54±0.70a 4.69±0.27a 4.82±0.60a 4.99±0.40a Hepatic fat (g/100 g) 13.63±0.84a 11.13±1.39b 10.63±1.05b 8.27±0.99c 8.89±1.25c Body fat (g/100 g) 18.92±1.93a 17.24±1.61a 17.76±2.74a 17.01±1.98a 19.35±1.10a
Data are the mean of six replicates ± standard deviation. 1Treatments: T0 (control) - 1 mL water/day; T1 - aqueous extract containing 14 mg phenolic compounds/kg rat/day; T2 - 14 mg quercetina/kg rat/day; T3 - 50 mg powered vegetable extract from T. paniculata leaves (PVE)/kg rat/day and T4 - 100 mg PVE/kg rat/day. Same letters in rows do not differ by the Scott-Knott test (P <0.05).
Table 2 - Biochemical parameters of Wistar rats subjected to treatments1 for six weeks.
Parameters T0 T1 T2 T3 T4
Serum glucose (mg/dL) 165.16±17.17a 140.34±6.12b 168.08±9.34a 162.31±8.09a 177.96±6.35a Total cholesterol (mg/dL) 56.16±4.11a 55.19±5.36a 61.48±6.67a 59.63±4.26a 58.13±4.56a HDL cholesterol (mg/dL) 49.11±5.36a 43.77±2.38a 47.64±1.27a 45.11±3.91a 44.33±4.12a Triglycerides (mg/dL) 42.51±1.92a 29.23±4.00b 31.70±8.73b 34.40±3.68b 32.80±2.86b AST2 (U/L) 77.35±0.57a 80.45±4.06a 74.35±5.14a 71.58±5.88a 76.12±4.82a ALT3 (U/L) 59.74±6.32b 87.25±16.14a 63.17±7.35b 56.82±3.15b 61.49±4.85b GGT4 (U/L) 2.55±0.00a 2.48±0.07a 2.48±0.07a 2.42±0.19a 2.50±0.06a
Data are the mean of six replicates ± standard deviation. 1Treatments: T0 (control) - 1 mL water/day; T1 - aqueous extract containing 14 mg phenolic compounds/kg rat/day; T2 - 14 mg quercetina/kg rat/day; T3 - 50 mg powered vegetable extract from T. paniculata leaves (PVE)/kg rat/day and T4 - 100 mg PVE/kg rat/day, for six weeks. 2AST: aspartate aminotransferase. 3ALT: alanine aminotransferase. 4
GGT: Gamma glutamyl transferase. Same letters in rows do not differ by the Scott-Knott test (P <0.05).
The results showed that there was no statistical difference among the groups, regarding serum concentration of total cholesterol and HDL cholesterol. The treated groups did not differ statistically and triglyceride concentrations were significantly lower than group T0 (control), with a reduction of 31.24, 25.43, 19.08 and 22.85% in the concentration for the groups T1, T2, T3, and T4, respectively.
Table 2 showed that the activities of AST and GGT were statistically equal for all the groups. Regarding ALT, the treatment T1 showed an activity significantly higher than those recorded in the other groups, with an increase of 46.04% in the activity, compared to the group T0 (control). Thus, the results of ALT for the treatment T1 suggested that this treatment could cause hepatotoxic effects. The elevation in serum levels of the ALT enzyme activity caused by the treatment T1 could be
probably attributed to a hepatic dysfunction due to a hepatocyte disruption, resulting from the necrosis or changes in the permeability of the cell membrane (Kaneko 1989). Injury or destruction of hepatic cells release transaminases into the bloodstream (Motta 2009), resulting in an increase of their activity.
AST, found primarily in the mitochondria (80%), in the organs such as heart, liver, kidneys, pancreas and skeletal muscles, was not released as quickly as ALT, which was essentially hepatic and localized in the cytoplasm, thus justifying that statistical changes were recorded only for the concentrations of ALT in relation to the control group in this study. ALT is a more sensitive indicator of acute hepatotoxicity than AST (Al-Habori et al. 2002).
lipid peroxidation, which was considered an important marker of oxidative stress, and also one of the main factors involved in cell damage, caused by these radicals (Balu et al. 2005).
The results of lipid peroxidation (Fig. 3) for the treatments T1 and T2 were significantly lower than those in group T0 (control), with a reduction of 34.09 and 18.90%, respectively in the MDA concentration. Quercetin (T2) was used as a positive control, because it was a flavonoid with proven antioxidant activity (Duarte-Almeida et al.
2006, Simão et al. 2013). Through in vivo studies,
it was possible to observe that quercetin was effective in reducing the TBARS in rat livers (García-Saura et al. 2005, Yamamoto and Oue 2006), justifying its use as a reference substance.
Figure 3 - Production of Thiobarbituric acid reactive substances in the hepatic tissue of Wistar rats subjected to the treatments: T0 (control) - 1 mL water/day; T1 - aqueous extract containing 14 mg phenolic compounds/kg rat/day; T2 - 14 mg quercetina/kg rat/day; T3 - 50 mg flour from Tournefortia paniculata leaves (FTL)/kg rat/day and T4 - 100 mg FTL/kg rat/day, for six weeks. 1MDA: malondialdehyde. Data are the mean of six replicates ± standard deviation. Same letters in columns do not differ by the Scott-Knott test (P <0.05).
The treatment T1, which had phenolic compounds, could contribute, at least in part, to the antioxidant activity demonstrated in this study, since these compounds have redox properties that allowed them to act as hydrogen donor reducing agents.
Yet, the complexation of Fe+2 to phenolic
compounds could reduce the availability of this metal involved in the Fenton reaction, in the initiation and propagation of lipid peroxidation (Lima et al. 2006), which could explain the reduction in the MDA concentration by the
aqueous extract of T. paniculata leaves. For this study, the treatment T1 showed better results for the antioxidants than the phenolic pattern of quercetin, demonstrating the good antioxidant potential of this plant.
In relation to the treatments T3 (50 mg PVE/kg rat/day) and T4 (100 mg PVE/kg rat/ day), containing 20.31 and 40.62 mg phenolics, respectively, none was able to inhibit the formation of lipid peroxidation products, thus suggesting that the antioxidant substances present in this powered vegetable extract were able to exert antioxidant effects only when they were extracted and concentrated.
It would be worth emphasizing that the treatments used in this study, except for the treatment T2 (quercetin), were not subjected to any purification process for the obtention of active ingredients, i.e.,, there were only the powered vegetable extract
and the crude aqueous extract of T. paniculata
leaves, highlighting its therapeutic potential as an antioxidant and hypoglycemic, even when used without any purification process.
For the results regarding the fragmentation of DNA molecules (Table 3), there was a predominance of nucleoids with no damage (class 0), with percentage averages ranging between 43.16% (T1) and 83.05% (T0) and with low damage level (class 1), with averages between 16.32% (T0) and 52.58% (T1). It was also possible to observe (Table 3) a reduced number of nucleoids with intermediate damage levels (class 2), with percentage averages ranging between 0.00% (T4) and 5.29% (T1) and absence of nucleoids with high damage levels (class 3) and totally damaged DNA (class 4) in all the treatments.
Although the percentages of nucleoids with
damage and arbitrary units demonstrated
significant differences between the group T0 (control) and the other treatments, these values were related to the damage in class 1 (low damage level) and class 2 (intermediate damage),
demonstrating the lack of genotoxicity,
considering the six weeks of exposure to the
treatments, thus suggesting that, in the
Table 3 - Average nucleoid number per class of comet, frequency of nucleoids with damage and arbitrary units in leukocytes of Wistar rats subjected to treatments for six weeks.
Treatments2
Class of comet (%)1 Frequency of
damage3(%)
Arbitrary units4
0 1 2 3 4
T0 83.05±4.28a 16.32±3.68d 0.98±0.08b 0.00±0.00 0.00±0.00 17.30±3.87d 18.28±4.20d T1 43.16±16.53d 52.58±11.71a 5.29±1.18a 0.00±0.00 0.00±0.00 57.87±11.86a 63.16±13.56a T2 71.30±5.50b 28.40±5.11c 0.30±0.03c 0.00±0.00 0.00±0.00 28.70±5.50c 29.00±5.89c T3 59.60±5.86c 39.30±4.66b 1.13±0.24b 0.00±0.00 0.00±0.00 40.76±5.59b 41.56±5.95b T4 68.18±9.63b 31.83±9.63c 0.00±0.00b 0.00±0.00 0.00±0.00 31.83±9.63c 31.83±9.63c 1Data represent the mean values obtained in 2 slides, with 100 nucleoids analyzed in each slide, and 4 slides/treatment/rat. 30 rats were used (6 rats/treatment). 2Treatments: T0 (control) - 1 mL water/day; T1 - aqueous extract containing 14 mg phenolic compounds/kg rat/day; T2 - 14 mg quercetina/kg rat/day; T3 - 50 mg powered vegetable extract from T. paniculata leaves (PVE)/kg rat/day and T4 - 100 mg PVE/kg rat/day. 3Frequency of damage: sum of the damage of classes 1 through 4; 4Arbitrary units: (1 x damage in class 1) + (2 x damage in class 2) + (3 x damage in class 3) + (4 x damage in class 4). Same letters in columns do not differ by the Scott-Knott test (P <0.05).
In Figure 4, images of the histological sections obtained from different organs are shown. No macroscopic changes were observed in the
organs analyzed, and neither were injuries, or significant microscopic changes.
The possible accumulation of fat in the liver of the animals induced by the hypercaloric diet was not observed in the histology, as well as injuries or destruction of hepatic cells that could release transaminases into the bloodstream, causing an increase in their activity. However, the time period of the experiment might not be sufficient to reveal such damage by the optical microscopy since, for the treatment T2, there was an increase in the activity of ALT (Table 2) and, for the treated groups, a decrease in the concentration of hepatic fat in relation to the group T0 (control) (Table 1). The results obtained for T. paniculata leaves in this study showed the presence of anti-obesity and antioxidant properties, as well as lack of genotoxicity, showing the high pharmaceutical potential of this plant, which could be widely studied as a source of biomolecules or molecular
models for the development of new
pharmaceutical and/or cosmetic formulations. The results showed the prospects of further studies to determine the doses and investigate other parameters that defined the effectiveness and safety.
ACKNOWLEDGEMENTS
The authors would like to thank CAPES for the doctoral grant and FAPEMIG for their financial support.
REFERENCES
Al-Habori M, Al-Aghbari A, Al-Mamary M, Baker M. Toxicological evaluation of Catha edulis leaves: a long term feeding experiment in animals. J Ethnopharmacol. 2002; 83: 209-217.
AOAC. Official methods of analysis of the association of the analytical chemists. 17 ed. Association of Oficcial Anlytical Chemists, Washington, DC. USA. 2005.
Balu M, Sangeetha P, Haripriy AD, Panneerselvam C. Rejuvenation of antioxidant system in central nervous system of aged rats by grape seed extract. Neurosci Lett. 2005; 383: 295-300.
Bertolucci SKV, Pinto JBP, Cardoso M, Gavilanes ML, Santiago EJA, Lameira OA. Micropropagation of Tournefortiapaniculata Cham.Rev Bras Plant Med. 2000; 3: 43-49.
Birari RB, Bhutani KK. Pancreatic lipase inhibitors from natural sources: unexplored potential. Drug DiscovToday. 2007; 12: 879-889.
Collins AR. The comet assay for DNA damage and repair: principles, applications, and limitations. Mol Biotechnol. 2004; 26: 249-261.
Duarte-Almeida JM, Santos RJ, Genovese MI, Lajolo FM. Evaluation of the antioxidant activity using the b-carotene/linoleic acid system and the DPPH scavenging method. Ciênc Tecnol Aliment. 2006; 26: 446-452.
García-Saura MF, Galisteo M, Villar IC, Bermejo A, Zarzuelo A, Vargas F, et al. Effects of chronic quercetina treatment in experimental renovascular hypertension. Mol Cell Biochem. 2005; 270: 147-155. Ferreira DF. SISVAR: verão 4.6 (build 61) software. Lavras: UFLA, 2003. Available from: htpp://www.dex.ufla.br/danielff/dff02.htm.
Figueroa-Valverde L, Díaz-Cedillo F, Camacho-Luis A. 2009. Efectos inducidos por Ruta graveolens L., Cnidoscolus chayamansa McVaugh y Citrus aurantium L. sobre los niveles de glucosa, colesterol y triacilglicéridos en un modelo de rata diabética. Rev Bras Farmacogn. 2009; 19: 898-907.
Kaneko JJ. Clinical biochemistry of domestic animals. 4 ed. San Diego: Academic, 1989; 932p.
Levin BE, Triscari E, Sullivan AC. Metabolic features of diet-induced obesity without hyperphagia in young rats. Am J Physiol. 1986; 251: 433-440.
Lima AR, Barbosa VC, Santos-Filho PR, Gouvêa CMCP. In vitro evaluation of the antioxidant activity of the hydroalcoholic extract of leaves of bardana. Rev Bras Farmacogn. 2006; 16: 531-536.
Mayer MA, Hocht C, Puyo A, Taiara CA. Recent advances in obesity pharmacotherapy. Curr Clin Pharmacol. 2009; 4: 53-61.
Moraes LD, Sousa OV. Avaliações Qualitativas e Quantitativas da Variação de Metabólitos Secundários em Tournefortia paniculata Cham (Boraginaceae). Rev Bras Biociênc. 2007; 5: 1032-1034.
Motta VM. Bioquímica clínica para o laboratório: princípios e interpretações. 5 ed. Rio de Janeiro: MedBook, 2009; 400p.
Novelli ELB, Diniz YS, Galhardi CM, Ebaid GMX, Rodrigues HG, Mani F, et al. Anthropometrical parameters and markers of obesity in rats. Lab Anim. 2007; 41: 111-119.
Park MY, Lee KS, Sung MK. Effects of dietary mulberry, Korean red ginseng, and banaba on glucose homeostasis in relation to PPAR-α, PPAR-γ, and LPL mRNA expressions. Life Sci. 2005; 77: 3344-3354. Scalbert A, Johnson IT, Saltmarsh M. Polyphenols:
antioxidants and beyond. Am J Clin Nutr. 2005; 81: 215-217.
Simão AA, Lage FF, Chagas PMB, Fraguas RM, Freire JM, Marques TR, et al. Antioxidants from Medicinal Plants Used in the Treatment of Obesity. Eur J Med Plant. 2013; 3: 429-443.
Singh NP, Mccoy MT, Tice RR, Scheider EL. A simple technique for quantitation of low levels of DNA damage in individual cells. Exp Cell Res. 1988; 175: 184-191.
Souza SP, Pereira LLS, Souza AA, Souza RV, Santos CD. Study of antiobesity activity of methanolic extract of Baccharis trimera (Less.) DC. Rev Bras Farm. 2012; 93: 27-32.
Tucci SA, Boyland EJ, Halford JCG. The role of lipid and carbohydrate digestive enzyme inhibitors in the management of obesity: a review of current and emerging therapeutic agents. Diabetes Metab Syndr Obes. 2010; 3: 125-143.
Urzêda MA, Marcussi S. Pereira LLS, França SC, Pereira PS, Silva S, et al. Evaluation of the Hypoglycemic Properties of Anacardium humile Aqueous Extract. Evid Based Complement Altern Med. 2013; 8 p.
Villareal DT, Apovian CM, Kushner RF, Klein F. Obesity in older adults: technical review and position statement of the American Society for Nutrition and NAASO, The Obesity Society. Am J Clin Nutr. 2005; 13: 1849-1863.
Yamamoto Y, Oue E. Antihypertensive effect of quercetina in rats fed with a high-fat high-sucrose diet. BiosciBiotechnol Biochem. 2006; 70: 933-939. Winterbourn CC, Gutterdge JM, Halliwell B.
Doxorubicin-dependent lipid peroxidation al low partal pressures of O2. J Free Radic Biol Med. 1985;
1: 43-49.