Hygroscopic behaviour of cassava flour from dry and water groups
Comportamento higroscópico das farinhas de mandioca tipos seca e d’água
Renan Campos Chisté
IJonnahta Monteiro Cardoso
IIDiego Aires da Silva
IIIRosinelson da Silva Pena
IVISSN 0103-8478
ABSTRACT
Cassava flour from dry and water groups are important starch products widely consumed in the Amazonian region of Brazil. In this study, the moisture sorption isotherms of cassava flour from dry and water groups were obtained in the water activity (aw) range from 0.09 to 0.94 (dry group) and 0.07 to 0.93
(water group) at 25°C and the applicability of eight mathematical models in data prediction was evaluated. Both cassava flour from dry and water groups exhibited type II isotherms (sigmoid) and the hysteresis effect between adsorption and desorption isotherms was shown almost over the entire range of aw. The moisture of cassava
flour from dry and water groups should not exceed 11.3g H2O 100g-1
(aw=0.6) to ensure the theoretical microbiological stability and the
monolayer moisture value (9.0 and 7.9 g H2O 100g-1, respectively)
indicated the level of moisture content to be reached during the drying process to avoid unnecessary power consumption. Finally, the data fit showed that the mathematical model of GAB were able to predict efficiently the sorption isotherms of both cassava flour from dry and water group at the entire aw range.
Key words: Manihot esculenta, sorption isotherms, mathematical
models, starchy product, water activity.
RESUMO
As farinhas de mandioca do grupo seca e do grupo d’água são produtos amiláceos amplamente consumidos na região amazônica do Brasil. Neste estudo, as isotermas de adsorção e dessorção de umidade foram obtidas para ambos os produtos a 25°C, na faixa de atividade de água (aw) de 0,09 a 0,94 (tipo seca)
e 0,07 a 0,93 (tipo d’água). Foi avaliada a aplicabilidade de oito modelos matemáticos na predição das isotermas de sorção. Tanto a farinha tipo seca quanto a farinha tipo d’água apresentaram isotermas tipo II (sigmoide) e um efeito de histerese entre as
isotermas de adsorção e dessorção, que se estendeu em toda a faixa de aw. Para que a estabilidade microbiológica teórica seja
assegurada, a umidade em ambas as farinhas de mandioca não pode alcançar valores superiores a 11,3 g H2O 100g-1 (aw=0,6).
O valor da monocamada das farinhas seca e d’água (9,0 e 7,9 g H2O 100g-1, respectivamente) indicou que esses níveis de umidade
não devem ser atingidos durante a secagem dos produtos, para evitar gasto desnecessário de energia. Finalmente, o modelo de GAB mostrou-se altamente eficiente na predição das isotermas de sorção de ambos os produtos, em toda a faixa de aw estudada.
Palavras-chave: Manihot esculenta, isotermas de sorção,
modelos matemáticos, produto amiláceo, atividade de água.
INTRODUCTION
Cassava is the main carbohydrate source
for a significant portion of the population in Brazilian
Amazonian region, especially in Pará State, with
high economic importance to producers and small
cities mainly due to the production of cassava
flour. Cassava flour from dry and water groups are
starch products widely consumed in Amazonian
region, which is obtained after drying cassava
roots (
Manihot esculenta
Crantz). The difference
between the production of cassava flour from dry
group and cassava flour from water group is related
to the fermentation process of cassava roots for
producing the water group flour (MAPA; 2011). The
IDepartamento de Ciências Químicas, Faculdade de Farmácia, Universidade do Porto, Porto, Portugal.
IIPrograma de Pós-graduação em Ciência e Tecnologia de Alimentos, Universidade Federal do Pará (UFPA), Belém, PA, Brasil.
IIIDepartamento de Tecnologia de Alimentos, Centro de Ciências Naturais e Tecnologia, Universidade do Estado do Pará (UEPA), Belém, PA, Brasil.
IVFaculdade de Engenharia de Alimentos, Instituto de Tecnologia, UFPA, 66075-900, Belém, PA, Brasil. E-mail: [email protected]. Corresponding author.
fermentation step of roots is performed during four
days in water tanks, providing a peculiar acid taste to
the cassava flour from water group and this sensory
characteristic was reported as its main attractive
(CHISTÉ & COHEN, 2011).
The data prediction of sorption isotherms
are extremely important, since drying is the main
process to obtain different kind of flours and is the
most widely used method for the food preservation
due to the reduction of water activity (a
w). This
approach leads to the efficient modelling of drying
processes, the design and optimization of drying
equipment, the prediction of shelf-life, the moisture
changes, which may occur during storage, and also to
select appropriate packaging material (KULCHAN et
al., 2010).
The water sorption data for cassava
starch (MISHRA & RAI, 2006; PERDOMO et al.,
2009; COVA et al., 2010; SOUZA et al., 2013) and
cassava-flour-based baked product (KULCHAN
et al., 2010) were described in the literature. In
addition, this research also reported the hygroscopic
behaviour of tapioca flour (CHISTÉ et al., 2012),
another different kind of cassava product, which is
produced with starch of high purity degree extracted
from cassava roots.
Thus, considering the importance of
cassava products to people who lives in Brazilian
Amazonian region, the hygroscopic behaviour of
cassava flour from both dry and water groups at
storage temperature (25°C) will be reported here for
the first time. Furthermore, the sorption isotherms of
cassava flour were obtained and the applicability of
mathematical models in data prediction for adsorption
and desorption moisture was also evaluated.
MATERIAL AND METHODS
Samples
The cassava flour from dry and water
groups (1kg each) was acquired in bulk at the local
open-air markets in Belém, Pará, Brazil (Latitude
01°27’21’’S and Longitude 48°30’16’’W). The
samples were ground in a food processor and
homogenized. A sample of each cassava flour was
evaluated.
Proximate composition
The recommended methods of the
Association of Official Analytical Chemists (AOAC,
1997) were adopted to determine the moisture, ashes,
total lipids, total proteins (conversion factor of 5.75
from total nitrogen to total protein), reducing sugars,
total sugars and starch contents. All the experiments
of proximate composition were performed in triplicate
and expressed in g 100g
-1.
Sorption isotherms and determination of monolayer
moisture content
The hygroscopic properties of cassava
flour from dry and water groups were obtained from
the adsorption and desorption isotherms at 25°C,
according to the procedure described by SOUZA et
al. (2013). The sorption isotherms were graphically
plotted considering the moisture content versus a
wof each measurement using Microsoft Office Excel
2003 and Statistica 7.1 softwares. The monolayer
moisture content (m
o) was calculated using the BET
linear equation (Equation 1), which was applied in
the linear region of the isotherms range from 0.09 to
0.40 (dry group) and 0.07 to 0.35 (water group) of a
w.
w o o
w
w
.
a
C
.
m
)
1
C
(
C
.
m
1
m
).
a
1
(
a
=
+
−
−
(1)
where, m = moisture content (g 100g
-1dry basis -
d.b.); a
w= water activity; m
o= monolayer moisture
content (g 100g
-1d.b.); and C = constant related to the
sorption heat.
Mathematical modelling of sorption isotherms
Eight mathematical models presented
in table 1 were fitted to the isotherms by the
non-linear regression using the Statistica 7.1 software.
Mean relative deviation modulus (P) and coefficient
of determination (R
2) were used to compare the fit
precision of the sorption models and the
Levenberg-Marquardt method was used in the non-linear
regression procedure (P<0.05). The P values lower
than 10% were adopted as an indicative of a good fit
for practical purposes (PENG et al., 2007).
RESULTS AND DISCUSSION
Proximate composition of cassava flour from dry and
water groups
The cassava flour from dry and water groups
used to obtain the sorption isotherms presented starch
as the major component (76.57
±
1.72 and 68.32
±
1.68g
100g
-1, respectively, wet basis – w.b.) (Table 2). These
values were in the same range or slightly superior than
that reported for cassava flour from dry (67.67-79.59g
100g
-1) and water (61.31-66.53g 100g
-1) groups traded
about the chemical composition, all in accordance with
the previous values reported by our research group
(CHISTÉ et al., 2006; CHISTÉ et al., 2007; CHISTÉ
& COHEN, 2010; CHISTÉ & COHEN, 2011).
However, only the starch content of cassava flour from
dry group (84
±
2%, calculated in dry basis - d.b.) was
in agreement with the Brazilian law (MAPA, 2011),
that requires at least 80% of starch content and was
classified as type 2. The starch content of the cassava
flour from water group (74±2% d.b.) did not follow the
same requirements.
Sorption isotherms of cassava flour from dry and
water groups
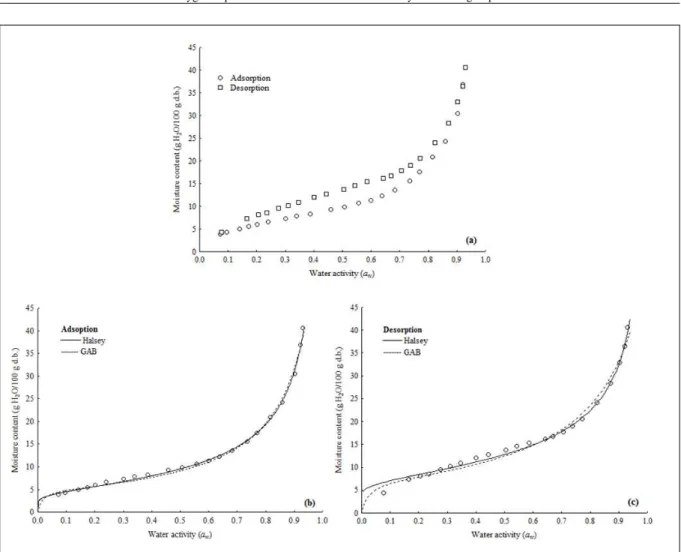
The sorption isotherms at 25°C of cassava
flour from both groups (Figure 1a and 2a) were
classified as a typical sigmoid (type II). The same
behaviour was reported for other cassava products
(MISHRA & RAI, 2006; PERDOMO et al., 2009;
CHISTÉ et al., 2012).
Considering that water molecules are
strongly bound to hydrophilic biopolymers, such as
proteins and polysaccharides, the number of sites
that strongly bind water molecules must be less in
the protein-rich substrate than in the carbohydrate
rich substrate. As a result, starchy foods, such as
cassava flour, show more Langmuir-like type II
isotherms, while the protein-rich foods indicate
more solution-like type II isotherms (YANNIOTIS
& BLAHOVEC, 2009).
Hysteresis loop between adsorption
and desorption isotherms exhibited consistent
characteristics with the type-H3 hysteresis loop,
according to IUPAC classification (SING, 1982) and
was observed almost over the entire range of a
wfor
both cassava flour (Figure 1a and 2a); whereas, a
more pronounced hysteresis effect was observed for
cassava flour from dry group. According to CAURIE
Table 1 - Mathematical models used to fit the sorption isotherms of cassava flour from dry and water groups.Models Mathematical equations Reference
Halsey b 1 w
a
ln
a
m
−
=
(CHIRIFE & IGLESIAS, 1978)Handerson b 1 w a ) a 1 ln(
m=− − (CHIRIFE & IGLESIAS, 1978)
Kuhn
b
a
ln
a
m
w+
−
=
(CHIRIFE & IGLESIAS, 1978)Mizrahi
m
b
m
a
a
w+
+
=
(CHIRIFE & IGLESIAS, 1978)Oswin b w w
a
1
a
a
m
−
=
(CHIRIFE & IGLESIAS, 1978)Smith
m
=
a
−
b
⋅
ln(
1
−
a
w)
(CHIRIFE & IGLESIAS, 1978)BET
⋅
−
⋅
−
−
⋅
+
⋅
+
−
⋅
−
⋅
⋅
=
n++1w w 1 n w n w w w o
a
c
a
)
c
1
(
1
a
n
a
)
1
n
(
1
a
1
a
c
m
m
(FIGUEIRA et al., 2004)GAB
[
(
)
(
(
)
)
]
w w w o
a
k
1
c
1
a
k
1
a
k
c
m
m
⋅
⋅
−
+
⋅
⋅
−
⋅
⋅
⋅
=
(MAROULIS et al., 1988)m = moisture content (g 100g-1 d.b.); aw = water activity; a, b, m
o, k and c terms are the parameters to be estimated by fitting.
Table 2 - Proximate composition and water activity of cassava flour from dry and water groups.
---Cassava
flour---Dry group Water group Moisture (g 100g-1)
9.17 ± 0.02 8.28 ± 0.07 Ashes (g 100g-1)
0.83 ± 0.01 0.75 ± 0.01 Total lipids (g 100g-1) 0.26 ± 0.06
1.04 ± 0.05 Total proteins (g 100g-1)
0.52 ± < 0.01 1.10 ± < 0.01 Reducing sugars (g 100g-1)
0.51 ± < 0.01 0.34 ± 0.02 Total sugars (g 100g-1)
1.10 ± 0.02 0.42 ± 0.01 Starch (g 100g-1) 76.57 ±
(2007), a decrease in the hysteresis loop or its
complete absence has been related to greater product
stability during storage.
Considering that the theoretical
microbiological stability can be ensured at a
w<0.6
(SCOTT, 1957), the moisture content of cassava flour
from dry group and from water group should not be
higher than 11.3g H
2O 100g
-1
d.b (for both products)
during storage conditions at 25°C. Similar results
were found for tapioca flour (10.1g H
2O 100g
-1
d.b.)
(CHISTÉ et al., 2012).
The desorption monolayer moisture
contents of 9.0g H
2O 100g
-1
d.b. (cassava flour
from dry group) and 7.9g H
2O 100g
-1
d.b. (cassava
flour from water group) indicated the level of
moisture contents to be reached during the drying
process to avoid unnecessary power consumption.
Since, the chemical reactions that depend on
solvation are also expected to be slow in the
monolayer region (RAO et al., 2006), the a
wof
both products is lower than 0.30 in this moisture
levels and the microbiological stability will be
highly ensured. These values were superior than
that reported for tapioca flour (4.9g H
2O 100g
-1
d.b.) (CHISTÉ et al., 2012).
Modelling of sorption isotherms
For adsorption, all the tested models
displayed suitability for predicting the isotherm for
both products (Table 3) with R
2values ranging from
0.94 to 0.99. However, the lowest P values (lower
than 10%) for cassava flour from dry group were
observed for the models of Oswin (4.5%), Halsey
(5.6%), GAB (5.7%) and Smith (8.4%), and for
cassava flour from water group, only Halsey, GAB
and BET exhibited P values lower than 10% (3.4%,
5.1% and 9.6%, respectively). These models were
also reported to be suitable to fit the adsorption
Figure 1 - Sorption isotherms (a) and Oswin and GAB models fitted to the adsorption (b) and desorption (c) isotherms of cassava flourisotherm of ten hydrophobically modified cassava
starches (COVA et al., 2010) and for tapioca flour
(CHISTÉ et al., 2012).
For desorption, all tested models were also
suitable for predicting the isotherm of both cassava
flour with R
2ranging from 0.85 to 0.99. For cassava
flour from dry group, the lowest P values were
observed for Handerson (4.8%), GAB (6.9%), Oswin
(8.2%) and BET (9.9%) and only Oswin, Halsey,
GAB and Smith models presented P values lower
than 10 % (4.9%, 5.6%, 6.7% and 7.7%, respectively)
for the water group (Table 3). All the tested models
in this study have been reported to fit the moisture
sorption behaviour of starch foods quite well (PENG
et al., 2007; CHISTÉ et al., 2012).
The models of Oswin or GAB seems to
be the best mathematical equations to perform the
simultaneous prediction of the sorption isotherms
of cassava flour from dry group (Figure 1b and c),
as well as the models of Halsey or GAB for cassava
flour from water group (Figure 2b and c). Thus, it
is strong recommend the use of GAB equation to
predict efficiently the sorption isotherms (adsorption
and desorption) for cassava flour from dry and water
groups at the entire range of tested a
w.
CONCLUSION
The hygroscopic behaviour of cassava
flour from dry and water groups at 25°C showed
that both flour presented type II isotherms and a
type-H3 hysteresis loop between adsorption and
desorption isotherms. According to the adsorption
isotherms, the moisture content of both cassava
flour should not be higher than 11.3% to ensure the
theoretical microbiological stability of the products
during storage at 25°C. Finally, GAB equation can
be highlighted to be able to predict the sorption
isotherms for both cassava flour.
ACKNOWLEDGEMENTS
The authors thank Conselho Nacional de Desenvolvimento Científico e Tecnológico (CNPq) and Fundação de Amparo à Pesquisa do Estado do Pará (FAPESPA) for the financial support.
REFERENCES
AOAC (ASSOCIATION OF OFFICIAL ANALYTICAL CHEMISTS). Official methods of analysis of the AOAC international. 16.ed. 3.Rev. Washington, 1997. 1141p. CAURIE, M. Hysteresis phenomenon in foods. International Journal of Food Science & Technology, v.42, n.1, p.45-49, 2007. Available from: <http://onlinelibrary.wiley.com/doi/10.1111/ j.1365-2621.2006.01203.x/pdf>. Accessed: Feb. 28, 2014. doi: 10.1111/j.1365-2621.2006.01203.x.
CHIRIFE, J.; IGLESIAS, H.A. Equations for fitting water sorption isotherms of foods: Part 1 - A review. International Journal of Food Science & Technology, v.13, n.3, p.159-174, 1978. Available from: <http://onlinelibrary.wiley.com/ doi/10.1111/j.1365-2621.1978.tb00792.x/pdf>. Accessed: Feb. 28, 2014. doi: 10.1111/j.1365-2621.1978.tb00792.x.
CHISTÉ, R.C.; COHEN, K.O. Physicochemical characterization of cassava flour from water group traded in the city of Belém, PA.
Revista Brasileira de Tecnologia Agroindustrial, v.4, n.1,
p.91-99, 2010. Available from: <http://revistas.utfpr.edu.br/pg/index. php/rbta/article/viewFile/452/500>. Accessed: Feb. 28, 2014. doi: 10.3895/S1981-36862010000100010.
CHISTÉ, R.C.; COHEN, K.O. Influence of fermentation on the quality of fermented cassava flour. Acta Amazonica, v.41, n.2, p.279-284, 2011. Available from: <http://www.scielo.br/pdf/aa/ v41n2/v41n2a13.pdf>. Accessed: Jun. 6, 2012. doi: 10.1590/ S0044-59672011000200013.
CHISTÉ, R.C. et al. Study of physical-chemical and microbiological properties when processing cassava flour from the water group.
Ciência e Tecnologia de Alimentos, v.27, n.2, p.265-269, 2007. Available from: <http://www.scielo.br/pdf/cta/v27n2/08.pdf>. Accessed: Jun. 6, 2012. doi: 10.1590/S0101-20612007000200009. CHISTÉ, R.C. et al. Quality of cassava flour from a dry group.
Ciência e Tecnologia de Alimentos, v.26, n.4, p.861-864, 2006. Available from: <http://www.scielo.br/pdf/cta/v26n4/22.pdf>. Accessed: Jun. 6, 2012. doi: 10.1590/S0101-20612006000400023. CHISTÉ, R.C. et al. Sorption isotherms of tapioca flour.
International Journal of Food Science & Technology, v.47, n.4, p.870-874, 2012. Available from: <http://onlinelibrary.wiley.com/ doi/10.1111/j.1365-2621.2011.02900.x/pdf>. Accessed: Mar. 21, 2012. doi: 10.1111/j.1365-2621.2011.02900.x.
COVA, A. et al. The effect of hydrophobic modifications on the adsorption isotherms of cassava starch. Carbohydrate
Polymers, v.81, n.3, p.660-667, 2010. Available from: <http:// www.sciencedirect.com/science/article/pii/S0144861710001980>. Accessed: Feb. 28, 2014. doi: 10.1016/j.carbpol.2010.03.028. FIGUEIRA, G.M. et al. Evaluation of desorption isotherms, drying rates and inulin concentration of chicory roots (Cichorium
Table 3 - Parameters of mathematical modelling of sorption isotherms of cassava flour from dry and water groups at 25°C.
---Cassava flour from dry group--- ---Cassava flour from water group---Mathematical
models Equation parameters R² P (%) Equation parameters R² P (%)
Halsey a = 36.06; b = 1.76 0.99 5.6 a = 25.65; b = 1.60 0.99 3.4
Handerson a = 0.05; b = 1.14 0.96 17.8 a = 0.07; b = 1.01 0.95 24.6
Kuhn a = 2.10; b = 5.93 0.94 21.6 a = 2.61; b = 5.36 0.98 13.9
Mizrahi a = -6.79; b = -4.68 0.94 22.8 a = -6.42; b = -3.79 0.98 15.2
Oswin a = 9.62; b = 0.48 0.99 4.5 a = 9.73; b = 0.53 0.99 11.1
Smith a = 2.21; b = 10.96 0.98 8.4 a = 1.71; b = 12.48 0.96 15.4
BET mo = 4.07; c = 24,146.07; n = 19.81 0.97 11.7 mo = 4.17; c = 3,699.70; n = 23.37 0.98 9.6
Adsorption
GAB mo = 5.06; c = 31.61; k = 0.91 0.99 5.7 mo = 4.90; c = 70.86; k = 0.94 0.99 5.1
Halsey a = 230.06; b = 2.26 0.97 14.9 a = 118.06; b = 2.02 0.99 5.6
Handerson a = 0.01; b = 1.57 0.99 4.8 a = 0.02; b = 1.37 0.96 12.8
Kuhn a = 1.95; b = 9.65 0.86 30.1 a = 2.40; b = 8.96 0.95 17.2
Mizrahi a = -10.46; b = -8.50 0.85 30.9 a = -9.97; b = -7.55 0.94 17.9
Oswin a = 13.50; b = 0.37 0.99 8.2 a = 13.10; b = 0.41 0.99 4.9
Smith a = 5.44; b = 10.93 0.98 10.7 a = 4.67; b = 12.05 0.98 7.7
BET mo = 6.86; c = 23,07; n = 9.48 0.96 9.9 mo = 5.78; c = 9,428.90; n = 13.84 0.96 12.1
Desorption
GAB mo = 9.00; c = 12.86; k = 0.79 0.98 6.9 mo = 7.22; c = 44.17; k = 0.87 0.99 6.7
intybus L.) with and without enzymatic inactivation. Journal of Food Engineering, v.63, n.3, p.273-280, 2004. Available from: <http://www.sciencedirect.com/science/article/pii/ S0260877403003091>. Accessed: Feb. 28, 2014. doi: 10.1016/j. jfoodeng.2003.06.001.
KULCHAN, R. et al. Shelf life prediction of packaged cassava-flour-based baked product by using empirical models and activation energy for water vapour permeability of polyolefin films. Journal of Food Engineering,v.100, n.3, p.461-467, 2010. Available from: <http://www.sciencedirect.com/science/article/pii/ S026087741000227X>. Accessed: Feb. 28, 2014. doi: 10.1016/j. jfoodeng.2010.04.031.
MAPA. Instrução normativa no52, de 7 de novembro de 2011. Regulamento técnico da farinha de mandioca. Diário Oficial da União, 08 nov. 2011, Seção 1, 2011. Available from: <http://www.agricultura.gov.br/legislacao/sislegis>. Acessed: Jul. 22, 2014.
MAROULIS, Z.B. et al. Application of the GAB model to the sorption isotherms for dried fruits. Journal of Food Engineering, v.7, n.1, p.63-70, 1988. Available from: <http://www.sciencedirect. com/science/article/pii/0260877488900696>. Accessed: Oct. 21, 2012. doi: 10.1016/0260-8774(88)90069-6.
MISHRA, S.; RAI, T. Morphology and functional properties of corn, potato and tapioca starches. Food Hydrocolloids, v.20, n.5, 557-566, 2006. Available from: <http://www.sciencedirect.com/ science/article/pii/S0268005X0500010X>. Accessed: Feb. 28, 2014. doi: 10.1016/j.foodhyd.2005.01.001.
PENG, G. et al. Modeling of water sorption isotherm for corn starch. Journal of Food Engineering, v.80, n.2, p.562-567, 2007. Available from: <http://www.sciencedirect.com/science/
article/pii/S0260877406004778>. Accessed: Oct. 18, 2012. doi: 10.1016/j.jfoodeng. 2006.04.063.
PERDOMO, J. et al. Glass transition temperatures and water sorption isotherms of cassava starch. Carbohydrate Polymers, v.76, n.2, p.305-313, 2009. Available from: <http://www. sciencedirect.com/science/article/pii/S0144861708004955>. Accessed: Feb. 28, 2014. doi: 10.1016/j.carbpol.2008.10.023. RAO, K.J. et al. Moisture sorption characteristics of chhana podo at 5°C and 35°C. Journal of Food Engineering, v.76, n.3, p.453-459, 2006. Available from: <http://www.sciencedirect.com/ science/article/pii/S0260877405003250>. Accessed: Feb. 28, 2014. doi: 10.1016/j.jfoodeng.2005.04.048.
SCOTT, W.J. Water relations of food spoilage microorganisms.
Advances in Food Research, v.7, p.83-127, 1957.
SING, K.S.W. Reporting physisorption data for gas/solid systems with special references to the determination of surface area and porosity. Pure and Applied Chemistry, v.54, n.11, p.2211-2218, 1982. Available from: <http://pac.iupac.org/publications/pac/ pdf/1982/pdf/5411x2201.pdf>. Accessed: Jul. 22, 2014.
SOUZA, T.C.L. et al. A rapid method to obtaining moisture sorption isotherms of a starchy product. Starch/Stärke, v.65, n.5-6, p.433-43n.5-6, 2013. Available from: <http://onlinelibrary.wiley. com/doi/10.1002/star.201200184/pdf>. Accessed: Apr. 30, 2013. doi: 10.1002/star.201200184.