This work is licensed under the Creative Commons Attribution-NonCommercial-ShareAlike 4.0 International License.
Relationship between smartphone use and sedentary
behavior: a school-based study with adolescents
Relacionamento entre smartphone e comportamento sedentário: estudo de base
escolar com adolescentes
AUTHOR’S
Camilo Luis Monteiro Lourenço1 Thiago Ferreira de Sousa2 Edmar Lacerda Mendes3
1 Universidade Federal de Santa Catarina, Programa de Pós-Graduação em Educação Física, Florianópolis, Santa Catarina, Brasil.
2 Universidade Federal do Recôncavo da Bahia, Centro de Formação de Professores, Amargosa, Bahia, Brasil.
3 Universidade Federal do Triângulo Mineiro, Departamento de Ciências do Esporte, Uberaba, Minas Gerais, Brasil.
CORRESPONDING Camilo Luis Monteiro Lourenço [email protected] Universidade Federal de Santa Catarina, Bloco Administrativo do Centro de Desportos, Trindade, Florianópolis, Santa Catarina, Brasil.
ZC: 88040-900. DOI
10.12820/rbafs.24e0076
ABSTRACT
The aims of this study were a) to describe the smartphone use and sedentary behavior (SB) on typical weekdays and weekends, and b) to verify the association between smartphone use and SB among adolescents. This is a cross-sectional population school-based, which surveyed 984 students from Uberaba, Minas Gerais, in 2015. Gender-stratified analysis were performed using t-tests, Pearson’s correlation (r) and multiple linear regression (β). Girls used more smartphones than boys (weekdays: 6.58 hrs vs. 5.29 hrs, p < 0.001; weekend: 7.81 hrs vs. 6.18 hrs, p < 0.001). Both genders used more smartphones in the weekend (p < 0.001) than weekdays. SB was higher in girls than boys (weekdays: 5.34 hrs vs. 4.48 hrs, p < 0.001, weekend: 5.22 hrs vs. 4.38 hrs, p < 0.001). SB was higher for both genders at weekend (p < 0.001) than on weekdays. Correlation between SB and smartphone use ranged from weak to moderate in both genders (weekdays: boys, r = 0.30; girls, r = 0.17, p < 0.001; weekend: boys, r = 0.39; girls, r = 0.17, p < 0.001). Smartphone use was positively associated with SB during the weekdays (boys: β = 0.25, girls: β = 0.19, p < 0.001) and weekend (boys: β = 0.31; girls: β = 0.14, p < 0.001). Girls showed greater SB and smartphone use than boys, regardless if compared on weekdays or weekend. SB and smartphone were positively associated in both genders.
Keywords: Sedentary lifestyle; Computers; Handheld; Cell phones; Health surveys.
RESUMO
Os objetivos deste estudo foram a) descrever o uso de smartphone e o comportamento sedentário (CS) em dias típicos de semana e final de semana (FDS) e, b) verificar a associação entre o uso de smartphone e o CS em adolescentes. Trata-se de um estudo transversal, com 984 escolares de Uberaba, Minas Gerais, conduzido em 2015. Para análises estratificadas por sexo, utilizou-se testes-t, correlação de Pearson (r) e regressão linear múltipla (β). Moças usavam mais o smartphone que os rapazes (semana: 6,58 vs. 5,29 horas, p < 0,001; FDS: 7,81 vs. 6,18 horas, p < 0,001). Ambos os sexos usaram mais smartphone no FDS (p < 0,001). O CS foi maior nas moças que nos rapazes (semana: 5,34 vs. 4,48 horas, p < 0,001; FDS: 5,22 vs. 4,38 horas, p < 0,001). O CS foi maior no FDS, em ambos os sexos (p < 0,001). A correlação entre CS e smartphone foi de fraca a moderada em ambos os sexos (semana: rapazes, r = 0,30; moças, r = 0,17, p < 0,001; e FDS: rapazes, r = 0,39; moças, r = 0,17, p < 0,001). Uso de smartphone foi positivamente associado com CS durante a sema-na (rapazes: β = 0,25; moças: β = 0,19, p < 0,001) e FDS (rapazes: β = 0,31; moças: β = 0,14, p < 0,001). Moças apresentaram maior CS e uso de smartphone do que rapazes, independentemente se comparados na semana ou FDS. CS e uso de smartphones foram positivamente associados em ambos os sexos.
Palavras-chave: Estilo de vida sedentário; Computadores de mão; Telefone celular; Inquéritos epidemiológicos.
Introduction
Considering both the volume of sales1 and its
tech-nological resources2, smartphones are the technology
most used every day3–6. Approximately 122 million
smartphones had been sold worldwide in 2007, and that number increased from 1.4 billion in 2015 to 1.56 billion in 20182. The growth of users is a global
phe-nomenon. However, such growth is more expressive in economically emerging countries as Malaysia, China, and Brazil1. Smartphones, also known as all-in-one
de-vices, are equipped with high-tech operating systems
(e.g., Apple iOS, Google Android, Windows Phone) and advanced features (touch screen, camera, mobile phone, applications, digital assistants, task managers, and mobile internet). Their set of features makes them attractive and multitasking.
Teenagers stand out as the largest group of smart-phone users. Approximately three-quarters of US ad-olescents have a cell phone, and almost half of these are smartphone-type mobile devices3. Among Asian
adolescents, the prevalence of smartphone ownership was 40.6% in China, 55.7% in Hong Kong, 56.7% in
Malaysia, 63.8% in Japan, 67.2% in the Philippines and 84.4% in South Korea4. A national survey showed
that 54%, 81% and 87% of Brazilian adolescents, aged 10 to 14, 15 to 17 and 18 or 19 years old, respectively, had a mobile phone for personal use in 2015. The pro-portion of ownership varied among students from pri-vate (94%), and public schools (67%)5. This age group
also spends more time using smartphones. Hungarian teenagers were reported to spend an average of 4.48 hours per day using smartphones, and boys use less (3.4 hours) than girls (5.3 hours)6.
As a part of sedentary lifestyle, the sedentary be-havior (SB), that is, any waking bebe-havior characterized by an energy expenditure ≤ 1.5 metabolic equivalents (METs), while in a sitting, reclining or lying position7
is considered a risk factor for the adolescents’ health. SB has been associated with poor eating habits8, overweight
and obesity9, increased cardiovascular and
cardiomet-abolic risks in adolescents10, and risk of mortality in
adulthood11. TV viewing, videogame and computer use,
also known as screen time, is the most common way of SB assessment12,13. However, this operational definition
can represent only part of the daily sedentary time14.
Moreover, this usual parameter neglects the possibility of sedentary time in other screen activities. To illustrate this, a systematic review update15 of SB and health
in-dicators in children and youth included search terms related to portable devices. In the review, Carson et al.15
assumed that young people use the technologies while they remain seated as when they say “[…] the present review included search terms to capture newer tech-nologies, such as tablets and smartphones. […] Porta-ble devices, including cell phones, were included in the review under the assumption that children and youth primarily used these devices while seated”. However, few studies included in the review used mobile devices as a measure of SB, perhaps because it is believed that youth may not be primarily seated when using these devices. In contrast, this relationship has already been explored among adults16. The authors16 showed that cell
phone use was associated with SB and that 81% of peo-ple use the cell phone while sitting or lying down.
As shown, smartphones are available, fashionable and highly used, especially among youth1-6. Also,
stud-ies on SB almost exclusively consider TV viewing and computer and/or video game use as measures of sed-entarism12,13. Up to the moment, no study investigated
the association between smartphone use and SB among Brazilian adolescents. Thus, following these gaps, this
cross-sectional population-based study with school students had the aims: a) describe the smartphone use and SB and b) to verify the association between smart-phone use and SB among adolescents.
Methods
The Assessment of Health Behavior and Lifestyle of Adolescents in Uberaba (ACtVU Study) was a cross--sectional school population-based study, including pri-vate and public schools to evaluate SB and associated factors in adolescents. The study was carried out bet-ween May and October of 2015. The city of Uberaba, Minas Gerais, Brazil, has 4,533.81 km² and a popula-tion density of 65.29 inhabitants/km². The city has a high human development index (0.772 – 14th in the state and 240th in the country), a Gini index of 0.50, per capita income of R$ 978.01 and life expectancy of 75.7 years at birth17. We follow the STROBE Statement18 to
report this paper (see supplementary material A). Sample size was calculated considering: survey population (N = 10,903), SB prevalence (P = 50%), 95% confidence level, acceptable sampling error (5%), two-point effects design (deff = 2) and addition of 20% and 10% for losses/refusals and confounding analyses, respectively. The estimated sample size was 979 adoles-cents – this sample size was calculated for the ACtVU Study project using Epi Info™ 7. A post hoc tests re-vealed that the sample size achieved for the multiple regression models in this study reached values between 0.99 and 1.00 power (G*Power 3.1.9.2, parameters: F test; R² = 0.084 to 0.162; effect size f² = 0.091 to 0.193; sample size = 440 [boys] and 554 [girls]; n predictors = 5; α = 0.05). The selection process adopted was a two-stage proportional conglomerate. In the first two-stage, 15 schools (public = 9, private = 6, out of 36 eligible) were drawn. In the second stage, 50 classes were randomly selected (out of 362 eligible). Eligibility criteria for this study included adolescents aged 14 to 18 years with valid data for all interest variables.
We use two previously validated questionnaires19,20.
The Portable Technologies and Mobile Internet Ques-tionnaire (Tecno-Q) was used to asses smartphone use. The Tecno-Q reproducibility test-retest showed Kappa values ranging from 0.77 to 1.00 and intraclass correla-tion coefficient ranging from 0.94 to 0.9819. The
Behav-ior of Adolescents from Santa Catarina state Question-naire (COMPAC) was used to assess SB. Test-retest reproducibility for the COMPAC Questionnaire ranged from 0.51 to 0.9620. Body mass index (BMI)
was calculated as weight (kg)/height (m)² and then classified as low weight/eutrophic and overweight/obe-sity21. A stadiometer (WCS®, Wood Portable Compact,
capacity 220 cm, graduation 1 mm) and a digital scale (Wiso®, w939, capacity 180 kg) were used in these measurements. A trained team of physical education students and teachers carried out all data collection.
Adolescents were asked about ownership (yes or not) and the type of cell phone (smartphone or other). Smartphone use was ascertained through the question: “How much time per day do you spend accessing the internet through the mobile phone?”. “Access to the in-ternet” was considered as the forms of access via wire-less network (e.g. Wi-Fi™, mobile internet - 3G/4G modem etc.) for any use like check email, social net-works (e.g. Facebook, Instagram etc.), online chatting, watching videos, listening to music and playing online. The access was considered only by the adolescent him-self. SB was estimated by the sitting time, using the following question: “How much time do you spend sitting, talking to friends, playing cards or dominoes, talking on the phone, driving or as a passenger, read-ing or studyread-ing?”. Adolescents were asked to disregard the time watching TV, using a computer and/or vid-eo game and playing games on the smartphone when responding to this question. Both questions were an-swered for a typical weekday (Monday to Friday) and weekend (Saturday or Sunday). The variables were as-sessed and analyzed in hours per day.
The covariates were age (full years), school type (public or private), school grade (first, second or third grade) and screen time (TV viewing and computer use). We selected these covariates to adjust for possible demographic, school characteristics and other seden-tary screen activities that could act as confounding fac-tors in the sample.
Descriptive characteristics including frequencies, means, standard deviations (±), and 95% confidence intervals (95%CI) were calculated for the total sample and school type groups. The Kolmogorov-Smirnov test was used to test the normality of the data. Independ-ent and dependIndepend-ent t-tests were used to compare means in continuous variables between gender and between weekdays and weekend days, respectively. Independent t-test was also used to compare time using smartphone and SB throughout the study sample. The Levene’s test for equality of variance was used in the independent t-test. The chi-squared test (χ2) was used to test the
differences in the categorical variables.
Pearson correlation (r) was used to test the corre-lation between smartphone use and sitting time (both in hours/day). The r scores were interpreted22 as weak
correlation (r = 0.10-0.29), moderate (r = 0.30-0.49) and substantial (r = 0.50-1.00). Simple and multiple linear regression models, adjusted for covariates, were constructed to quantify the angular coefficients (β) be-tween smartphone use and SB (both in hours/day). The β coefficient represents how much the mean of Y (SB) change for an increase of one unit of variable X (smart-phone). The adjusted models were tested for multicol-linearity using the Variance Inflation Factor (VIF) and the tolerance (1/VIF). VIF < 10 and 1/VIF > 0.10 were considered acceptable diagnostic values23. The
normal-ity of the residuals was verified using the single sample Kolmogorov-Smirnov test (D). The cross-validation of the models was verified by the adjusted R² (R²a).
All analyses used recommended survey procedures and sample weighting to account for the clustered sampling design and to yield school population-based representative findings. We found inconsistent values for smartphone use and SB. Therefore, the data were cleaned and the analyses were adjusted to the average self-reported daily sleep time on weekdays (boys = 429.5 min/day; girls = 429.9 min/day) and weekend (boys = 521.0 min/day; girls = 514.6 min/day) in our sample24. The inferential analyzes are shown separated
by gender and weekdays (weekdays and weekend). Re-sults were considered statistically significant if p < 0.05. The Epidata Entry (http://www.epidata.dk/) was used for double typing and data validation. The SPSS soft-ware version 21 (IBM® SPSS® Inc., Chicago, USA) was used to carry out the analyses.
The Secretariat of Education of the State of Minas Gerais and the Regional Superintendence of Educa-tion of Uberaba authorized this study. The local re-search ethics committee approved the protocol (num-ber 994,772), and informed consent was obtained from all participants. The ACtVU Study was conducted fol-lowing the Declaration of Helsinki.
Results
A total of 1,363 adolescents were invited to participate, 295 do not consent/assent to participate, and 84 were outside the age group or were missing data (BMI, n = 67 - for descriptive analysis). The final sample con-sisted of 984 participants, for the main analyses. The mean age was 15.93 ± 1.13 and 15.87 ± 1.06 years for boys and girls, respectively. Girls corresponded to
55.6% of the sample. The characteristics of the partici-pants (gender, age group and BMI) are reported for the total sample and for school types (Table 1).
Nine out of ten adolescents (95.8%) responded by owning a cell phone and almost all were smartphone (95,3%). Overall and gender-stratified smartphone use and SB are shown in Table 2. The independent t-test showed significant differences between boys and girls in smartphone use for both weekdays (p < 0.001) and weekends (p < 0.001). There were significant differenc-es between weekdays and weekends among boys (p < 0.001) and girls (p < 0.001). As for SB, there was a sig-nificant difference between boys and girls during both weekdays (p < 0.001) and weekends (p < 0.001). Both genders showed differences in SB between weekdays and weekends (p < 0.001). Time using smartphone was superior to the sitting time both on weekdays and weekend days (p < 0.001) - Table 2.
The overall correlation between SB and
smart-phone use was weak and positive (weekdays: r = 0.24, p < 0.001; weekend: r = 0.28, p < 0.001). In boys, there was a weak positive correlation between smartphone use and SB in weekdays (r = 0.30, p < 0.001) and a moderate positive correlation in weekends (r = 0.39, p < 0.001). In girls, weak positive correlations were iden-tified in both weekdays (r = 0.17, p < 0.001) and week-ends (r = 0.17, p < 0.001).
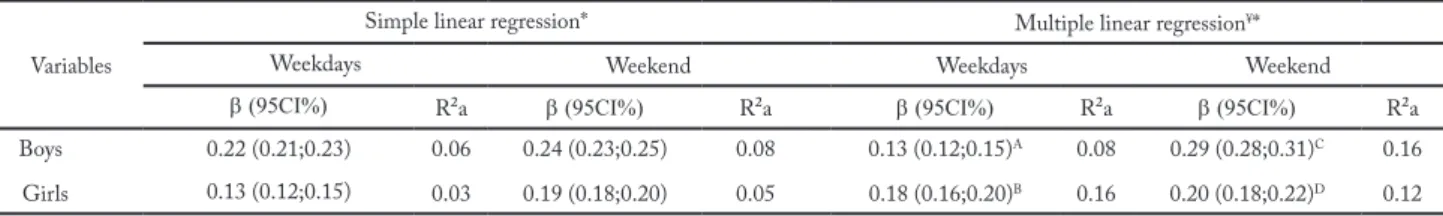
Table 3 shows simple and multiple linear regression models. All adjusted linear regression models were sig-nificant (p < 0.001). In all models, a change of one unit in the time of smartphone use was positively associat-ed with the change in SB. All adjustassociat-ed regression mod-els presented acceptable values for diagnostic statistics. Cross-validation values were low for all models (Table 3).
Discussion
This study described the use of smartphone and SB among adolescents and verified the relationship
bet-Table 1 – Sample characteristics, overall and stratified by school type. ACtVU Study 2015. Uberaba, Minas Gerais.
Variables All Public Private χ2
n % (95%CI) n % (95%CI) n % (95%CI)
Genders 0.011 Boys 440 44.4 (39.6;49.2) 373 47.2 (42.1;52.4) 67 34.2 (28.0;40.9) Girls 544 55.6 (50.8;60.4) 413 52.8 (47.6;57.9) 131 65.8 (59.1;72.0) Age <0.001 14 to 16 years 697 67.8 (54.4;78.9) 533 65.5 (50.2;78.2) 164 83.0 (62.8;93.4) 17 to 18 years 287 32.2 (21.1;45.6) 253 34.5 (21.8;49.8) 34 17.0 (6.6;37.2) BMIϣ 0.423 Low weight/eutrophic 692 74.5 (69.9;78.6) 553 74.7 (69.7;79.2) 139 72.0 (65.9;77.3) Overweight/obesity 225 25.5 (21.4;30.1) 170 25.3 (20.8;30.3) 55 28.0 (22.7;34.1)
95%CI = 95% confidence interval; BMI = body mass index; ϣ = 67 missing data.
Table 2 – Overall and gender-stratified smartphone use and sedentary behavior. ACtVU Study 2015. Uberaba, Minas Gerais.
Variables Weekdays Weekend Dependentt-test p
Mean SD Mean SD
Smartphone use (hours)
All 6.62† ± 4.41 7.25† ± 4.42
Boys 5.29 ± 3.95 6.18 ± 4.25 −32.054 <0.001
Girls 6.58§ ± 3.90 7.81§ ± 4.31 −45.390 <0.001
Sedentary behavior (hours)
All 5.11† ± 4.04 4.94† ± 3.95
Boys 4.48 ± 3.64 4.38 ± 3.51 3.759 <0.001
Girls 5.34§ ± 4.03 5.22§ ± 4.11 4.364 <0.001
SD = standard deviation; Symbol (§) indicates significant independent t-test (boys vs. girls, all comparisons p < 0.001); Levene’s test = smartphone use - weekdays (F = 20.194, p < 0.001), weekend (F = 1.137, p = 0.242); sedentary behavior - weekdays (F = 273.245, p < 0.001) weekend (F = 694.655, p < 0.001); Symbol (†) indicates significant independent t-test (smartphone use vs. sedentary behavior, for “All sample”, all comparisons p < 0.001); Levene’s test = weekdays (F = 1,279.3, p < 0.001), weekend (F = 1,800.0, p < 0.001).
ween these two variables. The main findings of the current study were that SB and smartphone use time differed between boys and girls, during weekdays and weekend days. There were positive correlations, ranging from weak to moderate magnitudes, between smartpho-ne use time and SB in adolescents. Finally, the multiple linear regression models confirmed the contribution of smartphone use time to sitting time in our sample.
In the present study, girls spent more time sit-ting than boys on weekdays. In a previous study with North-American adolescents, girls also spent more time sitting than boys for most of the comparisons (total time, race/ethnicity [non-Hispanic whites, non-Hispanic blacks, and Mexican-Americans], and body mass status [obese and non-obese])25. Specialists
have considered high sitting time as a public health problem, especially among adolescents. High sitting time is associated with poor eating habits8, overweight
and obesity9 and higher cardiovascular and
cardio-metabolic risk10. The definition of SB7, as known and
used today, makes a wide range of daily activities to be classified as SB, even in a single postural position such as the sitting position, as adopted in this study. In the present study, some examples were used to illus-trate the “sitting” position (e.g., playing cards or dom-inoes, talking on the phone, driving or travelling as a passenger, reading or studying). The mention of these activities in a single question is a factor that limits a more detailed identification of the differences in the SB pattern between the genders.
A systematic review of Brazilian studies12 pointed
out that sitting time, apart from screen activities, had not been investigated among the 49 studies included. In the National Health and Nutrition Examination Survey (NHANES)25, conducted with American
ado-lescents (median of 15.5 years old), the average sitting
time was 7.5 hours per day, higher than our results. Also similar to the present study, the NHANES found that girls spent a long time in sitting position com-pared to boys. However, unlike the present study, the analyses in the NHANES considered sedentary activ-ities in front of screens (TV or computer) as sitting time and did not stratify the results between weekdays and weekend days. Being sedentary is related to oth-er behaviors8 and negative outcomes9,10 for the health
of young people. In adults and the elderly, prolonged sitting time was associated with increased risk of all-cause mortality and cardiometabolic diseases11, thus
indicating the need to reduce opportunities to remain seated, especially in discretionary time, in early phases of life (i.e., childhood and adolescence).
Adolescents in the present study reported spend-ing a considerable portion of time usspend-ing smartphones. Our results were higher than those observed in a study with Hungarian adolescents26, in which girls also spent
more time using smartphones than boys. Our results showed that the time using technology was higher on the weekend than on weekdays among boys and girls. Previous research reported that American boys and girls are always online, smartphones are facilitators, and the two groups have distinct profiles as to the pur-pose of using technology: girls use more social media and boys most often play games26. The present study
was limited to investigating only the profile of time spent using smartphones, restricting the analysis and discussion of results regarding the difference between genders in the use of technology.
The positive correlations between sitting and time using smartphones presented in this study reinforce that time spent using smartphones must be taken into account in investigations on SB in adolescents. Fur-thermore, considering that access and popularity of
Table 3 – Simple and multiple linear regression models of smartphone use and sedentary behavior. ACtVU Study 2015. Uberaba, Minas Gerais.
Variables
Simple linear regression* Multiple linear regression¥*
Weekdays Weekend Weekdays Weekend
β (95CI%) R²a β (95CI%) R²a β (95CI%) R²a β (95CI%) R²a
Boys 0.22 (0.21;0.23) 0.06 0.24 (0.23;0.25) 0.08 0.13 (0.12;0.15)A 0.08 0.29 (0.28;0.31)C 0.16
Girls 0.13 (0.12;0.15) 0.03 0.19 (0.18;0.20) 0.05 0.18 (0.16;0.20)B 0.16 0.20 (0.18;0.22)D 0.12
Β = angular regression coefficient; ¥ = multiple regression model adjusted to age (completed years), school type (public and private), school grade (1st, 2nd and 3rd) and screen time (TV viewing and computer use); R²a = adjusted R²; *All regression models presented p < 0.001 (single and multiple); Upper case letters (A, B, C, D) indicate multiple linear regression models. Model diagnostics (range of values): Age: VIF
= 1.0 to 1.8 (models B and D, respectively), 1/FIV = 0.6 to 1.0 (models D and B, respectively); School type: VIF = 1.0 to 1.2 (models A and B, respectively), 1/FIV = 0.9 to 1.0 (models B and A, respectively); School grade: VIF = 1.4 to 1.9 (models A and D, respectively), 1/FIV = 0.5 to 0.9 (models B and A, respectively); Screen time: VIF = 1.0 to 1.1 (models C and A, respectively), 1/FIV = 0.9 to 1.0 (models A and C, respectively); Normality of residuals: D = 5.5 to 10.7 (models D and A, respectively, all models p < 0.001).
screen-based technologies have increased among the pediatric population, as pointed out by Tremblay et al.14, future research on SB should focus on the use of
media. It is necessary to consider the portable devic-es (e.g., smartphondevic-es) that can cause an increasingly common phenomenon: multitasking sedentarism15.
According to these authors, young people can be in front of the TV, use the telephone (smartphone) and the computer at the same time. Thus, considering the expansion of commercialization of new media tech-nologies such as smartphones especially among young people, future research should focus on investigating the impact of the time spent using these devices on SB.
In the present study, the multiple linear regressions show that time using smartphones was associated with SB among boys and girls. The substantial amount of time spent by adolescents with smartphone use iden-tified in this study, especially on weekends, represents a worrying finding because the opportunity to remain seated would tend to rise. Fennel et al.16 also explored
the relationship between cell phone use and SB. In an online survey, 81% of the adults (40 ± 16 years old) interviewed responded using their cell phone while sit-ting or lying down, contrassit-ting with 8% who reported that this typically occurs while standing and 11% re-ported using their cell phone while walking or moving about. In addition, cell phone use was significantly and positively associated with SB (β = 0.157, p = 0.002). While there has been an increasing effort to reduce the opportunities for younger people to remain seated27,
especially in recreational time, smartphones appear to be against to this goal. Most intervention strategies to reduce SB include efforts to restrict the screen time - television viewing, computer and/or video game avail-able in rooms used by young people27. Although some
success has been found to derive from the adoption of these strategies, future interventions may not be suc-cessful if they disregard the influence of portable devic-es on SB, according to our rdevic-esults. Also, the attraction of young people to smartphones should also be consid-ered, as it has been demonstrated that younger people (15-16 years old) are more likely to exhibit dependence on smartphones than young adults (≥ 19 years old)28.
To clarify some of the issues raised and not an-swered in this study, some directions are pointed out. Future studies should advance research on smartphone use and sedentary lifestyle, especially to elucidate the differences between genders and content and context of the use of portable devices. The following questions
can be tested in the future studies: what type of media do adolescents consume on their smartphones? Does the media type influence SB? Do students remain in SB and using smartphones during school recess? Fi-nally, as must have occurred with Fennel et al.16 (since
they used a structured question similar to ours), our question about sitting time included “talking on the phone” as an example of sedentary activity, which can lead to misclassification. To deal with this, the question needs to be improved and longitudinal research studies (experimental or observational) can use objective (e.g., Microsoft SenseCam) or mixed methods (e.g., objec-tive + interviews) to answer some that questions and best investigate adolescent behavior to identify and analyze the context of SB and the use of technologies.
This study has some limitations. First, the use of questionnaires to measure the variables of interest – SB and time using smartphones – which may under-estimate or overunder-estimate the measures. For instance, a systematic review14 showed that studies using direct
(i.e. accelerometers) measures found that young people spent a large portion of their day (up to 9 hours) being sedentary – higher than shown in our study. However, although the results of SB may be underestimated in our study, we emphasize that the SB that we investigated excluded screen time, that is, we evaluated only part of the sedentary time of adolescents – and the low values may be due to this. Moreover, the instruments used in this study had satisfactory psychometric validation in-dexes19,20. Second, as this is a observational study,
causal-ity can not be confirmed for use of smartphone and SB. Third, the low values of cross-validation of the multiple regression models indicate that caution is needed in what concerns the generalization of the results. Fourth, the situational use of smartphone (e.g., sitting, standing, or moving about)16 was not evaluated in our study. Thus,
we failed to confirm the findings of Fennel et al.16 and
Barkley & Lepp29 when they showed that adults use cell
phones primarily while they are sitting (at 81% and 87% of the time, respectively). Additionally, since the time using smartphone was longer than the sedentary time in our sample, using the smartphone can be a sedentary activity but it is not exclusive to that. The strong points of this study were the short intervals of data collection, which minimize the behavioral bias of seasonality; the novelty in revealing that smartphone use is a predictor of SB; the sample that represented well the community of school adolescents according to schools types (public and private) in the municipality studied.
In conclusion, girls showed greater SB and smart-phone use than boys, regardless if compared on week-days or weekend. SB and smartphone were positively associated in both genders.
Conflict of interest
The authors declare no conflict of interest.
Acknowledgments
To the Secretariat of Education of the State of Minas Gerais and the Regional Superintendence of Education of Uberaba. To the managers, teachers and adolescents of the participating schools. To the members of the collection team and the Núcleo de Estudos em Atividade Física & Saúde (NEAFISA) of the Universidade Federal do Triângulo Mineiro. CLML received an M.Sc. scholarship (2014 to 2016) from Coordenação de Aperfei-çoamento de Pessoal de Nível Superior (CAPES).
Author’s contributions
Lourenço CLM e Mendes EL, participated in the initial design and conduction of the ACtVU Study. All authors equally contri-buted to the design, analyses and interpretation of results, writing and critical review of this study.
References
1. Poushter J. Smartphone ownership and internet usage
continues to climb in emerging economies. Pew Research Center’s Global Attitudes Project. 2016. [citado em 2019 ago 19]. Disponível em: http://www.pewglobal.org/2016/02/22/ smartphone-ownership-and-internet-usage-continues-to-climb-in-emerging-economies/.
2. The Statistics Portal. Statistics and facts about Smartphones
[online]. Statista. 2019. [citado em 2019 ago 19]. Disponível em: http://www.statista.com/topics/840/smartphones/.
3. Madden M, Lenhart A, Duggan M, Cortesi S, Gasser
U. Teens and Technology 2013 [online]. Pew Research Center’s Internet & American Life Project. 2013. [citado em 2019 ago 19]. Disponível em: http://www.pewinternet. org/2013/03/13/teens-and-technology-2013/.
4. Mak KK, Lai CM, Watanabe H, Kim DI, Bahar N, Ramos
M, et al. Epidemiology of internet behaviors and addiction among adolescents in six Asian countries. Cyberpsychol Behav Soc Netw. 2014;17(11):720–8.
5. IBGE. Acesso à internet e à televisão e posse de telefone
móvel celular para uso pessoal: 2015 [online]. Rio de Janeiro: IBGE; 2016. [citado em 2019 ago 19]. 87 p. Disponível em: https://biblioteca.ibge.gov.br/visualizacao/livros/liv99054.pdf.
6. Körmendi A. Smartphone usage among adolescents.
Psychiatr Hung. 2015;30(3):297–302.
7. Tremblay MS, Aubert S, Barnes JD, Saunders TJ, Carson V,
Latimer-Cheung AE, et al. Sedentary Behavior Research Network (SBRN) - Terminology consensus project process and outcome. Int J Behav Nutr Phys Act. 2017;14(1):75.
8. Lourenço CLM, Zanetti HR, Amorim PRS, Mota JAPS,
Mendes EL. Comportamento sedentário em adolescentes: prevalência e fatores associados. R Bras Ci e Mov. 2018;26(3):23-32.
9. Silva Júnior LM, Santos AP, Souza OF, Farias ES. Prevalence
of excess weight and associated factors in adolescents of private schools of an Amazonic urban area, Brazil. Rev Paul Pediatr. 2012;30(2):217–22.
10. Sisson SB, Shay CM, Camhi SM, Short KR, Whited T.
Sitting and cardiometabolic risk factors in U.S. adolescents. J Allied Health. 2013;42(4):236–42.
11. Chau JY, Grunseit A, Midthjell K, Holmen J, Holmen TL,
Bauman AE, et al. Sedentary behaviour and risk of mortality from all-causes and cardiometabolic diseases in adults: evidence from the HUNT3 population cohort. Br J Sports Med. 2015;49(11):737–42.
12. Guerra PH, Farias Júnior JC, Florindo AA. Comportamento
sedentário em crianças e adolescentes brasileiros: revisão sistemática. Rev Saude Publica. 2016;50:9.
13. Okely AD, Salmon J, Vella S, Cliff D, Timperio A, Tremblay
MS, et al. A systematic review to update the Australian physical activity guidelines for children and young people [online]. Report prepared for the Australian Government Department of Health. 2012. [citado em 2019 ago 19]. Disponível em: https://www.health.gov.au/internet/main/publishing.nsf/ ontent/3768EA4DC0BF11D0CA257BF0001ED77E /$File/SR-ASBGCYP.pdf.
14. Tremblay MS, LeBlanc AG, Kho ME, Saunders TJ, Larouche
R, Colley RC, et al. Systematic review of sedentary behaviour and health indicators in school-aged children and youth. Int J Behav Nutr Phys Act. 2011;8:98.
15. Carson V, Hunter S, Kuzik N, Gray CE, Poitras VJ, Chaput
JP, et al. Systematic review of sedentary behaviour and health indicators in school-aged children and youth: an update. Appl Physiol Nutr Metab. 2016;41(6 Suppl 3):S240-65.
16. Fennell C, Barkley JE, Lepp A. The relationship between cell
phone use, physical activity, and sedentary behavior in adults aged 18–80. Comput Hum Behav. 2019;90:53–9.
17. PNUD, IPEA, FJP. Atlas do Desenvolvimento Humano no
Brasil [online]. 2013. [citado em 2019 ago 19]. Disponível em: http://www.atlasbrasil.org.br/2013/pt/
18. von Elm E, Altman DG, Egger M, Pocock SJ, Gøtzsche
PC, Vandenbroucke JP. The Strengthening the Reporting of Observational Studies in Epidemiology (STROBE) Statement: Guidelines for Reporting Observational Studies. PLoS Med. 2007;4(10):e296.
19. Lourenço CLM, Hélio Junior J, Zanetti HR, Mendes EL.
Validade e reprodutibilidade de um questionário sobre uso de tecnologias portáteis e internet móvel em adolescentes brasileiros. Rev Tecnol Soc (Online). 2019. No prelo.
20. Silva KS, Lopes ADS, Hoefelmann LP, Cabral LGA,
Bem MFL, Barros MVG, et al. Projeto COMPAC (Comportamentos dos Adolescentes Catarinenses): aspectos metodológicos, operacionais e éticos. Rev Bras Cineantropom Desempenho Hum. 2013;15(1):1–15.
21. Cole TJ, Bellizzi MC, Flegal KM, Dietz WH. Establishing a
standard definition for child overweight and obesity worldwide: international survey. BMJ. 2000;320(7244):1240-3.
22. Cohen J. Statistical power analysis for the behavioral sciences.
2ª ed. Hillsdale, NJ: Lawrence Erlbaum Associates; 1988. 596 p.
23. Bowerman BL, O’Connell RT. Linear Statistical Models: An
Applied Approach. 2ª ed. Boston: PWS-Kent Pub. Co; 1990. 1024 p.
24. Van den Broeck J, Argeseanu CS, Eeckels R, Herbst K.
Data cleaning: detecting, diagnosing, and editing data abnormalities. PLoS Med. 2005;2(10):e267.
Quote this article as:
Lourenço CLM, Sousa TF, Mendes EL. Relationship between smartphone use and sedentary behavior: a school-based study with adolescents. Rev Bras Ati Fis Saúde. 2019;24:e0078. DOI: 10.12820/rbafs.24e0078
25. Carson V, Staiano AE, Katzmarzyk PT. Physical activity,
screen time, and sitting among US Adolescents. Pediatr Exerc Sci. 2015;27(1):151–9.
26. Lenhart A. Teens, Social Media & Technology Overview
2015 [online]. Pew Research Center: Internet, Science & Tech. 2015. [citado em 2019 ago. 19]. Disponível em: http:// www.pewinternet.org/2015/04/09/teens-social-media-technology-2015/.
27. Marsh S, Foley LS, Wilks DC, Maddison R.
Family-based interventions for reducing sedentary time in youth: a systematic review of randomized controlled trials. Obes Rev. 2014;15(2):117–33.
28. Haug S, Castro RP, Kwon M, Filler A, Kowatsch T, Schaub
MP. Smartphone use and smartphone addiction among young people in Switzerland. J Behav Addict. 2015;4(4):299–307.
29. Barkley JE, Lepp A. Mobile phone use among college
students is a sedentary leisure behavior which may interfere with exercise. Comput Hum Behav. 2016;56:29–33.
Received: 30/04/2019 Approved: 26/09/2019