School of Social and Human Sciences
Department of Social and Organizational Psychology
Effect of ethnic composition of primary schools on academic
achievement, cross-ethnic friendships, discrimination and school
well-being
Érica Carolina Gonçalves Andrade
Dissertation submitted as partial requirement for the conferral of
Master in Community Psychology and Child Protection
Supervisor:
Doctor Maria Benedicta Monteiro, Senior Full Professor, ISCTE - Lisbon Institute University
Eff ec t o f eth n ic c o m p o siti o n o f p rim ar y s ch o o ls o n ac ad em ic ac h ieve m ent , cr o ss -eth n ic frie n d sh ip s, d is cr iminat io n an d sc h o o l w ell -b ein g Ér ic a Car o lin a G o n çalv es A n d rad e Sept em b er 2 01 5
i
Acknowledgements
Firstly, I would like to express my sincere gratitude to my supervisor, Teacher and Doctor Maria Benedicta Monteiro, for all her support, enthusiasm and patience throughout the last year.
I would like to thank all the head teachers and teachers whom allowed me to carry out this study, and to the students whom participated, as without them this would not have been possible.
I would like to thank Joana, for her availability, help, encouragement and positivity.
I would like to give a special thank you to my parents, sisters and brother for their love, encouragement and patience, and for always believing in me.
I would also like to thank my family, specifically, my grandmother, my aunties, my uncles and my cousins whom always checked up on me, comforted me and gave me words of support when I needed them most.
I would like to thank Jesus for the affection, support and patience along this process and for always believing in my capacities.
I would like to thank Tania for her friendship and encouragement, we shared this experience together, spending endless hours in the library and study room, her support and company was essential.
I would also like to thank my friends, my course friends, for their encouragement and my close friends, even though miles away, they were always close.
iii Resumo
O presente estudo teve como objetivo investigar os efeitos da composição étnica de escolas públicas de 1º ciclo com crianças Brancas e Negras no desempenho académico, no bem-estar na escola, nas amizades interétnicas e na discriminação intergrupal, de modo a contribuir com mais conhecimento nesta área controversa e com reduzido número de estudos nacionais. Os participantes foram 102 alunos de 4° ano (M idade = 9.82, 49% do género masculino), incluindo crianças Brancas (n = 48) e Negras de Países Africanos de Língua Oficial Portuguesa
(n = 54). As composições étnicas das escolas foram de 10% a 30%, 31% a 59% e 60% ou mais de crianças da minoria.
Verificou-se que, em geral, as crianças Brancas têm melhor sucesso académico em todas as disciplinas, mas tanto Brancas como Negras têm pior sucesso em Matemática e no Estudo do Meio quando a composição é de 60% ou mais, em comparação com os seus pares nas restantes condições. Apenas quando a composição étnica da escola é equilibrada (31% a 59%) as crianças Brancas e Negras têm o mesmo número de amizades interétnicas. As crianças Negras avaliam as crianças Brancas mais negativamente do que as Brancas, quando a composição étnicas é de 60% ou mais. O bem-estar na escola é mais alto em crianças Brancas do que em crianças Negras, independentemente da composição étnica da escola.
Os resultados são discutidos no âmbito das políticas públicas de Educação para as escolas de primeiro ciclo em Portugal, de forma a proporcionar uma maior igualdade de oportunidades de sucesso e de bem-estar entre a minoria e a maioria.
Palavras-Chave: composição étnica de escolas, desempenho escolar, amizades interétnicas, discriminação, bem-estar na escola
3020 Group & Interpersonal Processes 3550 Academic Learning & Achievement
v Abstract
The aim of this study was to investigate the effects of primary schools’ ethnic composition on academic achievement, school well-being, cross-ethnic friendships and discrimination, with the purpose of adding knowledge to this controversial research area in which national research is limited. Participants were students from the 4th grade (M age = 9.82, 49%), White natives (n = 48) and Black immigrants from Portuguese-speaking African countries (n = 54). The school ethnic compositions were of 10% to 30%, 31% to 59% and 60% or more of children from minority groups.
Results found that White students performed better in all subjects, but both White and Black students performed worse in Mathematics and Social Environmental studies when in the 60% or more minority condition, in comparison to their peers in the other conditions. When the school ethnic composition was more balanced (31% to 59%) both native and immigrant children have the same number of cross-ethnic friendships. For discriminative behaviours, Black children rated White children more negatively than Black children when in the school ethnic composition of 60% or more. School well-being was higher for White native students than for Black immigrants, regardless of the schools’ ethnic composition.
Results were discussed as a potential contribute to the design of public policies of Education for Portuguese primary schools, in order to provide greater equality of opportunities for success and well being between minority and the majority students.
Keywords: school ethnic composition, academic achievement, cross-ethnic friendships, discrimination, school well-being
3020 Group & Interpersonal Processes 3550 Academic Learning & Achievement
vii Contents
Introduction ... 1
Chapter I - State of art ………... 5
1.1 – School ethnic composition ... 5
1.2 – School ethnic composition and academic achievement ... 6
1.3 – School ethnic composition and cross-ethnic friendships ... 8
1.4 – School ethnic composition and intergroup prejudice/discrimination ... 10
1.5 – School ethnic composition and school well-being ... 12
1.6 – Objectives and hypotheses ... 14
Chapter II – Method ... 15
2.1 – Design ... 15
2.2 – Participants ... 15
2.3 – Procedure ... 16
2.4 – Instrument and measures ... 17
2.5 – Data analysis ... 19
Chapter III – Results ... 21
3.1 – Descriptive statistics and bivariate correlations ... 21
3.2 – Control of participant’s gender variable ... 24
3.3 – Effects of school ethnic composition and the ethnicity of the participants ... 25
3.3.1 – Academic achievement ... 25
3.3.2 – Cross-ethnic friendships ... 29
3.3.3 – Intergroup discrimination ... 31
3.3.4 – School well-being ... 38
Chapter IV – Discussion and conclusion ... 41
References ... 47
viii
Contents of Appendices
Appendix A: Letter for schools requesting collaboration ... 55
Appendix B: Document of characterization of school ... 56
Appendix C: Letter of consent for parents/carers ... 58
Appendix D: Girls’ questionnaire ... 59
Appendix E: Boys’ questionnaire ... 64
Appendix F: Girls’ questionnaire in Portuguese ... 69
Appendix G: Activities task ... 74
Appendix H: Tables of means and SD for internal (school) grades ... 78
Appendix I: Tables of means and SD for external (national) grades ... 79
Appendix J: Table of means and SD of negative traits on attribution task ... 80
Appendix K: Frequency and expected frequencies tables for Interpretation of situation ... 81
Appendix L: Frequency and expected frequencies tables of friend preference ... 83
Appendix M: Research review tables ... 85
Contents of tables Table 2.1: Descriptive statistics of participants according to school ethnic composition ... 15
Table 2.2: Descriptive statistics of participants according to school, ethnicity and gender ... 16
Table 3.1: Descriptive statistics of the dependent variables in the study ... 21
Table 3.2: Bivariate correlations between the variables in the study ... 23
Table 3.3: T-Tests on the effect of gender on the dependent variables ... 24
Table 3.4: Chi-square tests on the effect of gender on the dependent variables ... 25
Table 3.5: Means and SD of the final Portuguese grades according to school ethnic composition and participant’s ethnicity ... 26
Table 3.6: Means and SD of the final Mathematics grades according to school ethnic composition and participant’s ethnicity ... 27
Table 3.7: Means and SD of the Final Social Environmental studies grades according to school ethnic composition and participant’s ethnicity ... 28
Table 3.8: Mean and SD of cross-ethnic friendships by school ethnic composition and participant’s ethnicity ... 30
Table 3.9: Means and SD of positive traits according to school ethnic composition and participant’s ethnicity ... 32
Table 3.10: ANOVA for the evaluation of the goodness/badness of the potential transgressor’s action ... 34
ix
Table 3.11: Means and SD of goodness/badness of the potential transgressor’s action
according to school ethnic composition and participant’s ethnicity ... 35 Table 3.12: ANOVA for whether participants considered the two children perceived
interethnic friendship ... 36 Table 3.13: Means and SD of perceived cross-ethnic friendship according to school ethnic composition and participant’s ethnicity ... 37 Table 3:14: Factorial Structure of the indicators of school well-being ... 38 Table 3:15: Means and SD of school well-being – social support, according to school ethnic composition and participant’s ethnicity ... 39
Contents of figures
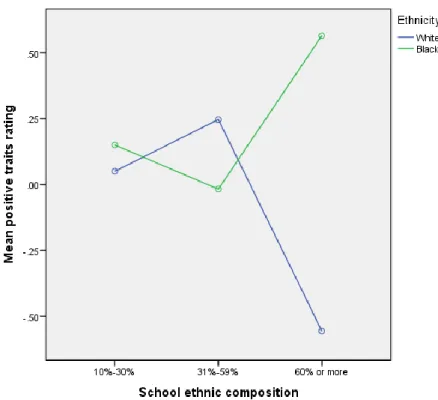
Figure 3.1: Interaction between the school ethnic composition and participant’s ethnicity on the cross-ethnic friendships ... 31 Figure 3.2: Interaction between the school’s ethnic composition and participant’s ethnicity on positive traits attribution ...33
1
Introduction
The European Union (EU) has now an estimated population of 508.2 million (Eurostat, 2015a) of which 33.5 million were born outside of the EU and 17.9 million were living in a different EU Member state than the one where they were born (Eurostat, 2015b)1. In 2014 Black Africans living in Portugal form Portuguese-speaking African countries (namely Angola, Cape Verde, Guinea-Bissau, Mozambique, Sao Tome and Principe and Equatorial Guinea) represented almost 24% of the 395 195 immigrant population in Portugal (SEF, 2015).
In Portugal during the academic year of 2012/2013, 2,025,462 people were registered in the educational system (pre-school, primary, secondary and higher education), ages ranging from three to over 50. Ninety five thousand and seventeen were students with foreign Nationalities, where 33% (31,007) were Black Africans from Portuguese-speaking African countries. In relation to primary education, in Portuguese, Ensino Básico2, there were 1,031,026 enrolments, of which 42,239 were of foreign Nationalities, of which 28% were Black Africans from Portuguese-speaking African countries (DGEEC & DSEE, 2014). It’s important to note however, that not all of Black Africans in education in Portugal are represented among these figures, as the younger generations now have Portuguese
Nationalities. Nonetheless, in Portugal no public official figures are available regarding the ethnicity of students in the education system.
The ethnicity problem in Education was first formally addressed in the USA when the Supreme Court decided on the Brown vs. Board of Education (1954), which stated illegal the laws that separated Black and White students in public schools. This was first proposed to the Supreme Court in 1952, as people from the Black community asked for desegregation so they could have the right of entry to public schools in their communities. Yet it was only in 1954 that the division by race was acknowledged as unfair and desegregation of public schools began in 1955 (LII, n.d). A few years later the Civil Rights Act (1964) again prohibited in USA racial discrimination in voting, in public accommodation, in public facilities and education and in employment, among other purposes. Nevertheless, decades after those legal decisions, it seems there is still no consensus among Social Sciences researchers on the benefits of desegregation (Baysu, Phalet & Brown, 2014). Additionally, research 40 years
1
Figures obtained on the 1/01/2014. 2
2
later suggests that schools in the USA remain very much segregated: White students are in schools where students are mostly White too and Black students are in schools with 50% or more of minority groups students (Gamoran & Long, 2006). In Europe, according to Baysu et al. (2014, p. 328), immigrants’ integration, as well as “the alleged benefits or risks of ethnic diversity in today’s classes and schools continue to cause controversy”.
The integration of all citizens has been promoted by the European Commission. One strategy has been the development of Multiannual Programmes, modified and revised every five years. The programme now in operation is the Strategic Guidelines for the area of Freedom, Security and Justice, which will run from 2014 to 2019 (European Commission, 2015). The European Commission’s Communication in 2014 stated the following:
“Europe is a diverse society where integration remains a challenge. To enhance social cohesion and to reap the full benefits of migration, commitment to effective
integration of migrants in the labour market and receiving societies should be strengthened. (…) Vulnerable migrants, in particular women, young migrants and unaccompanied minors should receive targeted support and a ‘best interest of the child’ approach should be practically applied in accordance with the UN Convention on the Rights of the Child. Building on previous work in the field of integration, successful policies could be identified and best practices disseminated. Further work will be necessary on capacity building and on engaging with local and regional
authorities, which are at the forefront of integration policies.” (European Commission, 2014, p. 4)
The legislation in Portugal is currently on its second plan of integration of Immigrants, II
Plano de Integração para imigrantes (Resolução do Conselho de Ministros nº74/2010). The
plan contains several measures in order to ensure immigrants in Portugal have opportunities to develop their abilities (e.g., Portuguese language), and programmes to decrease racial discrimination and improve the integration of immigrants in employment, in education, in social services, in health system, in habitation among other areas. One important measure to highlight is in education, as the creation of balanced ethnic classes needs to be guaranteed and monitored, as recommended by the Ministry of Education, assuring the balance in ethnic composition (measure 24, p. 4100). Still regarding this measure the first plan in 2007 stated that the criteria of admissions in schools needed reviewing, as students were distributed among the schools closest geographically and suggested to head teachers the necessity of ethnically balanced classes (Resolução do Conselho de Ministros n.º 63-A/2007, measure 32,
3
p. 2964-(6)). The Constitutional law in Portugal has stated that everyone has the right to an education which guarantees the right to equal opportunities in admittance and educational success (Lei Constitucional n° 1/2005, article n°74, p. 4654).
Although the law prohibits discrimination and enforces schools to guarantee equal opportunities to all children, natives and immigrants, there are still indications that students from immigrant origins and low socioeconomic status continue to be treated unequally in multiple areas of social life, especially in the education area. The recent edition of the report from the Programme for International Student Assessment 2012 (PISA) assessed around 510,000 students aged 15 years in 65 countries, in Mathematics, Reading and Science3. In general 15 year old immigrant or from immigrant descent students’ scored much lower on Mathematics than non-immigrants, even when taking into account their social-economic status. In addition, the programme found that the gap between immigrant and non-immigrant students’ Mathematics achievement displayed a narrowing effect between 2002 to 2012, but the difference was still very significant (OECD, 2013a). Moreover, on average across OECD countries4, 14% of the differences in student Reading performance within each country were associated with differences in students’ socio-economic background.
In relation to Portugal5 (ProjAVI, 2013), the PISA report found that students were at the global average for Mathematics for the first time since the beginning of the programme in 2000. However they were unable to reach the OECD countries average (494 points), as they scored 487 points. Reading scores were also below OECD average (496 points), as students scored 488 points; and regarding Science, students scored 489 points (OECD average is 501 points). The tendency of Portuguese students from 2000-2012 showed results have improved in all three areas of assessment, but scores from 2009-2012 do not differ greatly, suggesting a stability and congruency.
3
The PISA consists of evaluating students’ ability in order to compare the evaluation of 15 year old students over time and to assess the impact education policies and practices across the globe. Tests normally lasted 2 hours, questions were open-ended and multiple choice (OCED, 2014).
4
OCED countries are: Australia, Austria, Belgium, Canada, Chile, Czech Republic, Denmark, Estonia, Finland, France, Germany, Greece, Hungary, Iceland, Ireland, Israel, Italy, Japan, Korea, Luxembourg, Mexico, Netherlands, New Zealand, Norway, Poland, Portugal, Slovak Republic, Slovenia, Spain, Sweden, Switzerland, Turkey, United Kingdom and United States.
5
Portugal participated in all PISA cycles to date - 2000, 2003, 2006, 2009 and 2012. In 2015 were sampled, to represent Portugal, 7,151 students from 195 school clusters / non-grouped schools distributed throughout the country (ProjAVI, 2013).
4
The Ministry of Education in Portugal does not provide information regarding academic achievement of native and immigrant students separately; therefore it is not possible to evaluate the differences among students in public school, namely in primary schools. This study aims to contribute to further explore this educational area by analysing the academic achievement of a sample of native and immigrant children in Lisbon, specifically immigrants of African origin. It also aims to expand our knowledge on the effect of the primary schools’ ethnic composition on children’s academic achievement, cross-ethnic friendships, intergroup discrimination and school well-being. This research is relevant to extend our knowledge about education in Portugal, as only minimal research exists in social and educational psychology addressing the issues of the role of schools’ ethnic composition on important dimensions of children’s school life. It is also of great importance to address education policies regarding equality rights of native and immigrant Portuguese students are being guaranteed in order to foster equal opportunities for educational success.
The structure of the dissertation is as follows. Chapter I explores some of the existing literature on the dependent variable and what has been found regarding the effect of the school ethnic composition. Chapter II describes the method of the study, namely the design, participants, procedure, instrument and measure. Followed by chapter III which explores the results and lastly, chapter IV, which describes the findings of the study, the implications to public policies and the limitations.
5
I. State of the art 1.1 School ethnic composition
The ethnicity of students in a school or classroom has been measured in two forms: ethnic diversity and ethnic composition. The numbers of different ethnic groups in a school and/or classroom were referred to as the ethnic diversity of the school, while the percentage of students from the minority and majority ethnic groups in classes and/or schools were referred to as the ethnic composition. Different terms were used across research to characterise the composition of schools/classrooms: homogeneous vs. heterogeneous (e.g., McGlothlin and colleagues, 2005; 2006), school racial composition (e.g., Brown-Jeffy, 2009); school ethnic composition (e.g., Jugert, Noack & Rutland, 2011); school ethnic diversity (e.g., Thijs & Verkuyten, 2014).
For the purpose of this study the term used was ‘school ethnic composition’ and the school composition was defined, according to most studies, with three groups: 10%-30%, 31%-59% and more than 60% of ethnic minorities (e.g., McGlothlin, Killen & Edmonds, 2005; Bagci, Kumashiro, Smith, Blumberg & Rutland, 2014).
As early as the 1930’s research studied the effects of the school’s ethnic composition on racial attitudes of white children (Horowitz, 1936 cited by Dovidio, Gaertner & Kawakami, 2003). Until today school ethnic composition has been studied worldwide, exploring the different effects it has on children in majority and minority across numerous areas. Research has shown it is an important factor to consider. For example, Belgium immigrant children have higher aspirations to finish school when the school ethnic composition of immigrant students was 50.6%-88.2%, and this same ethnic composition also resulted in higher
aspirations to pursue higher education for both immigrant and native children (Van Houtte & Stevens, 2010). Also in the Netherlands, a longitudinal study (Hornstra, van der Veen, Peetsma & Volman, 2015) with students from 3rd to 6th grade (9 to 12 years) found task orientation and sense of classroom belonging increased when students were in classes with more than 50% of ethnic minorities, but only for minority students (Turkish, Moroccan and western backgrounds).
This study will explore the effects of school ethnic composition on academic achievement, cross-ethnic friendships, discrimination and well-being in school.
6
1.2 School ethnic composition and academic achievement
Achievement means doing something successfully with skill, effort, or courage, while academic is related to education (Oxford Dictionaries, n.d), therefore academic achievement is being successful in education. Academic Achievement can be measured as competition of compulsory education and/or higher education and as an ongoing process during the academic years. Academic achievement is important as high mathematics achievers forecast positive outcomes for young adults, such as continuing into further education and better salaries (OECD, 2013b).
As explained previously by the PISA 2012, the academic achievement gap between native and immigrant students remains very significant. Brown-Jeffy (2009) researched the achievement gap among adolescents in America, finding that Black and Hispanics had lower grades than Whites and Asians. Furthermore, the gap between Black and Hispanic students was significantly smaller in schools’ where these ethnic groups make 30%-49% of the ethnic composition.
Various factors can affect academic achievement. Up until the Coleman Report
(Coleman et al., 1966, cited by Gamoran et al., 2006) the common belief was that children of minority groups had worse academic achievement due to poor school resources. However Coleman and colleagues found that academic achievement was strongly affected by the SES of the families of the students and not so much school characteristics. Recent research (Brown-Jeffy, 2009; Ryabov, 2011) suggested that the strongest influence on achievement was SES, minority/low SES adolescents had lower mathematics achievement. On the other hand, Hornstra et al., (2015) found the SES to not have an effect, as achievement did not decrease when students of the majority or middle and high SES were in classrooms with students from minority or of low SES. Furthermore the PISA 2012 found no difference in student’s academic achievement whether they attend a homogeneous or heterogeneous school after taking into account the SES of the student and school (OECD, 2013a).
Academic achievement has been affected by other factors, i.e. students with single-parent or guardian families had worse academic achievement than those with households with two parents (OECD, 2013a, Ryabov, 2011) and the geographical location of the school, as students whom attended schools in towns had better academic achievement than those whom studied in rural areas (OECD, 2013a). In addition, Baysu et al., (2014), found the school ethnic composition had an effect on academic success for Turkish minorities (from Austria
7
and Belgium, aged 18-35). However, after taking into account experienced discrimination and cross-ethnic friendships there was no longer an effect. School ethnic composition, SES of the school and peer networks also affected academic achievement significantly (Goza & Ryabov, 2009).
The effect of the ethnic composition of the school or classroom on academic
achievement has been studied for many years, results were diverse and benefits for students of majority and minority groups varied. A meta-regression analysis of schools from kinder garden to 12th grade showed that Mathematics achievement was lower in homogeneous schools (Mickelson, Bottia & Lambert, 2013).
Longitudinal research studied the difference between students’ achievement from 3rd to 6th grade (9 to 12 years old), they found that for minority students (Turkish, Moroccan and western background) being in classes of 50% or more of minority meant lower mathematics grades in 3rd and 6th grade. Nevertheless, reading comprehension was higher for minorities in classes with 50% or more of minority students (Hornstra et al., 2015). Another longitudinal study in primary schools (aged 6 to 12 years) in Belgium found in general Mathematics achievement was lower in classrooms where there were more minority students (Turkish, Maghreb, Western and Eastern European, among others), yet Reading achievement was better in classes which were composed by more minority students. Minority children’s achievement for Reading Comprehension, Reading fluency and Spelling was lower than the majority group, the Dutch. It’s important to note that at the first measurement of Language achievement, being in a school with more minority students meant worse Language achievement. However, the ethnic composition of the school did not have an effect on the improvement of Language achievement. In the final measurement, grades did not differ significantly (Belfi, Goos, Pinxten, Verhaeghe, Gielen, de Fraine & Van Damme, 2014). In the Netherlands, Driessen (2002) also found that when the minority (Turkish, Moroccan, Surinamese, Antillean or other) represented 50% of the composition and parents had low education level, Language and Mathematics achievement was lower. For students of 4th grade (aged 9 to 10 years) more diversity in schools meant lower language and maths achievement for 4th grades, however when the composition of the school was taken into account the effect disappeared. In general, this study found that regardless of the ethnic background, all students had a worse performance in schools with other 50% of minorities.
8
In summary, previous research suggested the school ethnic composition had an effect on academic achievement. However research results are controversial and thus it is important to understand which compositions can generate children’s best achievement in order to enable equal opportunities for all students.
1.3 School ethnic composition and cross-ethnic friendships
Friendships between two people from different ethnic backgrounds have been named differently among research: interethnic friendships (e.g., Van Houtte & Stevens, 2009); cross-race friendships (e.g., Aboud, Mendelson & Purdy, 2003; Killen et al., 2010; Rude & Herda, 2010); cross-ethnic friendship (e. g., Feddes, Noack & Rutland, 2009; Jugert et al., 2011); out-group friendship (Schroeder & Risen, 2014).
Over the years research has focused on the effects of contact/interaction between children from different ethnic backgrounds and the effects of cross-ethnic friendships. Cross-ethnic friendships are important for the formation of positive attitudes towards members of other groups (Pettigrew, 1998). Consequently, this results in less negative attitudes towards other groups (Pettigrew, & Tropp, 2006; Tropp & Prenovost, 2008). Pettigrew’s (1998) findings have been found in camps among rival Israeli and Palestinian teenagers, as those whom had a cross-ethnic friendship had more positive feelings towards members of the other group (Schroeder et al., 2014).
Cross-ethnic friendships have been considered to be less common than same-ethnic friendships (Aboud et al., 2003), however the opposite has been found among children in London (Bagci, Kumashiro, Smith, Blumberg & Rutland, 2014). In this study, White European, Middle Eastern, Black and South Asian students (aged 11 years) reported more cross-ethnic friendships than same-ethnic friendships. However, research in the Netherlands (Vervoort, Scholte & Scheepers, 2011) suggested cross-ethnic friendships are more common for the minority group members (non-western, from Turkey, Morocco, Suriname, the
Netherlands Antilles or Aruba) than for majority group (from the Netherlands, Dutch). Yet, in Germany cross-ethnic friendships of children were as common for the majority (Germans) as for minority (Turkish) groups (Feddes et al., 2009). In addition, longitudinal research in Germany between the same groups found children at the beginning of the academic year preferred same-ethnic friendships, but this preference decreased by the end of the year (Jugert et al., 2011).
9
Longitudinal research during the academic year (in Canada and Germany) suggested children’s cross-ethnic friendships were less stable over time, as at the end of the academic year they reported less cross-ethnic friendships (Aboud et al., 2003; Feddes et al., 2009). Research with American adolescents also reported cross-ethnic friendships were less stable regardless of the school ethnic composition and similarity between peers (Rude et al., 2010). School is an important place for cross-ethnic relationships as in the USA they were more frequent in schools than in neighbourhood (Killen et al., 2010). But in order for cross-ethnic friendships to last longer, there needs to be a relationship outside the school building for American adolescents (Rude et al., 2010). Longitudinal research has shown that positive intergroup attitudes at the beginning of the academic year predicted more cross ethnic
friendships at the end of the year (Jugert et al., 2011). However, Thijs et al., (2014) argued in their annual review that the school ethnic composition is not enough, having named the following factors to be also important: multicultural education, student-teacher relationships, role of parents and peers outside school, peer norms and networks and inclusive school identities.
Cross-ethnic friendships among pupils have been researched among the different school ethnic compositions around the world. A study in London, among 11 year olds found children of the majority (White European) had more cross-ethnic friends than minority groups (Middle Eastern, Black and South Asian) when classroom ethnic diversity was lower. It was also found that students of the majority reported more cross-ethnic friendships than same-ethnic friendships (Bagci et al., 2014). Research in Germany studied friendships between majority (German) and minority (Turkish) children (mean age of 10.4 years) longitudinally, during the academic year in an ethnic diverse school, they found that initially children preferred same ethnic friendships, but by the end of the year this preference had decreased. The decrease occurred as children eventually began to choose friendships with children whom participated in the same activities, regardless of ethnicity (Jugert et al., 2011).
For this particular study, the children studied will be fourth grade pupils, where the children are mostly nine years old, as this age is crucial to the formation of interpersonal friendships (Aboud, 1988; Aboud & Amato, 2001). Research by McGlothlin and colleagues in the USA has investigated friendship potential in childhood. One study found European-American children (in 1st and 4th grade, M = 6.8 and 9.9 years) did not rate potential friendship between a black and white children differently regardless of the school ethnic composition; one school has 65% of European-American and the other 30%. However, the
10
fourth graders viewed cross-ethnic friendships as less likely (McGlothlin et al., 2005). A similar study, but in homogeneous schools (European-Americans represented 86.1% and 91.2% of the school population) found once more that fourth graders considered cross-ethnic friendships as less possible (McGlothlin et al., 2006). Another study investigated the cross-ethnic friendship potential of first and fourth graders of African-American’s and Non-African minorities (Latin-American, Asian-American and others) in schools with an ethnic
composition of 20-71% of European-Americans. To find that minority groups did not evaluate cross-ethnic friendships differently (Margie et al., 2005).
While other studies have obtained information regarding how many cross-ethnic friendships children have, Killen et al. (2010) found that European-American children (4th, 7th and 10th grades) in schools with 25% to 52% of minority groups (in this case, Black and Hispanics) reported more cross-ethnic friendships than those in schools with 15% or less. Wilson et al., (2011) found African-American children (third and fourth graders) had more same-ethnic friendships and peer groups than European-American children, having found segregation stronger in classrooms with less African-American students (classroom ethnic composition of African-American students varied from 8% to 78.6%).
In summary cross-group friendships have been found to play an important role in favouring positive intergroup contact and attitudes toward minority group members, both in adults (Pettigrew, 1997) and in children and youngsters (e. g., Aboud et al., 2003; Feddes et al., 2009) in multi-ethnic school contexts (e. g., Vervoort et al., 2011). However, few studies have explored both majority and minority children friendships within variable school ethnic compositions. In this study, we also address that issue.
1.4 School ethnic composition and intergroup prejudice/discrimination
Prejudice has been described by Allport (1954) as: “Ethnic prejudice is an antipathy based upon faulty and inflexible generalization. It may be felt or expressed. It may be directed toward a group as a whole, or toward an individual because he is a member of that group” (p.9). A more recent definition stated prejudice as “the holding of derogatory social attitudes or cognitive beliefs, the expression of negative affect, or the display of hostile or
discriminatory behaviour towards members of a group on account of their membership of that group” (Brown, 1999, p.8). While discrimination is defined as a behaviour: “Treating some people favourably or unfavourably on the basis of arbitrary criteria, such as ethnicity, gender, “race”, political ideology, religion” (Corsini, 1999, p.284).
11
In relation to the development of prejudice in children, children aged six to ten showed a preference for their ingroup (Anglo-Australian) than the outgroup (Pacific Islander) (Nesdale, Durkin, Maas & Griffiths, 2005). A meta-analytic review (Raabe and Beelmann, 2011) revealed that prejudice towards Black and other ethnic outgroups (or lower class status outgroups) increased between the ages of 2 to 4 to 5 to 7 years. Subsequently there seemed to be a decline in prejudice towards these outgroups between the ages of 5 to 7 and 8 to 10 years, however, prejudice for Whites (or higher class status outgroups) increased during this age period. In addition, they also found that opportunities of contact, whether small or large, decreased prejudice between children aged 2 to 4 vs. 5 to 7 and the outcome is even stronger between children aged 5 to 7 vs. 8 to 10.
Research into how bias could be reduced by intergroup contact began as early as in the 1930’s (Zeligs & Hendrickson, 1933 cited by Dovidio et al., 2003) however it was in 1954 that Allport published his prominent version of the Contact Hypothesis. Allport (1954) proposed that having more intergroup contact reduced prejudice, developing a series of conditions, which would create an optimal intergroup contact: equal status within the
situation; intergroup cooperation; common goals and support of authorities, law, or customs. However, recent research suggested a fifth condition: friendship potential (Pettigrew,
1997/1998). Over the past years research has strengthen this hypothesis, intergroup prejudice was declined by intergroup contact (Dovidio, Gaertner & Kawakami, 2003; Pettigrew, 1998; Pettigrew & Tropp, 2000).
It’s important to gain knowledge on how to decrease/avoid prejudice/discrimination at an early age as prejudice obtained during childhood continues onto adulthood, which is then harder to change (Killen, 2008, Rutland & Killen, 2015). And as discrimination is associated to illness/health risk, being that the more discrimination the more illness (Williams,
Neighbors & Jackson, 2003).
Research has looked into inter-ethnic prejudice/discrimination of students in school, and into the differences among schools’ ethnic composition. European-American children in a school ethnic composition of 15% or less of African-Americans and Latinos used more stereotypes to describe racial discomfort in different contexts and stereotypes were used more by fourth (M = 9.82 years) and seventh graders (M = 12.90 years) in comparison to tenth graders (M age: 15.90 years) (Killen, Kelly, Richardson, Crystal & Ruck, 2010). Another study among European-American Children in first (M = 6.8 years) and fourth (M = 9.9 years) grade whom attended homogeneous schools (86.1-91.2% of the students are
European-12
American) displayed implicit biases (McGlothlin & Killen, 2006). However, when European American children attended schools with a more heterogeneous ethnic composition (35%-65% of the students are European-American) these biases were no longer found (Margie, Killen, Sinno & McGlothlin, 2005; McGlothlin et al., 2005), but implicit biases were found for African American children (Margie et al., 2005).
More recent research in the USA has shown African-American and European-American children in third and fourth grade show mutual dislike regardless of the classroom ethnic composition (varied from 8%-78.6% of African-American students), moreover dislike increased for European-Americans when they were the majority group (Wilson & Rodkin, 2011).
Research in Portugal (Pereira & Monteiro, 2006), found that native Portuguese children (White) aged 5 to 7 discriminated against Black children when having to distribute coins among a white and a black child of similar SES when the school ethnic composition was of 10-39% or higher than 60% of Black students. However, in schools where the ethnic composition was of 60% or more of Black students and if children were aged 8 to 10 there was no discrimination against the black child. Furthermore, they found that native Portuguese children attributed more positive traits to children of their own ethnic group (in-group) when they were in minority, but did not discriminate when they were in majority. Yet, in large they attributed more negative traits to Black children regardless of their age and of the ethnic composition of the school.
In summary, it’s important to further investigate how far schools’ ethnic composition can foster positive or negative intergroup attitudes and racial stereotypes among young students, in order to decrease intergroup discrimination and its negative consequences.
1.5 School ethnic composition and school well-being
In psychology, well-being means “a subjective state of being well. It includes happiness, self-esteem, and life satisfaction” (Corsini, 1999, p. 1068). School well-being is hard to define, as definitions vary from author to author (e. g., Belfi, Goos, de Fraine & Van Damme, 2012); however Hofman, Hofman and Guldemond (1999) defined school well-being as the attitudes students hold towards their school, i.e. attitudes towards general school life; towards peers; towards teachers and towards the school organization and building. Social support seems to be strongly associated to well-being, as those whom reported a need for social support in school, also reported low self-confidence and were less motivated in school
13
(Vedder, Boekaerts, & Seegers, 2005). Social support has been described as social resources or networks people can rely on in situations of needing support, help, protection, guidance or comfort (Vedder et al., 2005).
In Portugal studies have looked to well-being in general with adolescents and adults but no studies were available which evaluate school well-being in primary school children. Research with adolescents has mainly found that: adolescent students’ perception of self- wellbeing was related to a positive school environment (Matos & Carvalhosa, 2001) and well-being was related to leisure activities and friendships (Gaspar, 2008). In addition, Fernandes, Vasconcelos-Raposo, Bertelli and Almeida (2011) found academic satisfaction to be
positively correlated to psychological well-being among students aged 12 to 18 years. In Spain, high well-being was associated to good academic performance among university students (Soria, Martínez, Esteve, Gumbau & Gumbau, 2005). In Australia, Tomyn and Cummins (2011) found female students to have higher subjective well-being than males (aged 12 to 20 years) and that well-being tended to decrease from early to mid adolescence.
According to Katja, Päivi, Marja-Terttu and Pekka (2002), school satisfaction, among other factors predicted subjective well-being in students of Finland (aged 12 to 17 years).
School well-being research in inter-ethnic settings is limited. One example is research that has investigated the differences of school well-being in majority and minority students. Vedder et al., (2005) found immigrant students in the Netherlands (Turkish/Moroccan) perceived teachers as providers of social support in school, while native children (Dutch) considered their parents to be more providers of social support. In regard to school well-being, (which was assessed by: self confidence, motivation and school adjustment) there was only a significant difference between motivation, meaning that immigrant students were more motivated. It’s important to note students were aged 10 to 13 and were in schools that were participating in a programme for disadvantaged children.
Studies on the effects of school composition on topics other than academic achievement are limited (Belfi et al., 2012). A review on school well-being found more well-being in single sex schools, however this effect was only found for females, while class composition by ability found mixed results: well-being was higher in classes with high ability students, yet no consensus was found across studies (Belfi et al., 2012). However it is important to consider the review consisted of only a few studies.
14
To our knowledge no national or international studies has investigated school well-being in children taking into account the differences between majority and minority groups in different school ethnic composition contexts. Thus this research aims to expand this under- researched topic.
1.6 Objectives and hypotheses
The present study aims to investigate the effect of the schools’ ethnic composition on academic achievement, cross-ethnic friendships, discrimination and school well-being, as international research results in this area are controversial and national research is limited. The study has the following objectives:
To comprehend the existing relations among academic achievement, cross-ethnic friendships, intergroup discrimination and school well being among native (White, Portuguese) and immigrant (Black, African) children in primary school;
More specifically, to understand the specific role of school’s ethnic composition, as a structured form of interethnic contact, on White vs. Black children’s academic achievement, cross-ethnic friendships, intergroup discrimination and school well being;
To contribute with research knowledge to the design of public policies in the Educational area, in particular to the importance of ethnic composition of primary schools and classrooms, in order to give both native and immigrant children greater opportunities for success and well being.
This study has the following hypotheses:
At large, academic achievement of Black children will be lower than White children’s (H1). Academic achievement of Black children will be highest when the school ethnic composition is more equally distributed, 31% to 59% (H2), while academic achievement of White children will not vary with school’s ethnic composition (H3). Cross-ethnic friendships are more likely to occur for Black than for White children, and namely in more equally than unequally school’s ethnic composition settings (H4). More cross-ethnic friendships should be related to less intergroup discrimination (H5). Interethnic discrimination is less likely to occur, both for Black and White children when the school ethnic composition is more balanced, 31% to 59% (H6). At large, well being at school will be higher among White than among Black children (H7). It should however be higher for both groups when the school ethnic composition is more equally distributed, 31% to 59% (H8).
15
II. Method 2.1 Design
This study was conducted under a quasi-experimental design. There were six conditions. Independent variables were participant’s ethnicity (Black-African and White- Portuguese) and school ethnic composition (SEC) with three levels: 10 to 30%, 31 to 59% and 60% or more of students from ethnic minority groups. The dependent variables were academic achievement, cross-ethnic friends, attribution of negative and positive traits, implicit bias and school well-being.
2.2 Participants
One hundred and fifty children participated in the study. However 48 could not be included.6 Thus, there were 102 participants, 4th grade children from eight public primary schools in the metropolitan area of Lisbon (48 White children and 54 Black children), with ages ranging between nine to thirteen years (M = 9.82 years, SD = 1.09), 50 boys (49%) and 52 girls (51%). According to schools reports, the majority of students had a medium/low socio economic status (SES). The ethnic status of each child was obtained by visual
observation, by asking the child his/her nationality and place of birth and confirming with the teacher their origin: White Portuguese or descendants from Portuguese-speaking African countries. Participants were only included in this study if both their parents were White Portuguese or Black African.
Table 2.1
Descriptive statistics of participants according to school ethnic composition (SEC)
6
Due to incomplete data or non-eligibility due to criteria of the study, 41 participants were removed from the database. Moreover, in order to create balance in the 60% or more SEC condition, seven Black participants were removed.
Ethnicity Gender Age
SEC n White Black Male Female Range M SD
10-30% 47 27 20 23 24 9-11 9.62 .68
31-59% 30 13 17 17 13 9-11 9.47 .63
60% or more 25 8 17 10 15 9-13 10.64 1.63
16 Table 2.2
Descriptive statistics of participants according to school, ethnicity and gender
2.3 Procedure
Schools’ Head teachers were contacted either by a letter (appendix A) or a telephone call. When a positive response was given a meeting was scheduled with the Director and the teachers of 4th grade to present the study. Once given approval, head teachers were given a document to complete on the characterization of the school (appendix B) and consent forms to be sent to parents/carers (appendix C) and a date to begin the study was arranged.
The study was carried out with groups of three to four children at a time, in a quiet room in one of the following spaces: library, computer room or teacher’s office. As participants arrived they were sat at the table, were introduced to the experimenter and were given verbal instructions about the task they were asked to perform. They were told that we wanted to understand how pupils felt at school with their classmates. In addition, they were asked to give their honest opinions as this was not a school task and there were no right or wrong answers. Finally, they were told to feel free to ask any questions if in doubt regarding the questionnaire. Participants were also requested to remain in silence during the application of the questionnaire and the experimenter was invigilating the room and available to answer any questions. After the questionnaire was completed, the investigator verified all questions were answered. Participants were asked how they found the questionnaire regarding its level of difficulty, they were also asked not to tell their classmates about the questionnaire and were given a bookmark as a gift for participating in the study.
Participant’s Ethnicity
Gender Age
Exact SEC School ID N White Black Male Female Range
12,50% 1 24 17 7 14 10 9-11 21.11% 2 7 0 7 2 5 9-10 23.48% 3 5 2 3 2 3 9-11 18.60% 4 11 8 3 5 6 9-10 51,60% 5 30 13 17 17 13 9-11 >60% 6 3 2 1 2 1 9-12 >60% 7 11 6 5 4 7 9-13 100% 8 11 0 11 4 7 9-11
17
2.4 Instrument and variables
The instrument used was a questionnaire, which was matched by gender (appendix D,
appendix E and appendix F, questionnaire in Portuguese). The questionnaire addressed the following issues: academic achievement; cross-ethnic friendships; intergroup discrimination; school wellbeing; family and demographic information.
Regarding information about the family context, participants were asked how many siblings they had, whom they lived with and their parents’ nationality and country of birth. There was a different task for the children who were not eligible to participate due to their ethnicity. That task consisted of activities (appendix G), it was created in order to avoid picking out only some children from the classroom and thus to avoid unhappiness for not participating.
2.4.1 Academic achievement
Participants were requested to report their grades in Mathematics, Portuguese and Social Environmental studies,7 regarding the 1st period of the academic year (September -December 2014).8 However, as data collection lasted until June, the grades for the 2nd period of the academic year (January – April 2015) were then obtained from the teachers. In addition, at the end of the academic year children’s final grades (both school and national grades of the three disciplines were made public and inserted in the database). For analysis, seven different variables were created: internal grades (school’s Portuguese grade and school’s Mathematics grade); external grades (national exam Portuguese grade and national exam Mathematics grade) and final grades (final Portuguese grade, final Mathematics grade and final Social Environmental studies grade).9
2.4.2 Cross-ethnic friendships
Participants were asked to name their closest friends among their classmates, (maximum of three friends) and to indicate which country they were from (Feddes et al., 2009). It was common for children to be unable to identify the country; therefore the origin of those children was requested to the teachers. For analysis, a new variable was created by summing up the number of friends the participant had from a different origin to their own, ‘number of
7
Social Environmental studies, Estudo do meio (in Portuguese), is the study of various scientific disciplines, e.g. History, Geography, Natural Sciences and Ethnography.
8
Grades in Portuguese primary schools range from one to five (1 insufficient, 2 weak, 3 satisfactory, 4 good and 5 very good).
9
Final Portuguese and Mathematics grades are a weighed mean of the school and national exams grades.
18
friends from a different origin’, coded as: 1 = no friends from a different origin, 2 = one friend, 3 = two friends and 4 = three friends.
2.4.3 Intergroup discrimination
Two tasks were used, a trait attribution (Pereira & Monteiro, 2006) and the Ambiguous Situation task (McGlothlin et al, 2006; McGlothlin et al, 2005; McGlothlin, 2004).
In the first task, four pre-tested photos of White and Black girls and boys represented the ethnic and gender groups. Children rated a White girl/boy and a Black girl/boy (target
pictures were participants gender matched) according to how much they thought children were similar to the one on the photo (“How do you think girls/boys like this one are?”). A 5 point Likert scale (1 = not at all like that; 5 = exactly like that) on 10 adjectives, 5 positive (good people, sincere, honest, intelligent, studious) and 5 negative, (rude, aggressive, dumb, dirty and lazy) was used. For analysis, two dependent variables were created: positive traits and negative traits. In order to analyse these variables two indexes were created. The positive traits consist of an index of the difference between positive traits attributed to the White child and to the Black child, varying between 5 (more positive traits to the in-group than the out-group) and -5 (more positive traits to the out-group than the in-out-group). The negative traits consist of an index of the difference between negative traits attributed to the White child and to the Black child, varying between 5 (more negative traits to the out-group than the in-group) and -5 (more negative traits to the in-group than the out-group). In both variables positive values indicate an in-group favouritism while negative values indicate an out-group favouritism. If the index was zero, it indicated participants rated both White and Black children identically. The consistency of the variables was high, Cronbach’s alpha of .758. In the second task - the Ambiguous Situation task –Killen’s scenario of the ‘swing situation’ was used. This task involved showing the participant a sequence of two pictures depicting interactions between a White and a Black child: one where the White child was the potential victim (lying on the floor) and the Black child the potential transgressor (standing by the swing, behind the White boy) and the other where the Black child was the potential victim and the White child the potential transgressor. Besides their skin colour, children presented typical White (Maria/John) or Black (Malika/Anouar) first names. Participants then had to answer the following questions: (e.g.) “Here is John and here is Anouar. What do you think that happened and why?” Space was given for a written response (answers were then coded into: 1 = negative, e.g. ‘John pushed Anouar’, and 2 = positive/neutral, e. g. ‘they are playing’); “Do you think (name of potential transgressor) was good or bad?” on a 5-point Likert scale 1 = very bad and 5 = very good; “How much do you think they are friends?” on a
19
5-point Likert scale (1 = not at all and 5 = very much) and, “Which of these two boys would you like to be friends with?” where participants marked the name of the child they preferred (e.g. John or Anouar).
Participants were always given the trait attribution task before the ‘ambiguous situation’ task. The presentation of White and Black target children was counterbalanced across four tasks for each gender. A distracter task was then presented (a maze) before the remaining two tasks were performed.
2.3.4 School well-being
For the assessment of participants’ school well-being, five items were used which
measured school well-being from the Pais (2010) Questionnaire, which was developed from the KIDSCREEN-52 (Gaspar & Matos, 2008).10 Participants were asked to think about a general issue “How do you feel at school?”, followed by 5 specific questions: “Do you have friends that can help you?”; “Do you like being in this school?”; “Would you like to get more help at school?”; “Have you been a weak student?” and “If you had a problem in school could you count on someone’s help?” Answers were given on a 5-point Likert scale, (1 = no, not at
all and 5 = yes, a lot). For analysis, a Factor Analysis was conducted; generating two factors
under the rotation method of Varimax with Kaiser Normalization, rotation converged in 3 iterations. Factor 1, Social Support: “Do you have friends that can help you?”; “Do you like being in this school?”; “If you had a problem in school could you count on someone’s help?” and Cronbach’s alpha = .41. Factor 2, Performance and School Support: “Would you like to get more help at school?”; “Have you been a weak student?” and Cronbach’s alpha = .55.11
2.5 Data analysis
In order to analyse the data the IMB SPSS software was used (version 22). Firstly a descriptive analysis was performed on all the dependent variables, followed by an analysis of correlations, Chi-square, Factor Analysis, ANOVAs and repeated measures ANOVAs, according to those used in similar studies (McGlothlin et al, 2006; McGlothlin et al, 2005; McGlothlin, 2004; Pereira & Monteiro, 2006).
10
These scales have been validated for the Portuguese population: KIDSCREEN-52 (Gaspar et al., 2008).
11
Consistency of the Cronbach’s alphas are low, however analyses were conducted due to the interest of the variable to the study.
21
III. Results
3.1 Descriptive statistics and bivariate correlations
The descriptive statistics of the dependent variables of this study are presented on table 3.1, and the bivariate correlations on table 3.2.
3.1.1 Descriptive statistics
As shown on table 3.1, most of the variables vary between the minimum and maximum value of their scales and their distribution is not far from normality. Exceptions are:
goodness/badness of potential transgressor (White), goodness/badness of potential
transgressor (Black). Theses exceptions are shown in skewness and kurtosis, the values of
which vary between 2.0 and 7.0, which suggests they may be problematic (Curran, West & Finch, 1996).
Table 3.1
Descriptive statistics of the dependent variables in the study
Dependent variable N Minimum Maximum M SD Skewness Kurtosis
Cross-ethnic Friendships 102 1.00 4.00 1.96 1.03 .574 -1.019
School’s Portuguese grade 101 2.00 5.00 3.55 .83 .465 -.649
School’s Mathematics grade 101 2.00 5.00 3.41 .93 .319 -.726
National Exam Portuguese grade 98 1.00 5.00 3.0 .81 .000 -.878
National Exam Mathematics grade 98 1.00 5.00 2.65 1.10 .588 -.322
Final Portuguese grade 101 2.00 5.00 3.49 .78 .561 -.322
Final Mathematics grade 101 2.00 5.00 3.30 .84 .204 -.501
Final Social Environmental studies grade 101 2.00 5.00 3.69 .81 .274 -.850
Positive Attributions 102 -2.00 3.20 .12 .98 .345 1.101
Negative Attributions 102 -1.40 4.00 .18 .92 1.07 2.454
School well-being – Social Support 102 1.00 5.00 4.62 .58 -1.766 2.790
School well-being – Performance & School Support 101 1.00 5.00 2.90 1.17 -.062 -.911
Interpretation of situation (VB) 102 1.00 2.00 - - - -
Interpretation of situation (VW) 102 1.00 2.00 - - - -
Goodness/badness of potential transgressor (VW) 102 1.00 5.00 1.25 .74 3.509 13.156 Goodness/badness of potential transgressor (VB) 102 1.00 5.00 1.38 1.00 2.836 7.310
Likelihood of interethnic friendship (VB) 102 1.00 5.00 1.73 1.15 1.570 1.681
Likelihood of interethnic friendship (VW) 102 1.00 5.00 1.77 1.17 1.441 1.208
Friend preference (VB) 102 1.00 2.00 - - - -
Friend preference (VW) 102 1.00 2.00 - - - -
Note. (VB) = victim is Black and (VW) = victim is White.
3.1.2 Bivariate correlations
Bivariate correlations (table 3.2) show academic achievement (school, national and final grades), correlations show that all are positively inter-correlated (correlations range from .290
22
to .936); however there are some relevant differences: both Portuguese and Mathematics school - national grades have much lower correlations (Port r= .548, p< .01; Math r= .347, p< .01) than Portuguese and Mathematics school - final grades (Port r= .936, p< .001; Math r= .827, p< .01). Cross-ethnic friendships was positively and weakly correlated with the goodness/badness of potential transgressor, when he/she was Black (.219, p<.05) and
negatively and weakly correlated with friendship potential when the victim was Black (-.223, p<.05). In regard to trait attributions, positive attributions were weakly and positively
correlated with the national exam Portuguese grade (r= .210, p<.05) and negative and positive attributions were moderately and positively correlated (r=.361, p< .01). Wellbeing in school, performance and school support is negatively and weakly/moderately correlated with school, as well as with final Portuguese, Mathematics and Social Environmental studies grades, correlations ranging from -.208 to -.482, meaning that if students report they would like more help at school and that they have been a weak student, academic achievement decreases. In relation to the ‘ambiguous situation’ task, many of the variables are correlated to each other, positively with the relationship being weak, moderate or strong (ranging from .203 to .649), with an exception of some being negatively correlated (ranging from -.119 to -.248).
23 Table 3.2
Bivariate correlations between the variables in the study
1 2 3 4 5 6 7 8 9 10 11 12 13 14 15 16 17 18 19 1 - 2 -.073 - 3 -.010 .768** - 4 -.024 .548** .464** - 5 -.114 290** .347** .552** - 6 -.106 .936** .730** .682** .339** - 7 -.029 .662** .827** .586** .738** .674** - 8 -.006 .806** .792** .531** .383** .743** .707** - 9 -.180 .141 .011 .210* .130 .133 .109 .034 - 10 .068 -.008 -.015 -.016 -.050 -.004 -.034 -.061 .361** - 11 .136 -.005 -.017 -.051 .043 -.042 -.021 -.036 -.285** -.014 - 12 .017 -.482** -.449** -.208* -.118 -.460** -.364** -.425** -.021 -.097 -.166 - 13 -.037 .024 -.004 -.018 .011 .050 -.013 -.061 -.095 -.137 .049 -.027 - 14 -.080 -.023 -.085 .061 -.082 -.001 -.072 -.080 .083 -.064 -.126 0.16 .364** - 15 .052 .019 .012 -.085 -.054 .032 -.007 .028 -.183 -.177 .054 -.018 .521** .146 - 16 .219* -.032 -.009 .051 -.125 .027 -.031 .025 -.079 -.022 -.008 -.126 .074 .365** .224* - 17 .066 -.168 -.134 -.110 .013 -.156 -.046 -.053 -.079 -.161 -.041 .148 .385** .194 .468** .147 - 18 .140 -.029 -.074 .054 -.063 -.004 -.045 .013 -.017 -.065 -.106 .057 .175 .434** .203* .428** .649** - 19 -.223* -.073 .005 .000 .106 -.023 .048 .009 .047 .094 -.100 .083 -.199* -.067 -.598** -.016 -.050 -.137 - 20 -.119 .069 .074 -.057 .094 .045 .060 .177 -.045 .009 -.085 .047 -.056 -.364** -.132 -.428** -.023 -.212* .199*
Note. 1 = Cross-ethnic friendships; 2 = School’s Portuguese grade; 3 = School’s Mathematics grade; 4 = National Exam Portuguese grade; 5 = National Exam Mathematics grade; 6 = Final Portuguese grade; 7 = Final Mathematics grade; 8 = Final Social Environmental studies grade; 9 = Positive Attributions; 10 = Negative Attributions; 11 = School well-being – Social Support; 12 = School well-being – Performance and School Support; 13 = Interpretation of situation (VB); 14 = Interpretation of situation (VW); 15 = Goodness/badness of PT (VB); 16 = Goodness/badness of PT (VW); 17 = Likelihood of friendship (VB); 18 = Likelihood of friendship (VW); 19 = Friend preference (VB); 20 = Friend preference (VW). Correlations number 12, 14, 19 and 20 are Spearman’s correlations, the remaining correlations are Pearson’s.
24
3.2 Control of participant’s gender variable
In this study we aimed to analyse the school’s ethnic composition, ethnicity and gender
effect on cross ethnic friendships, academic achievement, well-being in school and on discrimination (trait attribution and ambiguous situation task). However, considering the sample size, combining the three independent variables (school ethnic composition, ethnicity and gender) made the groups too unbalanced for analysis, thus gender was analysed
separately from the other variables. As can be seen on tables 3.3 and 3.4, there are no significant differences among the dependent variables according to the participants’ gender.
Table 3.3
T-Tests on the effect of gender on the dependent variables
Dependant variable T df Sig. (2-tailed)
Cross-ethnic friendships -.198 100 .843
School’s Portuguese grade -.758 99 .450
School’s Mathematics grade .879 99 .381
National Exam Portuguese grade -1.760 96 .082
National Exam Mathematics grade .119 96 .906
Final Portuguese grade -1.217 99 .226
Final Mathematics grade .812 99 .419
Final Social Environmental studies grade .255 99 .800
Positive Attributions (White – Black targets) .935 100 .352
Negative Attributions (White – Black targets) 1.057 100 .293
School well-being – Social Support .328 100 .743
School well-being – Performance and School Support -1.375 99 .172 Goodness/badness of potential transgressor (VW) -.604 100 .547 Goodness/badness of potential transgressor (VB) -.826 100 .411
Likelihood of friendship (VB) .125 100 .901
Likelihood of friendship (VW) -.630 100 .530
25 Table 3.4
Chi-square tests on the effect of gender on the dependent variables
Dependant variable Chi-Square df Sig
Interpretation of situation (VB) .035 1 .851
Interpretation of situation (VW) .009 1 .925
Friend Preference (VB) .045 1 .832
Friend Preference (VW) .021 1 .885
Note. (VB) = victim is Black and (VW) = victim is White.
3.3 Effects of school ethnic composition and the ethnicity of the participants
Before conducting statistical tests the normality and homogeneity of variance
assumptions were tested. The variables were not always normally distributed and there are some violations of the homogeneity of variances. Thus it is important to consider and analyse these results with precaution. However, parametric tests were still conducted as the Skewness and Kurtosis values are not critical, indicating that the distribution is not far from normality in most cases, as shown on table 3.1.
3.3.1 Academic achievement
The analysis of the effect of school ethnic composition and participant’s ethnicity on
academic achievement in Portuguese, Mathematics and Social Environmental studies will be conducted with seven dependent variables: internal grades (school’s Portuguese and
Mathematics grades); external grades (national exam Portuguese and Mathematics grades) and final grades (for Portuguese, Mathematics and Social Environmental studies). However, results will be described in more detail only for the final grades, as these grades correlate moderately/strongly and positively with the internal and external grades and because these are the grades that define students’ formal school achievement. Internal and External grades will then be explored briefly. The following analyses were conducted in order to test hypotheses: 1, 2 and 3.
3.3.1.1 Final Portuguese grades. To test for the effect of school ethnic composition and
participant’s ethnicity on the final Portuguese grade, a 3 (school ethnic composition: 10% to 30%, 31% to 59%, 60% or more) x 2 (participant’s ethnicity: White, Black) univariate ANOVA was conducted. Globally, this model explained 10.2% (ƞ² = .102) of the variability of the final Portuguese grade. The results showed a main effect for the participants ethnicity,
F(1, 95) = 4.718, p = .032, ƞ² = .047, meaning that White participants had higher grades than