UNIVERSIDADE DA BEIRA INTERIOR
Ciências Sociais e Humanas
Natural Resources, Globalization and Sustainable
Economic Welfare: A Panel ARDL Approach
Samuel da Silva Faria
Dissertação para obtenção do Grau de Mestre em
Economia
(2º ciclo de estudos)
Versão definitiva após defesa
Orientador: Prof. Doutor José Alberto Fuinhas
Aknowledgments
I sincerely express my gratitude to Professor José Alberto Fuinhas, for all the sharing expertise and for all the encouragement along this process. I am extremely thankful and indebted to him.
To my parents, my sincere homage and thanks for all the support and personal sacrifice along this journey.
I wish to thank my girlfriend, for all her love and support, bringing joy to my life, every day.
Resumo
O Produto Interno Bruto (PIB) tem sido a medida mais aceite de desempenho económico, apesar de não medir com exatidão o desenvolvimento económico, ignorando aspetos-chave da qualidade de vida e sustentabilidade. Ao longo dos últimos anos, a preocupação com o futuro do nosso planeta e a sustentabilidade da atividade humana tem-se tornado foco das instituições públicas e políticas, devido à crescente exploração dos recursos naturais e à intensificação e aprofundamento da globalização. Deste modo, o Índice de Bem-estar Económico Sustentável (ISEW) surge como a alternativa dominante. Este artigo procura: (i) comparar o PIB e o ISEW enquanto medidas de performance económica; e (ii) identificar os efeitos resultantes da exploração de recursos naturais e do fenómeno da globalização tanto no crescimento económico como no desenvolvimento sustentável. A questão de investigação é: serão a globalização e a exploração dos recursos naturais prejudiciais ao desenvolvimento económico? Testes de diagnóstico revelam a presença de cross-sectional dependence entre as variáveis, heterocedasticidade e auto-correlação. Assim, o estimador Driscoll-Kraay é utilizado devido à sua robustez na presença destes fenómenos. A abordagem Panel Autoregressive Distributed Lag é utilizada, permitindo assim verificar os efeitos de curto e longo prazo. O painel é composto por 14 países desenvolvidos, membros da OCDE, e são utilizados dados anuais para o horizonte temporal compreendido entre 1995 e 2013. Os resultados obtidos mostram que as receitas provenientes dos recursos naturais têm um efeito positivo no PIB per capita no curto prazo, enquanto que no ISEW se verifica um efeito negativo tanto no curto como a longo prazo. Estes resultados demonstram que o aumento do PIB não tem em conta os impactos das mudanças no capital natural e que a exploração de recursos naturais pode constituir um entrave ao desenvolvimento sustentável. A abertura comercial tem um impacto positivo para o crescimento económico no curto prazo e um impacto negativo no desenvolvimento sustentável de longo prazo. Outros resultados revelam que a globalização social tem um impacto positivo no crescimento económico a longo prazo e que a integração política é positiva para o bem-estar económico. Os formuladores de políticas devem considerar o ISEW como uma medida alternativa e mais precisa do desenvolvimento económico, devendo implementar políticas que reduzam o desgaste dos recursos naturais, e limitar os efeitos nocivos da globalização para melhorar o desenvolvimento económico e criar mais bem-estar para as populações.
Palavras-chave
Resumo alargado
Nas últimas décadas tem-se assistido a uma crescente preocupação sobre o futuro do nosso planeta. A intensificação do fenómeno da globalização, cada vez mais presente através do aprofundamento das relações económicas, sociais e políticas, tem aumentado os padrões de consumo em termos globais, o que contribui para uma crescente exploração dos recursos naturais do planeta, com vista a satisfazer o aumento das necessidades de consumo das populações, o que coloca em causa a sustentabilidade da atividade humana. Esta preocupação tem tido ênfase ao nível das instituições públicas. Nos últimos anos, temos assistido a um aumento dos esforços a nível mundial para limitar o impacto da atividade humana no futuro do planeta, ainda que sem grandes resultados visíveis. Uma das possíveis razões prende-se com a ineficiência das ferramentas que medem a atividade económica.
O Produto Interno Bruto (PIB) tem sido o indicador mais aceite e utilizado para medir o desempenho económico, apesar de não medir com exatidão o desenvolvimento económico, ignorando aspetos-chave da qualidade de vida e da sustentabilidade. Medidas ineficientes levam a decisões políticas ineficientes. Assim, o Índice de Bem-estar Económico Sustentável (ISEW) surge na literatura como a alternativa dominante. O ISEW apresenta-se como um indicador de performance económica que tem em conta os efeitos nefastos de fenómenos como a desigualdade, dos problemas sociais e, sobretudo, do desgaste dos recursos naturais e da degradação do ambiente. O ISEW procura medir então o desempenho económico em termos de bem-estar económico e social, mas também em termos de sustentabilidade. Uma das principais vantagens do ISEW quando comparado com o PIB é o facto de o primeiro avaliar as alterações no capital humano, natural e social. Por outro lado, a própria construção do ISEW permite a comparação direta com o PIB. O foco deste trabalho está na comparação entre o PIB e o ISEW enquanto indicadores de desempenho económico, e procura averiguar de que forma os efeitos da exploração de recursos naturais e do fenómeno da globalização influenciam tanto o crescimento económico (PIB) como o desenvolvimento sustentável (ISEW).
Os efeitos da exploração de recursos naturais são aprofundados na literatura, não existindo um consenso. Enquanto alguns autores referem os efeitos positivos da abundância de recursos naturais para a riqueza dos países, outros autores referem que a exploração de recursos naturais pode estar associada com maiores níveis de desigualdade ou que a dependência de recursos naturais pode travar o crescimento. A utilização do ISEW pode ajudar a perceber melhor a relação entre recursos naturais e desempenho económico. Por outro lado, a globalização é geralmente vista como positiva para o desenvolvimento, sobretudo a vertente económica, através do aumento das relações comerciais entre os países. No entanto, alguns autores consideram que a intensificação deste fenómeno pode ter impactos negativos no
com que importe estudar os efeitos de cada uma das suas dimensões, nomeadamente económica, social e política.
Na literatura, a superioridade do ISEW enquanto indicador de desenvolvimento sustentável é assinalada, embora a falta de uma metodologia padronizada e menos ambígua estejam a impedir a estabilização do ISEW enquanto medida macroeconómica. Para fazer face a isto, o primeiro passo neste trabalho foi a construção de um ISEW que permitisse a comparação do maior número de países possível, utilizando metodologias já presentes na literatura. As evoluções dos indicadores em estudo revelam diferenças substanciais entre PIB e ISEW, sugerindo que utilizando diferentes indicadores, os efeitos dos referidos fenómenos podem ser diferentes.
Foram utilizados catorze países, desenvolvidos e de alto rendimento, membros da OCDE, devido à disponibilidade dos dados para todas as variáveis que compõem o ISEW, mas também porque se pretendia um painel de países com políticas comuns e níveis de rendimento semelhantes, para evitar disparidades nas componentes do ISEW.
Uma vez que se pretende avaliar os efeitos tanto a curto como a longo-prazo, foi utilizada neste estudo uma abordagem ARDL (Autoregressive Distributed Lag). Para selecionar o estimador mais adequado, uma bateria de testes foi realizada. Foi averiguada a presença de dependência entre cross-sections, que confirmou que os países se comportam de maneira semelhante. Por outro lado, a presença de multicolinearidade entre as variáveis foi rejeitada. Foram efetuados testes de raiz unitária de segunda geração, para identificar a ordem de integração das variáveis. Uma vez que nenhuma das variáveis tem ordem de integração dois, a abordagem ARDL pôde ser prosseguida. A presença de cointegração foi rejeitada, tanto para o painel completo como para cada país individualmente. Atendendo a isto, o teste de Hausman foi efetuado para confirmar o tipo de estimador mais adequado. Após a estimação dos modelos de efeitos fixos, que se revelaram os mais indicados, foram efetuados testes de especificação, que detetaram a presença de heterocedasticidade e autocorrelação. O estimador Driscroll-Kraay revelou-se como o mais adequado face às características do painel em análise e das variáveis a utilizar no estudo. Após a estimação dos modelos, foram calculadas as elasticidades e impactos de longo prazo.
Os resultados evidenciam as diferenças entre PIB e ISEW. As receitas provenientes da exploração de recursos naturais têm um impacto positivo no PIB a curto prazo e um impacto negativo no ISEW, tanto no curto como no longo-prazo, suportando o argumento que embora a exploração de recursos naturais traga benefícios financeiros a curto prazo, os custos ambientais associados fazem com que os efeitos para a sustentabilidade e bem-estar sejam negativos. Por outro lado, a abertura comercial ao exterior apresenta um impacto positivo no PIB a curto prazo e um impacto negativo no ISEW no longo prazo, o que suporta a ideia de que a abertura comercial aumenta a desigualdade de rendimentos, tendo um efeito negativo no bem-estar das
medida através de proximidade social e cultural influencia positivamente o crescimento económico no longo prazo. A integração política dos países em estudo tem um impacto positivo tanto para o PIB como para o ISEW no curto-prazo. Este trabalho contribui para a estabilização do ISEW enquanto indicador macroeconómico, e permite perceber as diferenças entre crescimento económico e desenvolvimento sustentável. Assim, os decisores políticos devem considerar o ISEW enquanto indicador macroeconómico e devem implementar políticas que reduzam o desgaste dos recursos naturais para garantir a sustentabilidade da atividade humana, ao mesmo tempo que devem limitar os efeitos nefastos da globalização a fim de garantir um desenvolvimento económico que seja sustentável e que melhore efetivamente o bem-estar das populações.
Abstract
Gross Domestic Product (GDP) has been the most widely accepted measure of economic performance, but it fails to accurately measure economic development, overlooking key aspects of quality of life and sustainability. Over the last few years, concern about the future of our planet and sustainability of human activity rose among public eye and political institutions, due to the increased natural resources exploitation, and the intensification and deepening of globalization. Thereby, the Index of Sustainable Economic Welfare (ISEW) emerges as the dominant alternative. This paper aims to: (i) compare both GDP and ISEW as measures of economic performance; and (ii) establish the effects of natural resources exploitation, and globalization on both economic growth and sustainable development. The research question is: Are globalization and natural resources exploitation harmful to economic development? Diagnostic tests show presence of cross-section dependence, heteroskedasticity and serial correlation. Thus, Driscoll-Kraay estimator is performed due to its robustness in the presence of these phenomena. A Panel Autoregressive Distributed Lag approach is used, which allows to check for short and long-term effects of the variables. The panel is composed by 14 OECD countries, and uses annual data for the time span from 1995 to 2013. Results show that natural resource rents have a positive effect on GDP per capita in the short-run and a negative effect on ISEW per capita both on short- and long-run. These results reveal that enhancing GDP does not account for the impacts of changes in natural capital and that natural resource exploitation may represent a hazard to sustainable development. Trade openness has a positive impact on short-term economic growth and a negative impact on long-term sustainable development. Other results show that social globalization has a positive impact on long-term economic growth and that political integration is positive for economic welfare. Policy makers ought to consider ISEW as an alternative and more accurate measure of economic development, should implement policies that reduce the depletion of natural resources, and confine the harmful effects of globalization to enhance economic development and create more welfare.
Keywords
Index
1. Introduction 1
2. Literature Review 2
2.1. Measuring Sustainable Development 2
2.2. Natural Resources 6
2.3. Globalization 6
3. Data and Method 8
4. Results and discussion 13
5. Conclusions and policy implications 17
Figures list
Tables list
Table 1. Construction of the ISEW 5
Table 2. Descriptive statistics and cross-section dependence tests 10
Table 3. VIF statistics 10
Table 4. Panel Unit Root tests 11
Table 5. Westerlund test of cointegration 12
Table 6. Hausman tests 13
Table 7. Specification tests 13
Table 8. Estimation results 14
Acronymous list
SDG- Sustainable Developent Goals GDP- Gross Domestic Product
ISEW- Index of Sustainable Economic Welfare GPI- Genuine Progress Indicator
OECD- Organization for Economic Cooperation and Development SWIID- Standardized World Income Inequality Database
WDI- World Development Indicators USD- United States Dollar
GDPpc- Gross Domestic Product per capita
ISEWpc- Index of Sustainable Economic Welfare per capita ARDL- Autoregressive Distributed Lag
CD- cross-section dependence VIF- Variance Inflator Factor LM- Lagrange-Multiplier DFE- Dynamic Fixed Effects DK- Driscroll-Kraay
EG- Economic Growth SD- Sustainable Development
1. INTRODUCTION
Over the last decades, concerns about the future of our planet and sustainability of human activity rose among public eye, academics and political institutions. Recently, the UN established the Sustainable Development Goals (SDG) targeting to improve living standards and well-being of populations and reverse the trend of environmental degradation (UNDP, 2016). Sustainable development may be defined as “development that meets the needs of the present without compromising the ability of future generations to meet their own needs” (UNWCED, 1987).
Gross Domestic Product (GDP) has been the most widely accepted measure of economic performance, despite its inadequacy on measuring economic welfare (Costanza et al., 2009; Khan et al., 2016; Kuznets, 1934), since it does not distinguish welfare improving activities from welfare reducing activities (Cobb et al., 1995). Thereby, to achieve sustainable development, there is a need to go beyond GDP towards a broader measure that accounts for changes in natural, social and human capital, and therefore welfare and sustainability (Costanza et al., 2009; European Commission, 2011; Kubiszewski et al., 2013). Thus, the Index of Sustainable Economic Welfare (ISEW) emerges as the dominant alternative (Beça & Santos, 2014).
The ISEW, originally developed by Daly and Cobb (1994), serves a better purpose on measuring welfare and sustainability than GDP, since it considers the economy within a larger dimension, where social, natural and human capital become part of the same system. Starting with private consumption, it deducts the effects of income inequality, environmental degradation and other expenses that do not generate welfare, the so-called defensive costs (Stockhammer et al., 1997). One advantage of the ISEW when compared to other welfare indicators is the monetization of the items, which measure the welfare impacts of past and current activities and allows for a direct comparison between ISEW and GDP. With a broader measure of economic performance, policy makers can shift their actions to achieve general welfare and ensure the sustainability of human activity.
Natural resources exploitation has been increasing over the last decades and this intensification is expected to continue in the future (UNEP, 2011), enhancing the need to develop policies that ensure resource efficiency and a more sustainable resource management. Although developed countries with good institutional quality are more likely to have positive effects of natural resources on economic growth (Horváth & Zeynalov, 2014), the question about the welfare and long-run sustainability of natural resources exploitation remains unanswered.
Globalization is a process of economic, social and political integration that has been deepened worldwide over the last decades and usually identified as a positive driver to economic development. Since globalization is a wider, multi-dimensional phenomena, this process requires analysis from a broader scope, considering that its different dimensions may affect economic performance in different ways (Dreher, 2006). Having this, the ISEW allows capturing the effects of those dimensions, examining the consequences of globalization on long-run welfare.
This paper aims to: (i) compare both GDP and ISEW as measures of economic performance, and (ii) establish the effects of natural resources exploitation and globalization on both economic growth and sustainable development. The research question is: Are globalization and natural resources exploitation harmful to economic development?
The remainder of this paper is displayed as follows: Section 2 contains the existent literature; Section 2.1.1 presents the ISEW; Section 3 describes data and methods; Section 4 presents the results, which are discussed in section 5 and in section 6 final conclusions are stated.
2. LITERATURE REVIEW
2.1 MEASURING SUSTAINABLE DEVELOPMENT
Gross Domestic Product is the most widely accepted measure of economic performance and has been used to measure both economic growth and economic development. GDP serves a good purpose to measure the market output of an economy, since it measures the flow of goods and services produced within a period of time. It is composed by private consumption, government expenditure, capital formation and net value of exports.
Achieving GDP growth has become the main goal for policy makers since its popularity rose in the aftermath of World War II. Back then, accounting for the intensity of investment, through gross capital formation and government expenditure, was a good insight for the pace of countries reconstruction and capacity of production. Private consumption gave good insights about population’s income and future expectations and the net value of exports was important to ensure countries economic stability and international position. Altogether, GDP growth was important to measure capacity of production and guarantee political stability. However, GDP was never designed to measure economic welfare or sustainability (Costanza et al., 2009; Kuznets, 1934) since it does not account for changes in the natural, human and social capital which are inherent parts of the economic system (Costanza et al., 2009; Saunoris & Sheridan, 2013).
Ecological economists consider that GDP is no longer a good indicator of human progress. The baseline for that belief is the so-called threshold hypothesis (Max-Neef, 1995), stating that economic growth causes improvements in the quality of life up to a certain point, beyond which its benefits are exceeded by its costs, deteriorating quality of life and welfare. Thus, alternative indicators have been developed, such as the Index of Sustainable Economic Welfare (ISEW) (Daly et al., 1994) and the Genuine Progress Indicator (GPI) (Cobb), aiming to replace GDP and GDP growth as measures of sustainable economic development.
The ISEW/GPI follow Fisher’s (1906) concept of physical income, distinguishing the flow of goods and services from the stock of capital it derives from. Therefore, the main difference between GDP and the ISEW/GPI methodology is the fact thatwhile the former treats all flows as income, the latter distinguish welfare generating activities from welfare reducing activities (Cobb et al., 1995). By accounting for these defensive costs, the ISEW/GPI methodology attends to measure sustainable economic welfare rather than economic activity alone (Costanza et al., 2009).
subtracted, accounting for those parts of production that are not disposable for consumption but are required to maintain current levels of consumption and for future losses caused by today’s production (Beça & Santos, 2010; Stockhammer et al., 1997). While this approach is well stablished within the ISEW literature, the items that compose the defensive costs are not consensual, specially the social components.
Some authors developed the ISEW for specific countries, adapting the methodology for the country under analysis. For example, the Thailand ISEW (Clarke & Islam, 2005) accounts for the cost of commercial sex work. The Greek ISEW (Menegaki & Tsagarakis, 2015) accounts for the cost of noise pollution, adapting the calculation to the Greek case. Depending on data availability, some authors include items such as the cost of crime, cost of commuting or the cost of family breakdown (Beça & Santos, 2014; Castañeda, 1999; Gigliarano et al., 2014; Jackson, 1996). On one hand, accounting for these disservices improve the theoretical validity of the ISEW, since it includes a wider range of components that may affect welfare and sustainability (Beça & Santos, 2010; Lawn, 2003). On the other hand, it stunts country-wide comparability and raise arbitrary issues. The lack of a standardization of the ISEW methodology remains as one of the main barriers to its development as a policy relevant indicator (Hák et
al., 2016; Neumayer, 2000).
In this paper, we focus on building an ISEW that could directly compare to GDP as a macroeconomic indicator. Thus, the ISEW is calculated considering data availability and comparability, comprising the existing framework.
As in Table 1, the first component of the ISEW is the private consumption base, weighted for losses from income inequality. The underneath assumption is that as income inequality rises, overall welfare decreases, since an additional amount of money benefits more a poor family than a richer one (Bleys, 2008).
The contribution of domestic and volunteer labor is then added, which allows to measure non-market production. By valuing the inputs of unpaid work by the average wage, this item is priced by the opportunity costs (Stockhammer et al., 1997). This method enhances the contributes of household and volunteer work to economic welfare.
The ISEW relies on the concept of physic income. Net capital growth measures changes in the stock of capital. Therefore, it measures only the flows of capital and not the stock that it derives from.
Public expenditures on health and education are not always welfare enhancing. Daly and Cobb (1994) state that some of those expenses are defensive, not intended to increase welfare but to repair damages caused by the system and to prevent the deterioration of human capital.
As in most of the literature (Castañeda, 1999; Gaspar et al., 2017; Gigliarano et al., 2014; Jackson, 1996; Menegaki & Tsagarakis, 2015; Menegaki & Tugcu, 2017), only half of public expenditure on health and education are considered as non-defensive.
The environmental components are forest, mineral and energy depletion which are considered to measure the costs of environmental degradation. The main assumption underneath these defensive costs is that the depletion of natural resources reduces the future stock of this capital.
Carbon dioxide damage cost intends to value the long-term environmental damage from today’s structure of production and it is used as in Gaspar et al. (2017) and Menegaki (2016).
To avoid ambiguity, the indicators used in this ISEW are all from World Bank and OECD databases apart from Gini Index, taken from SWIID 5.1 (Solt, 2009, 2016), which favors country-wide comparability and brings more reliability to the indicator.
The formal proposition of the ISEW, as in Marques et al. (2016), Menegaki and Tsagarakis (2015) and Menegaki and Tugcu (2017) is:
Equation 1. Formulation of the ISEW
𝐼𝑆𝐸𝑊 = 𝐶𝑤 + 𝑆 + 𝐺𝑒ℎ + 𝐾𝑛 − 𝑁𝑠 − 𝐶𝑠
where 𝐶𝑤 stands for the adjusted private consumption expenditures; 𝑆 is the benefits of unpaid household and volunteer work; 𝐺𝑒ℎ represents non-defensive public expenditures, namely education and Health; 𝐾𝑛 is the net capital growth; 𝑁 stands for the depletion of natural capital and 𝐶𝑠 is the social defensive costs, which were not computed due to lack of available data.
Table 1. Construction of the ISEW
Component Source Computation
Adjusted private consumption (+)
Final household consumption expenditure – WDI
Net Gini Index – SWIID 5.1
Final household consumption expenditure * (1 – Net Gini Index). Net Gini is Gini post taxes and transfers, accounting for income distributional policies. A 0 value represents perfect equality and 1 perfect inequality. Unpaid Work (+) Number of unpaid
workers – WDI Average wage – OECD
Number of unpaid workers * Average wage Net capital growth (+/-) WDI Gross Capital Formation – Gross Capital
Consumption Non-Defensive Health
Expenditure (+)
WDI Public health expenditure * 0.5 Non-Defensive Education
Expenditure (+)
WDI Public education expenditure * 0.5
Mineral Depletion (-) WDI Ratio of the value of the stock of mineral resources to the remaining lifetime (capped at 25 years)
Forest Depletion (-) WDI Calculated as the product of unit resource rents and the excess of round wood harvest over natural growth
Energy Depletion (-) WDI Ratio of the value of the stock of energy resources to the remaining lifetime reserves (capped at 25 years)
Carbon Dioxide Damage (-)
WDI Carbon dioxide damage is estimated to be $20 per ton of carbon times the number of tons of carbon emitted
2.2 NATURAL RESOURCES
The relationship between natural resources and economic activity has been emphasized by researchers. There is little consensus on how natural resources exploitation affect long-term economic development. While some authors state that natural resources can boost the economy, others found negative impacts on economic growth. The former part of the literature usually defends the benefits of natural resources as higher stocks of natural capital enhance economic growth. For example, Brunnschweiler and Bulte (2008) separate natural resource dependence from natural resource abundance, therefore separating flows from stocks and conclude that while dependence does not affect economic growth, abundance is growth-enhancing.
On the other hand, some authors found the so-called resource (Ozturk, 2010; Sachs & Warner, 1995). The presence of low institutional quality or rent-seeking competition are usually some of the explanations for this stream of the literature (Parcero & Papyrakis, 2016; Torvik, 2002). In fact, having high quality institutions can help avoiding the resource curse (Havranek et al., 2016).
Natural resources abundance may also be correlated with greater levels of income inequality, since the distribution of natural capital tends to be more unequal distributed than physical or human capital (Gylfason & Zoega, 2002). Parcero and Papyrakis (2016) state that in the case of oil, this happens for extreme cases of oil abundance.
Despite there is no consensus on how natural resources affect the economy, particularly in the long-run, using a measure of economic performance which accounts for income inequality or institutional quality may offer broader comprehension of this relationship. Thus, using the ISEW instead of GDP may result in very different outcomes.
2.3 GLOBALIZATION
as a positive driver to economic development. Thus, some authors have emphasized the effects of globalization to the economy. Main research focus on trade openness or capital flows as proxies for globalization. For example, Dollar and Kraay (2001) found a positive relation between trade flows, foreign direct investment and economic growth. Other authors state that trade openness may result in higher levels of income inequality in both developed and developing countries (Beck et al., 1999).
As mentioned above, globalization is a wider phenomenon. Thus, it requires analysis from a broader scope, considering its different dimensions may affect economic performance in different ways (Dreher, 2006). The ISEW allows capturing the effects of those dimensions, examining the consequences of globalization on long-run welfare.
3. DATA AND METHOD
The main goal of this paper is to analyze both ISEW and GDP as measures of economic performance and to establish the relationship between globalization and natural resources exploitation with these indicators. Therefore, the first step was building an ISEW that can directly compare to GDP. The calculation of the ISEW is detailed in section 2.1.
To secure country-wide comparability and overcome one of the main barriers to the development of the ISEW as a relevant indicator, data availability for all the ISEW components and for the other variables that compound this study was the prior criteria to country selection. Accounting for a homogeneous group of countries, with common policies and similar standards of economic development, was also a concern, avoiding disparities within the ISEW components. Thus, a group of 14 high-developed OECD members was selected, namely Australia, Austria, Canada, Denmark, Finland, Germany, Ireland, Korea, Netherlands, Norway, Spain, Sweden, United Kingdom and United States. Using annual data, the time span from 1995 to 2013, which was the largest available for all the variables in study. All econometric techniques and estimations were performed using software Stata 13.0 and Eviews 9.0.
Figure 1. Comparison between mean GDP and ISEW per capita. Values in 2010 USD.
Regarding the first part of this paper, Fig.1 shows the evolution of the mean values for both GDP and ISEW per capita. The gap between both indicators is notable. While mean GDP per capita rose from 36330 USD in 1995 to 48503 USD in 2013, the mean ISEW per capita was almost stagnant, rising from 19849 USD to just 24764 USD over the same period. Although the panel is
0 10000 20000 30000 40000 50000 1995 1996 1997 1998 1999 2000 2001 2002 2003 2004 2005 2006 2007 2008 2009 2010 2011 2012 2013 2010 U S$ Years
Mean GDPpc vs Mean ISEWpc
is not reflected in sustainable economic welfare, which supports the idea of a threshold hypothesis. Different trends between both indicators also shows the inefficiency of GDP to measure sustainable economic welfare, consistent with (Costanza et al., 2009).
The second part of this paper focus on analyzing the effects of globalization and natural resources exploitation on both economic growth (GDPpc) and sustainable economic welfare (ISEWpc). The other variables included in this study are:
• Employment rate (TXEMP) as a proxy for labor. A higher employment rate results in higher disposable income. Therefore, a positive relationship with both GDP and ISEW per capita is expected;
• The Consumer Price Index (CPI) to account for the effects of inflation. CPI may have a negative effect on economic growth, particularly in developed countries, with better institutions. (Ibarra & Trupkin, 2016; Marques et al., 2016);
• Life expectancy at birth (LIFEEXP), to account for the effects of health on human capital. A positive relationship with both ISEW and GDP is expected (Frugoli et al., 2015; Were, 2015);
• Trade Openness (OPENNESS). Trade openness is the part of economic activity resulting from international trade. It is composed by the sum of all imports and exports divided by total GDP;
• Natural Resources Rents per capita (RENTSPC). Obtained by dividing the total natural resource rents by total population, it is included to capture the effects of natural resource abundance/dependence. A positive relationship with GDP is expected due to the financial benefits of natural resources exploitation. On the other hand, a negative relationship with the ISEW is expected, due to the depletion of natural capital;
• The KOF Index of Globalization (Dreher, 2006; Dreher & Dreher, 2016) is included to assess the impacts of globalization. The main advantage of this index is the detachment of the three dimensions of globalization. Therefore, economic (EKOF), social (SKOF) and political (PKOF) dimensions are included in this paper.
Two models were performed. One with economic growth (GDP per capita), and the other one with the sustainable economic welfare proxy (ISEW per capita) as dependent variables. An Autoregressive distributed lag (ARDL) approach was used to breakdown both short- and long-run dynamics. An ARDL model permits to decompose the variables into its short- and long-long-run effects. The most fitted estimator was selected after the specification tests.
Table 2. Descriptive Statistics and Cross-section dependence (CD) tests.1
Variable Descriptive statistics Cross section dependence (CD)
Obs Mean Std. Dev. Min. Max. CD-test Corr Abs(corr) LISEWPC 266 10.04865 0.2347551 9.148762 10.58951 24.62*** 0.592 0.641 LGDPPC 266 10.65327 0.351088 9.410764 11.42436 39.37*** 0.947 0.947 LTXEMP 266 4.532221 0.0441222 4.300003 4.584968 10.86*** 0.261 0.432 LCPI 266 4.81274 0.1266583 4.097372 4.702087 41.00*** 0.986 0.986 LLIFEEXP 266 4.369325 0.226005 4.295847 4.419781 41.03*** 0.987 0.987 LRENTSPC 266 5.260411 2.000246 0.5259663 9.273802 27.84*** 0.670 0.670 LOPENNESS 266 4.245564 0.4517299 3.097822 9.273802 19.70*** 0.474 0.619 LEKOF 266 4.365814 0.1604767 3.817314 4.59667 20.63*** 0.496 0.553 LSKOF 266 4.396134 0.1356682 3.849704 4.527115 33.04*** 0.795 0.795 LPKOF 266 4.488122 0.1071728 4.024765 4.575573 8.47*** 0.204 0.398
Table 2 displays the descriptive statistics and cross section dependence (CD) tests for all variables. Cross-section dependence is identified as a problem in macro panel data. Thus, Pesaran (2004) CD test was performed and suggest the presence of cross-section dependence. This means that the countries share common developments for all variables, consistent with the fact the panel is composed by high-income OECD members and have common policies and similar living standards.
To check for multicollinearity, the Variance Inflation Factor (VIF) test was computed (Table 3). The low values for the VIF statistics states that for these variables, multicollinearity is far from being a concern.
Table 3. Variance Inflator Factor (VIF) statistics2
Variable VIF 1/VIF
LLIFEEXP 4.06 0.246473 LCPI 3.72 0.268807 LEKOF 3.36 0.297539 LSKOF 3.26 0.306592 LRENTSPC 2.46 0.406453 LPKOF 2.28 0.437881 LOPENNESS 1.38 0.723584 LTXEMP 1.35 0.743470 Mean VIF 2.73
Good econometric practices recommend testing the adequacy of panel data techniques. The Lagrange Multiplier (LM) test was performed to check the existence of country-specific effects,
1 CD test was performed with the Stata routine xtcd and has N(0,1) distribution. Null hypothesis is
using both LISEWPC and LGDPPC as dependent variables, which proved the adequacy of panel techniques.
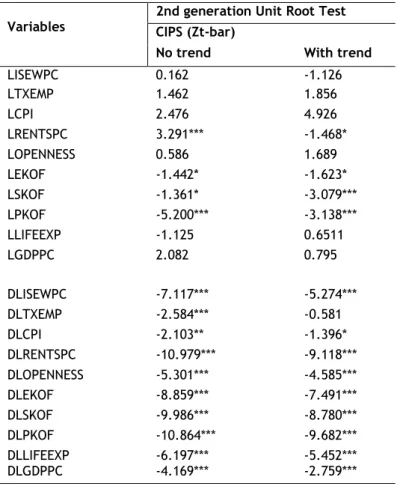
One of the main advantages of the ARDL approach is its robustness in the presence of I(0) or I(1) variables. Thus, to verify the order of integration of the variables, second generation panel unit root tests, namely the CIPS (Pesaran, 2007), were performed (Table 4). This test has the advantage of being robust in the presence of heterogeneity. Some variables can be identified as I(0), like LRENTSPC and LPKOF and LISEWPC, LTXEMP, LCPI. LEKOF and LLIFEEXP are I(1) or borderline I(1)/I(0). None of the variables is I(2), so the ARDL approach can be pursued.
Table 4. Panel Unit Root Test (CIPS)3
Variables 2nd generation Unit Root Test CIPS (Zt-bar) No trend With trend
LISEWPC 0.162 -1.126 LTXEMP 1.462 1.856 LCPI 2.476 4.926 LRENTSPC 3.291*** -1.468* LOPENNESS 0.586 1.689 LEKOF -1.442* -1.623* LSKOF -1.361* -3.079*** LPKOF -5.200*** -3.138*** LLIFEEXP -1.125 0.6511 LGDPPC 2.082 0.795 DLISEWPC -7.117*** -5.274*** DLTXEMP -2.584*** -0.581 DLCPI -2.103** -1.396* DLRENTSPC -10.979*** -9.118*** DLOPENNESS -5.301*** -4.585*** DLEKOF -8.859*** -7.491*** DLSKOF -9.986*** -8.780*** DLPKOF -10.864*** -9.682*** DLLIFEEXP -6.197*** -5.452*** DLGDPPC -4.169*** -2.759***
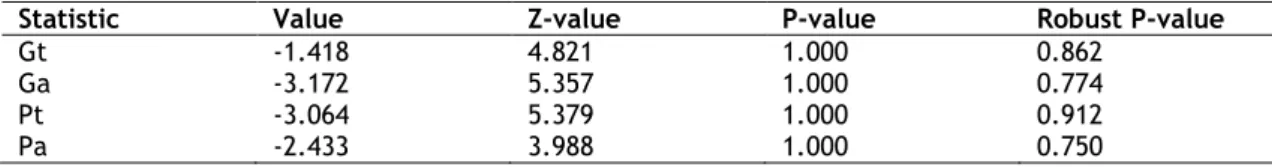
Following the outcomes of the unit root test, Westerlund (2007) test of co-integration was performed (Table 5), to check for co-integration among variables. To achieve robust results, bootstrapping is recommended. Thus, 500 reps were used. The presence of co-integration is strongly rejected, whether considering the panel as a whole (Pt and Pa tests) or considering each country individually (Gt and Ga tests).
Table 5. Westerlund Tests of Co-integration.4
Statistic Value Z-value P-value Robust P-value
Gt -1.418 4.821 1.000 0.862
Ga -3.172 5.357 1.000 0.774
Pt -3.064 5.379 1.000 0.912
Pa -2.433 3.988 1.000 0.750
4. RESULTS AND DISCUSSION
A series of tests were carried out to ascertain the validity of the estimations. First, the panel Lagrange Multiplier (LM) test was performed, with the null-hypothesis being rejected in both models (𝑋2= 850.74*** with LISEWPC as dependent variable and 1010.99*** with LGDPPC), which
supports the usage of panel data techniques.
A common characteristic in macro panels is heterogeneity. Thus, to cast for the most suitable panel estimator, the adequacy of the Mean Group (MG), Pooled Mean Group (PMG) or Dynamic Fixed Effects (DFE) ought to be tested. The models were estimated and then, the Hausman test was performed (Table 6).
Table 6. Hausman Tests5
Sustainable Development (LISEWPC) Models Economic Growth (LGDPPC) Models MG vs PMG MG vs DFE MG vs PMG MG vs DFE
60.19*** 0.00 37.45*** 0.00
The outcomes points DFE as the most suitable estimators. The DFE models implies homogeneity for all coefficients, and therefore, the panel is homogeneous, with similar behaviors. This is consistent with the fact the panel share common policies.
Considering this, specification tests were performed to check for heteroskedasticity and serial correlation in both models (Table 7).
Table 7. Specification tests6
Specification tests Sustainable Development DFE Model Economic Growth DFE Model
Walt test 819.74*** 176.73***
Woolridge test 106.248*** 47.946***
Considering the presence of cross-section dependence among variables and heteroskedasticity and first order autocorrelation in the DFE models, the Driscoll and Kraay (1998) estimator was used. This estimator is robust in the presence of this phenomena. In the economic growth models, the variable LLIFEEXP was not statistically significant and was removed to improve the statistical quality of the models.
5 Table 6- Hausman test. Null hypothesis: differences in coefficients are not systematic. The Stata routine
Table 8. Estimation results7
Sustainable Development Models Economic Growth Models
Variable DK DK’ DK DK’ DLTXEMP 1.9061354*** 1.997944*** 1.2102577*** 1.1515259*** DLCPI 0.30367919 -0.32552446** -0.38299278*** DLRENTSPC -0.02613914*** -0.02303236** 0.01091384** 0.01056886** DLOPENNESS -0.00261013 0.04813924* 0.06714717** DLEKOF 0.11561274 0.13279185* 0.08699618* DLSKOF 0.00848524 0.12030184*** 0.10070603** DLPKOF 0.2866746** 0.2961854*** -0.02242092 DLLIFEEXP 0.08646579 --- --- LISEWPC (-1) -0.37872085*** -0.35523408*** --- --- LGDPPC (-1) --- --- -0.16156352*** -0.12139148*** LTXEMP (-1) 0.77864243*** 0.79025483*** 0.19053171*** 0.16840149*** LCPI (-1) -0.05613363 0.0548831 LRENTSPC (-1) -0.01791549** -0.01623466** -0.00024654 LOPENNESS (-1) -0.0010344** -0.00080196** -0.00023305* LEKOF (-1) -0.009578 0.03787333* LSKOF (-1) 0.10712815 0.19427705*** 0.16307074*** LPKOF (-1) -0.0285898 -0.05926945*** -0.03894993*** LIFEEXP (-1) 1.8494311** 1.4233225** --- --- _CONS -7.6742801*** -6.0720824** -0.10152289 0.00991053 Statistics N 252 252 252 252 𝑅2 0.4882 0.4823 0.7248 0.709 F F(17,13)=2896.83*** F(9,13)=402.02** * F(15,13)=410.68*** F(9,13)=196.1***
Table 8 presents the Driscroll and Kraay estimations. For both models, the estimation was computed with all variables at first. Variables that were not statistically significant were then removed. DK’ denotes final estimations with only significant variables.
Considering the outcomes of table 8, short-run elasticities are presented in table 9. The long-run elasticities/impacts were computed. For sustainable development model (SD), the elasticities were obtained, dividing the coefficients of each variable by the coefficient of LISEWPC, lagged once and the total value divided by -1. For the economic growth model (EG), the same process was carried out, but dividing by the coefficient of LGDPPC.
Table 9. Elasticities/impacts and adjustment speed8
Sustainable Development Model (DK’) Economic Growth Model (DK’) Short-run elasticities/impacts DLTXEMP 1.997944*** DLTXEMP 1.1515259*** DLRENTSPC -0.02303236** DLCPI -0.38299278*** DLEKOF 0.13279185* DLRENTSPC 0.01056886** DLPKOF 0.2961854*** DLOPENNESS 0.06714717** DLPKOF 0.10070603**
7 Table 8- Estimation results. ***, **, * denote statistical significance at 1%, 5% and 10% levels, respectively.
Stata routine xtscc was used to compute the estimations.
8 Elasticities/impacts and adjustment speed. ***, **, * denotes significance at 1%, 5% and 10% levels. ECM
Computed long-run elasticities/impacts LTXEMP 2.17922*** LTXEMP 0.4888208* LRENTSPC -0.0463809** LSKOF 1.96178*** LOPENNESS -0.0024383*** LPKOF -0.3437994*** LLIFEEXP 3.905232*** Speed of adjustment ECM -0.35523408*** ECM -0.12139148***
As expected, in both models, the employment rate has a positive impact on both short- and long-run, and significant at 1% level. Having a higher employment rate means higher disposable income. Despite the differences between the measures, labor is found to be a positive input for both sustainable development and economic growth. Life expectancy at birth has also a positive long-run impact on SD model. This means that for sustainable development, health is a positive driver in the long-run. These variables hence the importance of human capital to economic performance.
The negative impact of inflation on short-run economic growth is justified by the composition of the panel, namely OECD high-developed countries. As mentioned in section 3, inflation may have negative effects on economic growth, especially in high-developed, near steady-state countries (Ibarra & Trupkin, 2016).
Accounting for the changes in natural capital is the main difference between the ISEW and GDP methodologies (Kubiszewski et al., 2013). Thus, as expected, natural resource rents per capita has a positive impact on short-run economic growth and negative impacts on both short- and long-run on sustainable development. These different impacts hence the argument that GDP only considers the financial benefits of resource abundance. The degradation of natural capital, through resource depletion and the environmental costs of resource exploitation, exceeds the benefits it generates to sustainable economic welfare (Costanza et al., 2009; Gaspar et al., 2017).
The relationship between globalization and both SD and EG was studied by the inclusion of trade openness and the KOF Index of Globalization (Dreher, 2006). While the former intends to state the importance of the international trade flows to the economy, the latter is an indicator which considers the economic, political and social dimensions of globalization. Considering this, trade openness (LOPENNESS) has a positive impact on short-run EG and a negative impact on long-run SD. The positive impact on economic growth is explained through the direct financial benefits of international trade to domestic demand. On the other hand, trade openness may increase income inequality (Beck et al., 1999; Dollar & Kraay, 2001), and therefore have a negative impact long-run economic welfare.
international position of a country is usually used in ISEW methodology (Beça & Santos, 2010) as a positive welfare driver. On the other hand, considering the panel is composed by politically integrated countries (OECD members), in long-run, the costs of additional international presence do not contribute to increase economic growth.
Social globalization is identified with a positive long-run impact on economic growth, which hence the long-run contributions of social proximity between countries as well as the social development.
5. CONCLUSIONS AND POLICY IMPLICATIONS
This paper intended to compare both ISEW and GDP as measures of economic performance and to establish the effects of natural resources exploitation and globalization on both indicators. Panel data techniques were applied, namely DFE and DK estimators, to a panel composed by 14 OECD high-developed countries.
Considering the first part of the paper, the ISEW is an indicator which compounds economic, social and environmental items, accounting for changes in natural, social and human capital. The focus was on building an ISEW which allowed to country-wide comparability, and therefore, to overcome some critiques to the ISEW methodology, namely, the lack of a standardized methodology and ambiguity on its components (Neumayer, 2000). Thus, the ISEW was computed using established framework (Gaspar et al., 2017; Marques et al., 2016; Menegaki & Tugcu, 2016, 2017). The gap between both indicators (Fig.1) hence the differences when measuring sustainable development vs economic growth.
Regarding to the second part of this paper, the focus was on to directly compare the short- and long-run effects of natural resources exploitation and globalization on both indicators. While some of the variables show similar impacts on both SD and EG, namely the employment rate and short- run political globalization, the different impacts of some variables reveal the differences between both indicators. While natural resource rents per capita has a positive impact on GDP per capita in the short-run, a negative impact is found in ISEW per capita in both short- and long-run. These results demonstrate that enhancing GDP does not account for the impacts of changes in natural capital and that natural resource exploitation may represent a hazard to sustainable development.
The usage of KOF Index permits to capture the effects of different dimensions of globalization. GDP per capita brings together, in a better way, the impacts of the KOF components, which may state that the items that compose the index are not perfectly accurate to measure long-run sustainable development. Trade openness may have a long-long-run negative impact on ISEW per capita, due to increased income inequality. Other results show that political globalization may boost both EG and SD in the short-run, and that social globalization has a positive impact on long-run economic growth.
This paper contributes to the establishment of the ISEW as a standardized economic indicator. Future research on this topic would benefit from accounting for the social costs in the ISEW framework which would permit a deepening of the ISEW concept into a better measure of economic performance. This would require a better statistical report from all countries, making
Despite the actual limitations, policy makers ought to consider the ISEW as an alternative and more accurate measure of economic development, should implement policies that reduce the depletion of natural resources to guarantee the sustainability of human activity, and confine the harmful effects of globalization to enhance economic development and create more welfare.
6. REFERENCES
Beça, P., & Santos, R. (2010). Measuring sustainable welfare: A new approach to the ISEW.
Ecological Economics, 69(4), 810–819. https://doi.org/10.1016/j.ecolecon.2009.11.031
Beça, P., & Santos, R. (2014). A comparison between GDP and ISEW in decoupling analysis.
Ecological Indicators, 46, 167–176. https://doi.org/10.1016/j.ecolind.2014.06.010
Beck, T., Demirgüç-kunt, A., Levine, R., Demirguc-Kunt, A., & Levine, R. (1999). A New Database on Financial Development and Structure. The World Bank Economic Review,
14(3), 597–605. https://doi.org/10.1093/wber/14.3.597
Bleys, B. (2008). Proposed changes to the Index of Sustainable Economic Welfare: An application to Belgium. Ecological Economics, 64(4), 741–751. https://doi.org/10.1016/j.ecolecon.2007.10.013
Brunnschweiler, C. N., & Bulte, E. H. (2008). The resource curse revisited and revised: A tale of paradoxes and red herrings. Journal of Environmental Economics and Management,
55(3), 248–264. https://doi.org/10.1016/j.jeem.2007.08.004
Castañeda, B. E. (1999). An index of sustainable economic welfare (ISEW) for Chile. Ecological
Economics, 28(2), 231–244. https://doi.org/10.1016/S0921-8009(98)00037-8
Clarke, M., & Islam, S. M. N. (2005). Diminishing and negative welfare returns of economic growth: An index of sustainable economic welfare (ISEW) for Thailand. Ecological
Economics, 54(1), 81–93. https://doi.org/10.1016/j.ecolecon.2004.10.003
Cobb, C., Halstead, T., & Rowe, J. (1995). If the GDP is Up , Why is America Down ? The Atlantic,
267(4), 50–78.
Costanza, R., Hart, M., Posner, S., & Talberth, J. (2009). Beyond GDP : The Need for New Measures of Progress Beyond GDP : The Need for New Measures of Progress. Boston
University, (4), 1–47. https://doi.org/0109 970401
Daly, H., Cobb, J., & Cobb, C. (1994). For the Common Good: Redirecting the Economy Toward
Community, the Environment and a Sustainable Future.
Dollar, D., & Kraay, A. (2001). Trade , Growth , and Poverty. Social Science Research Network,
Dreher, A. (2006). Does Globalization Affect Growth? Evidence from a New Index of Globalization. Applied Economics, 38(6), 1091–1110. https://doi.org/10.1080/00036840500392078
Dreher, A., & Dreher, A. (2016). Does globalization affect growth ? Evidence from a new index of globalization Does globalization affect growth ? Evidence from a new index of globalization, 6846(March). https://doi.org/10.1080/00036840500392078
Driscoll, J. C., & Kraay, A. C. (1998). Consistent covariance matrix estimation with spatially dependent panel data. Review of Economics & Statistics, 80(4), 549–560. https://doi.org/10.1162/003465398557825
European Commission. (2011). EC COMMUNICATION: Roadmap to a Resource Efficient Europe.
European Commission, 32. https://doi.org/COM(2011) 571 final
Fisher, I. (1906). The Nature of Capital and Income. Kelley, New York, NY.
Frugoli, P. A., Almeida, C. M. V. B., Agostinho, F., Giannetti, B. F., & Huisingh, D. (2015). Can measures of well-being and progress help societies to achieve sustainable development?
Journal of Cleaner Production, 90, 370–380.
https://doi.org/10.1016/j.jclepro.2014.11.076
Gaspar, J. dos S., Marques, A. C., & Fuinhas, J. A. (2017). The traditional energy-growth nexus: A comparison between sustainable development and economic growth approaches.
Ecological Indicators, 75, 286–296. https://doi.org/10.1016/j.ecolind.2016.12.048
Gigliarano, C., Balducci, F., Ciommi, M., & Chelli, F. (2014). Going regional: An index of sustainable economic welfare for Italy. Computers, Environment and Urban Systems, 45, 63–77. https://doi.org/10.1016/j.compenvurbsys.2014.02.007
Gylfason, T., & Zoega, G. (2002). Inequality and Economic Growth: Do Natural Resources Matter? CESifo GmbH, CESifo Working Paper Series: CESifo Working Paper No.712, 2002,
(March). Retrieved from
http://search.proquest.com/docview/56669804?accountid=17248
Hák, T., Janoušková, S., & Moldan, B. (2016). Sustainable Development Goals: A need for relevant indicators. Ecological Indicators, 60, 565–573. https://doi.org/10.1016/j.ecolind.2015.08.003
Havranek, T., Horvath, R., & Zeynalov, A. (2016). Natural Resources and Economic Growth: A Meta-Analysis. World Development, 88(609642), 134–151.
Horváth, R., & Zeynalov, A. (2014). The Natural Resource Curse in Post-Soviet Countries : The Role of Institutions and Trade Policies. Working Papers. Retrieved from https://ideas.repec.org/p/ost/wpaper/341.html#?
Ibarra, R., & Trupkin, D. R. (2016). Reexamining the relationship between inflation and growth: Do institutions matter in developing countries? Economic Modelling, 52, 332–351. https://doi.org/10.1016/j.econmod.2015.09.011
Jackson. (1996). Sustainable Economic Welfare in Sweden. Stkckholm Environment Institute. Khan, S. A. R., Zaman, K., & Zhang, Y. (2016). The relationship between energy-resource
depletion, climate change, health resources and the environmental Kuznets curve: Evidence from the panel of selected developed countries. Renewable and Sustainable
Energy Reviews, 62, 468–477. https://doi.org/10.1016/j.rser.2016.04.061
Kubiszewski, I., Costanza, R., Franco, C., Lawn, P., Talberth, J., Jackson, T., & Aylmer, C. (2013). Beyond GDP: Measuring and achieving global genuine progress. Ecological
Economics, 93, 57–68. https://doi.org/10.1016/j.ecolecon.2013.04.019
Kuznets, S. (1934). National Income, 1929-1932. In NBER, National Bureau of Economic
Research (pp. 1–12). Retrieved from http://www.nber.org/chapters/c2258
Lawn, P. A. (2003). A theoretical foundation to support the Index of Sustainable Economic Welfare (ISEW), Genuine Progress Indicator (GPI), and other related indexes. Ecological
Economics, 44(1), 105–118. https://doi.org/10.1016/S0921-8009(02)00258-6
Marques, A. C., Fuinhas, J. A., & Gaspar, J. D. S. (2016). On the Nexus of Energy Use - Economic Development: A Panel Approach. Energy Procedia, 106, 225–234. https://doi.org/10.1016/j.egypro.2016.12.118
Max-Neef, M. (1995). Economic growth and quality of life: A threshold hypothesis. Ecological
Economics, 15, 115–118. https://doi.org/10.1016/0921-8009(95)00064-X
Menegaki, A. N., & Tsagarakis, K. P. (2015). More indebted than we know? Informing fiscal policy with an index of sustainable welfare for Greece. Ecological Indicators, 57, 159–163. https://doi.org/10.1016/j.ecolind.2015.04.037
Menegaki, A. N., & Tugcu, C. T. (2016). Rethinking the energy-growth nexus: Proposing an index of sustainable economic welfare for Sub-Saharan Africa. Energy Research and Social
in G7 countries; A comparison with the conventional nexus. Renewable and Sustainable
Energy Reviews, 69(November 2016), 892–901.
https://doi.org/10.1016/j.rser.2016.11.133
Neumayer, E. (2000). On the methodology of ISEW, GPI and related measures: Some constructive suggestions and some doubt on the “threshold” hypothesis. Ecological
Economics, 34(3), 347–361. https://doi.org/10.1016/S0921-8009(00)00192-0
Ozturk, I. (2010). A literature survey on energy-growth nexus. Energy Policy, 38(1), 340–349. https://doi.org/10.1016/j.enpol.2009.09.024
Parcero, O. J., & Papyrakis, E. (2016). Income inequality and the oil resource curse. Resource
and Energy Economics, 45, 159–177. https://doi.org/10.1016/j.reseneeco.2016.06.001
Pesaran, M. H. (2004). General Diagnostic Tests for Cross Section Dependence in Panels General Diagnostic Tests for Cross Section Dependence in Panels. SSRN Electronic Journal,
1229(August).
Pesaran, M. H. (2007). A simple panel unit root test in the presence of cross-section dependence. Journal of Applied Econometrics, 22(2), 265–312. https://doi.org/10.1002/jae.951
Sachs, J. D., & Warner, A. M. (1995). Natural Resource Abundance and Economic Growth. NBER
Working Paper, No. 5398.
Saunoris, J. W., & Sheridan, B. J. (2013). The dynamics of sectoral electricity demand for a panel of US states: New evidence on the consumption-growth nexus. Energy Policy, 61, 327–336. https://doi.org/10.1016/j.enpol.2013.05.092
Solt, F. (n.d.). Standardizing the World Income Inequality, 1–16.
Solt, F. (2016). The Standardized World Income Inequality Database*. Social Science Quarterly,
97(5), 1267–1281. https://doi.org/10.1111/ssqu.12295
Stockhammer, E., Hochreiter, H., Obermayr, B., & Steiner, K. (1997). The index of sustainable economic welfare (ISEW) as an alternative to GDP in measuring economic welfare.
Ecological Economics, 21, 19–34.
Torvik, R. (2002). Natural resources, rent seeking and welfare. Journal of Development
Economics, 67(2), 455–470. https://doi.org/10.1016/S0304-3878(01)00195-X
https://doi.org/eISBN: 978-92-1-060036-1
UNEP. (2011). Decoupling Natural Resource Use and Environmental Impacts from Economic
Growth. International Resource Panel. Retrieved from
http://www.unep.org/resourcepanel/decoupling/files/pdf/Decoupling_Report_English.p df
United Nations World Commission on Environment and Development. (1987). Report of the World Commission on Environment and Development : Our Common Future Acronyms and Note on Terminology Chairman â€TM s Foreword, 300.
Were, M. (2015). Differential effects of trade on economic growth and investment: A cross-country empirical investigation. Journal of African Trade, 2(1–2), 71–85. https://doi.org/10.1016/j.joat.2015.08.002
Westerlund, J. (2007). Testing for Cointegration in Panel Data. Oxford Bulletin of Economics