DIFFERENCES IN KNEE SENSORIMOTOR CONTROL
BY PHYSICAL ACTIVITY LEVEL AND SEX
DIFERENÇAS NO CONTROLE SENSORIMOTOR DO JOELHO
POR NÍVEL ATIVIDADE FÍSICA E SEXO
C
ristóbals
anM
artín-M
ohr1,2, a
ndrésV
alladares2,3, i
VerC
risti4, F
ranCisCoJ
oséb
erral5, C
laudioo
yarzo2,6, F
ernandol
ira41. Carrera de Kinesiología, Departamento Ciencias de la salud, Facultad de Medicina, Pontificia Universidad Católica de Chile, Santiago, Chile. 2. Clínica MEDS, Santiago, Chile.
3. Universidad Finis Terrae, Santiago, Chile.
4. Escuela de Kinesiología, Facultad de Ciencias, Universidad Mayor, Chile 5. Universidad Pablo de Olavide ES-41013 Sevilla, Spain.
6. Universidad de los Andes, Santiago, Chile.
Citation: Martín-Mohr CS, Valladares A, Cristi I, Berral FJ, Oyarzo C, Lira F. Differences in knee sensorimotor control by physical activity level and sex. Acta Ortop Bras. [online]. 2019;27(1):20-6. Available from URL: http://www.scielo.br/aob.
Study was conducted at the Clínica MEDS, Santiago Chile.
Correspondence: Cristóbal San Martín-Mohr Isabel La Católica 3740, Las Condes. Santiago. Chile. cristobalsanmartin@hotmail.com All authors declare no potential conflict of interest related to this article.
Article received in 01/11/2017, approved in 10/04/2018. ABSTRACT
Objective:The aim of this study was to compare the differences
in knee sensorimotor control between healthy men and women by measuring the joint position sense (JPS), sensation of muscle tension (steadiness), and onset of muscle activation (OMA). Meth-ods: Twenty-four healthy women and 27 healthy men were tested. Knee sensorimotor control was assessed using the JPS test with electrogoniometers in 3 different ranges of motion, sensation of muscle tension using the isometric steadiness technique, and OMA against a mechanical perturbation. Each assessment was compared by sex, physical activity level, and right or left lower limb. Results: The men obtained better values in the JPS test between 90º and 60º and between 30º and 0º than the women. The subjects with higher levels of physical activity also showed better values, between 90º and 60º and between 30º and 0º. The best results for steadiness were found in the women and the subjects with higher levels of physical activity. In the OMA test, no significant differences were found in the studied variables. Conclusion: The results suggest that higher levels of physical activity may determine better sensorimotor control. Men have better articular sensation, and
women have better muscle strength control. Level of evidence III,
Cross sectional study.
Keywords:Knee. Physical Activity. Proprioception.
RESUMO
Objetivo: O objetivo desse estudo foi comparar as diferenças no controle sensório-motor de joelho entre mulheres e homens saudáveis medindo o sensação da posição articular (SPA), Coeficiente de variações da força (Steadiness) e inicio ou ativação muscular (IAM) Métodos: Foi avaliado 24 mulheres saudáveis e 27 homens saudáveis, realizando avaliações de SPA, o Sensação de tensão muscular (Steadiness) e o IAM, comparadas segundo sexo, nível de atividade física e extremidades inferiores direita ou esquerda. Resultados: SPA: Os homens obtiveram melhores valores nessa prova entre 90-60° (p=0,0127) e em 30-0° (p=0,0017) ao comparado com as mulheres. as pessoas com maior nível de atividade física também se encontram melhores resultados entre 90-60° (p=0,0328) e 30-0° (p=0,0173). STEADINESS: Os melhores resultados foram para as mulheres em ambas extremidades (direita p=0,0002 e esquerda p=0,0009) e pes-soas com maior nível de atividade física (direita p=0,0065 e esquerda p=0,0173). Para IAM não foi encontrado diferenças significativas nas variáveis estudadas. Conclusão: Os resultados sugerem que tanto maior nível de atividade física puderam determinar maior resultado no controle sensório-motor. Os homens tiveram maior sensação articular e as mulheres maior controle steadiness. Nível de evidência III, Estudo transversal.
Descritores:Joelho. Atividade física. Propriocepção.
O
riginala
rticleDOI: http://dx.doi.org/10.1590/1413-785220192701174327
INTRODUCTION
The sensorimotor system (SSM) is responsible for transporting and integrating the sensory and motor information, central integration and processing of all components involved in maintaining articular
homeostasis during body movements.1 This means that the SSM
provides functional joint stability throughout human movements and an inadequate functioning of this system can predispose
to articular injuries.2 Recent studies have shown that there are
difference when evaluating the SSM between sex.3 Moreover, SSM
differences have been found between at different levels of activity.4
Therefore, studies assessing the difference between gender and activity level are needed.
sense (JPS), steadiness and onset of muscle activation, relating them to level of physical activity, gender and differences between the two extremities.
MATERIALS AND METHOD Subjects
The sample is composed of 51 voluntary healthy subjects; 27 men (24,27 ± 3,28 years; 1,76 ± 0,06 m; 75,91 ± 8,54 Kg) and 24 women (24,67 ± 3,53 years; 1,64 ± 0,06 m; 58,71 ± 8,73 Kg), with a level
of physical activity with a score of 2 to 8 on the Tegner´s scale.5
Each one of the participants signed an informed consent previous to the assessments that were performed. This study was approved by the bioethics committee of the Pontificia Universidad Católica de Chile (Protocol number 14-146).
Outcomes Measurement
JPS Test
The aim of this test was to evaluate JPS, the ability of subjects to actively replicate a previously determined joint position. A uniax-ial electrogoniometer (Kinectecnic Ltda, Santiago, Chile) for the measurement of the knee articular angle in 3 ranges of motion was used: 90º – 60º, 60º – 30º y 30º – 0º (Figure 1A). The subject was in sitting position with their knees initially in 90° of flexion. In each repetition the difference between the angle reached by the subject and the target angle is calculated by averaging the difference of 10 repetitions for each angle and extremity. For signal processing, the Igor Pro 6.0 (WaveMetrics Inc, Lake Oswego, USA) program was used.
Steadiness. Sensation of muscle tension
The purpose of this assessment was to evaluate the ability of subjects to maintain a constant force at 15% of maximum voluntary
isometric contraction, which reflects fine muscle control.6 First, the
maximum voluntary isometric contraction (MVIC) was assessed. The patient was sitting with a knee flexion angle of approximately 90º anchoring to the distal end of the leg a load cell where the subjects were asked to perform a maximum isometric voluntary contraction of the extensor muscles of the knee. This was measured using an S beam load cell (Interface, Arizona, USA). The signal was captured using a Trigno Wireless System (Delsys, Boston, USA) with a sampling frequency of 2000 Hz.
Knee isometric steadiness was evaluated with the same setup as the MVIC assessment. Each subject was asked to exert knee extensor force to reach a specific target, a trapezoidal figure which represented the 15% of their MVIC (Figure 1B). Subjects were asked to reproduce this paradigm that lasted 20 seconds. To quantify fine muscular control, the coefficient of variation was calculated between the paradigm displayed on the screen and the exerted force of the the subject
Onset of Muscle Activation
The onset of muscle activation in the knee muscles was estimated utilizing surface electromyography, a method that was previously
used in other studies.7 EMG bipolar sensors (Delsys, Boston, USA)
were positioned on the vastus medialis, vastus lateralis, semiten-dinosus, and biceps femoris muscles of each subject according
to SENIAM recommendations.8 The subjects were ask to stand
over two destabilizing platforms (Figure 1C). A sudden fall of the platforms causes 20° of inversion at the ankle in a weight-bearing condition. The drop of the platforms was captured with a triaxial accelerometer, which was synchronized with sEMG signals. Both signals were sampled at 2000 hz. Activation latency for each muscle was calculated as delta time between the onset of acceleration during perturbation and onset of muscle activation.
Figure 1. (A) Shows the joint position sense test with the uniaxial elec-trogoniometer. (B) Shows the steadiness test with the load cell and the paradigm to 15% of the MVIC. (C) Shows the knee muscle onset test with the position of the sEMG sensors and the platform.
A
B
Each one of the assessments was performed on both extremities in all subjects.
In order to make comparisons, subjects were divided into different groups depending on their individual characteristics (Table 1). In all assessments, each of the data obtained between the different groups was compared.
Statistical analysis
To evaluate the normal distribution of the data the Shapiro-Wilk test was used. The difference mean test was used in the case of data with normal distribution and the signed rank Wilcoxon test otherwise. A statistically significant result was considered when the p value was less than or equal to 0.05. STATA 9.1 software was used for the statistical analysis. For the different measured tests (JPS, Steadiness and onset of muscle activation) gender differences, differences between groups with different levels of physical activity, differences between the dominant and non-dom-inant limb, and differences between right versus left limb of the same subject were compared.
RESULTS JPS Test
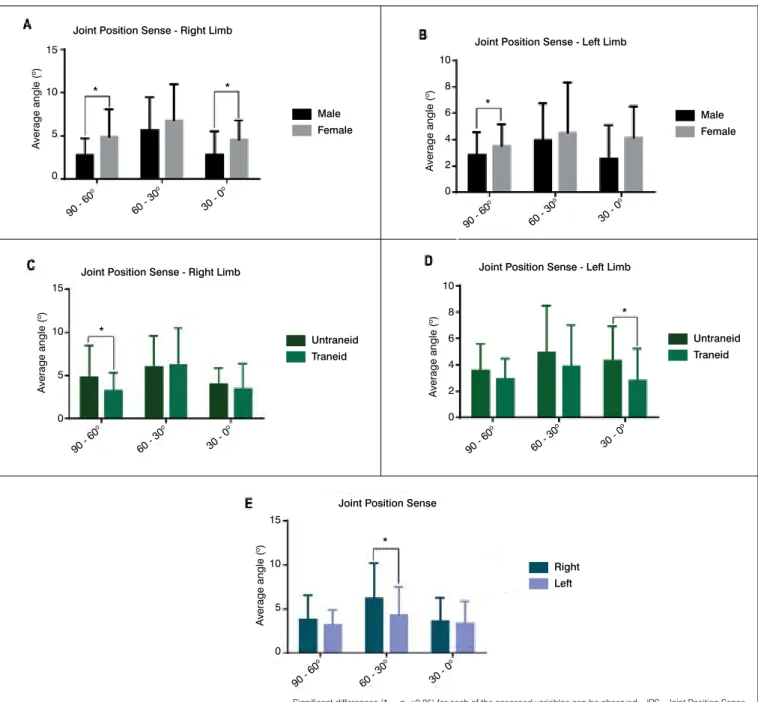
A significant difference was found between men and women in the knee JPS test at 90º-60° (p=0,0127) and at 30º-0° (p=0,0034) when comparing the right extremities of both genders (Figure 2 A). When comparing left extremities a significant difference was found in the range of 60º-90° (p=0,0034) (Figure 2 B). In both comparisons men had better results.
The group with higher level of physical activity had significantly better values in at 90º-60° (p=0,0328) in the right limb and 30º-0° (p=0,0173) in the left limb compared with the group that per-formed a lower level of physical activity (Figure 2 C and 2 D). No significant differences were found when comparing the dominant limb with the non dominant limb, however the results showed that the left limb showed better results in JPS at 60º-30° (p = 0.0048) (Figure 2 E). (Table 2 A, B)
Steadiness
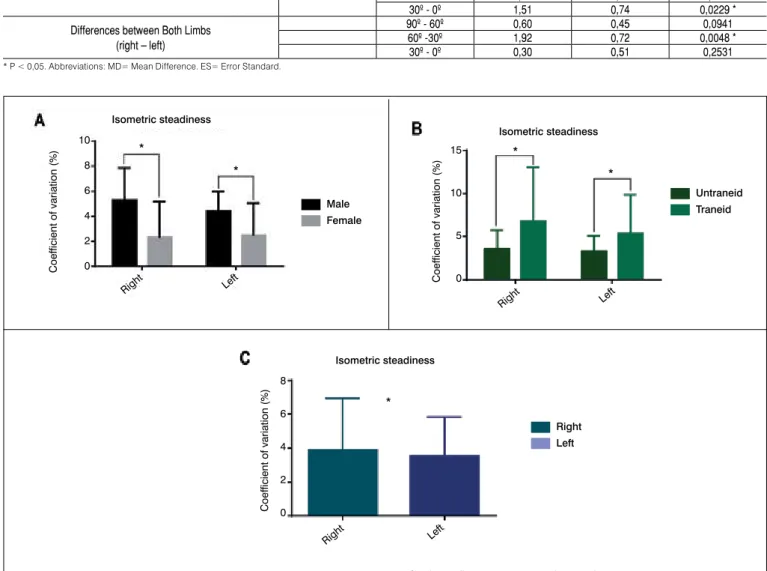
Women had significant better values compared to men in the right (p=0,0002) and left limb (p=0,0009), (Figure 3 A). The group with higher level of physical activity had significant better values in right steadiness (p=0,0065) and left (p=0,0173) compared to the group that performed a lower level of physical activity (Figure 3 B). (Table 3 A, B)
Onset of Muscle Activation
The left limb showed better results in the timing of muscle onset for vastus medialis (p = 0.0466) when compared with the right leg. (Figure 4 E). (Table 4 A, B)
DISCUSSION JPS Test
Previous studies have demonstrated significant differences between men and women when comparing knee
propriocep-tion.3,9 In these studies women present reduce proprioception
ability, which is consistent with the data obtained in our study where worse values in joint repositioning are shown in the female population in the most extreme measurement ranges (90º-60º y 30º-0º). A possible explanation for this is that women have greater articular laxity, so capsuloligamentous receptors would need a greater stimulus to trigger a response equal to that of
men.1 Men also have a higher proportion of muscle mass, which
could provide them with more quantity of musculotendinous proprioceptive receptors.
Subjects with a lower level of physical activity also presented worse
values in knee JPS. Some studies in professional footballers4
and in elite tennis players10 agree with our data and confirm
that physical activity level is also a factor that can influence the proprioceptive assessment performance. Moreover, higher proprioception ability have been found in competitive athletes
.11 Therefore, it is possible to hypothesized that training enhance
the proprioception ability.
In this study no significant differences were found between the dominant and non-dominant limb. However, when comparing the left and right limb (i.e.: without considering dominance) we found better values in the joint repositioning test in the left side.
This is consistent with the results published by Daniel J. Goble12
, which indicates a close relationship between the left side of the body and the right hemisphere of the brain. Moreover, Na-tio et al. used a regional map with neuroimaging of the brain’s response while applying vibrations to tendons and found that the proprioceptive signals from the proprioceptive receptors generated more information to the right hemisphere of the brain, so the left side of the body should have better proprioceptive
values.13,14 Therefore, it seems that the left lower limb have better
proprioceptive performance.
Steadiness
The results of the present study also show better steadiness values in the group of women as compared to men, as the study
of Brown et al.15According to this study, the main difference
in steadiness is attributable to the absolute muscle strength, which is higher in men compare to women. Regarding to the physical activity level, results show that subjects with a higher level of physical activity present better isometric steadiness than sedentary subjects. Different studies have shown that strength training improves isometric steadiness due to sensorimotor control improvements, which would explain the better result in trained
subjects.16,17 Moreover, this assessment has be related to a
greater risk of injury, as seen in various publications that patients
with anterior cruciate ligament reconstruction.18 Therefore, this
assessment provides an insight in muscle function and may be use in other clinical settings.
Onset of Muscle Activation
No significant differences were found in most of the onset of muscle activation. Nevertheless, other studies have found that healthy people that have greater anterior knee laxity present an increase in
timing of muscle onset of biceps femoris.19 If there is an increased
time of muscle onset, it can compromise joint stability, being similar to what happens when there is a ligament injury and damage to receptors that send the afferent signal, and the signal initiating this reflex may be compromised.
Table 1. Mean +/- (standard deviation) of demographic data for subjects who complete the 3 evaluations.
Variable Groups
Gender Men (n=27) Women (n=24)
Level of physical activity
Tegner´s scale More than 5 (n=28) Less or equal to 5 (n=23)
Age Older than 25 years (n=18) Younger or equal to
25 years (n=33)
Dominance Dominant limb
(n=51) Non dominant limb (n=51)
Extremity Right (n = 51) Left (n=51)
Table 2 A. Means Angles Values for Joint Position Sense by gender, physical activity or both limbs.
Variable Indicator Limb Mean
90º -60º SD
Mean
60º - 30º SD
Mean
30º - 0º SD
Gender
Male Right 2,75 1,95 5,59 3,87 2,79 2,71
Left 2,82 1,73 3,96 2,79 2,56 2,53
Female Right 4,88 3,18 6,78 4,20 4,52 2,25
Left 3,51 1,65 4,52 3,80 4,13 2,40
Level of physical activity
Tegner > 5
Right 3,24 2,07 6,24 4,27 3,42 2,94
Left 2,93 1,53 3,88 3,13 4,92 3,55
Tegner
≤ 5
Right 4,77 3,71 5,97 3,62 3,97 1,89
Left 3,57 2,01 4,92 3,55 4,31 2,59
Limb Right 3,75 2,79 6,15 4,03 3,60 2,63
Left 3,14 1,71 4,22 3,28 3,30 2,57
Values expressed in degrees. Abbreviations: SD: Standard Deviation.
Joint Position Sense - Right Limb
Joint Position Sense - Right Limb
Joint Position Sense
Significant differences (* = p <0.05) for each of the assessed variables can be observed. JPS=Joint Position Sense.
Joint Position Sense - Left Limb
Joint Position Sense - Left Limb Male
Female
Untraneid
Traneid
Untraneid Traneid
Right
Left
Male Female *
*
*
* *
*
A
verage angle (
o)
A
verage angle (
o)
A
verage angle (
o)
A
verage angle (
o)
A
verage angle (
o)
15
10
5
0
15
10
5
0
15
10
5
0
10
8
6
4
2
0
10
8
6
4
2
0
90 - 60 o
90 - 60 o
90 - 60 o
90 - 60 o
90 - 60 o 60 - 30
o
60 - 30 o
60 - 30 o
60 - 30 o
60 - 30 o 30 - 0
o
30 - 0 o
30 - 0 o
30 - 0 o
30 - 0 o
Table 3 A. Mean Percentages for Values Steadiness by gender, physical activity or limb evaluated.
Variable Indicator Right Limb Mean SD
Left Limb Mean SD
Gender Male 5,28 2,57 4,44 1,55
Female 2,32 2,86 2,49 2,58
Level of physical activity
Tegner > 5 3,50 2,24 3,28 1,79
Tegner ≤ 5 6,71 6,23 5,38 4,45
Limb 3,88 3,07 3,52 2,30
Values expressed in percentage. Abbreviations: SD: Standard Deviation.
Table 2 B. Comparison of Means Angles Values for Joint Position Sense between gender, physical activity or both limbs.
Evaluation Limb Range MD ES P. Value
Differences between gender (Female – Male)
Right
90º - 60º 2,12 1,95 0,0127 *
60º - 30º 1,18 1,13 0,3358
30º - 0º 1,73 0,70 0,0017 *
Left
90º - 60º 0,68 0,47 0,1311
60º -30º 0,56 0,92 0,8949
30º - 0º 1,57 0,69 0,0034 *
Differences between Level of physical activity (Lower– Higher)
Right
90º - 60º 1,52 0,80 0,0328 *
60º - 30º - 0.27 1,20 0,4109
30º - 0º 0,54 0,78 0,2450
Left
90º - 60º 0,64 0,50 0,1062
60º -30º 1,03 0,97 1,0374
30º - 0º 1,51 0,74 0,0229 *
Differences between Both Limbs (right – left)
90º - 60º 0,60 0,45 0,0941
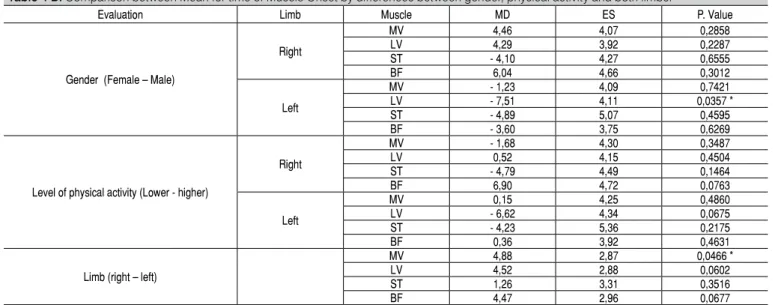
60º -30º 1,92 0,72 0,0048 *
30º - 0º 0,30 0,51 0,2531
* P < 0,05. Abbreviations: MD= Mean Difference. ES= Error Standard.
Table 3 B. Comparison of Mean Percentage for Values Steadiness by differences between gender, physical activity or both limbs.
Evaluation Limb MD ES P. Value
Gender (Female – Male)
Right - 2,90 0,70 0,0002*
Left - 1,90 0,50 0,0009*
Level of physical activity (Lower – Higher)
Right 3,20 1,20 0,0065*
Left 2,00 0,90 0,0173*
Limb
(right – left) 0,30 0,50 0,2531
* P < 0,05. Abbreviations: MD= Mean Difference. ES= Error Standard.
Isometric steadiness
Isometric steadiness
Isometric steadiness
Significant differences (* = p <0.05) for each of the assessed variables can be observed.
Male Female
Right Left *
* *
*
*
*
Coefficient of variation (%)
Coefficient of variation (%)
Coefficient of variation (%)
10
8
6
4
2
0
8
6
4
2
0
15
10
5
0
Right
Right
Right Left
Left
Left
Figure 3. Results for isometric steadiness for the comparisons between male - female, trained - untrained and right limb -left limb. All data shown as median and standard deviation. (A) It shows the coefficient of variation for the isometric steadiness for males and females. (B) It shows the coefficient of variation for the isometric steadiness for trained and untrained. (C) It shows the coefficient of variation for the isometric steadiness for right limb and left limb.
Muscular onset - Right Limb
Muscular onset - Right Limb
Muscular onset
Muscular onset - Left Limb
Muscular onset - Left Limb Male
Female
Untraneid Traneid
Untraneid Traneid
Male
Female
*
*
*
*
T
ime (ms)
T
ime (ms)
T
ime (ms)
T
ime (ms)
T
ime (ms)
150
100
50
0
150
100
50
0
150
100
50
0
150
100
50
0
150
100
50
0
VM
VM VM
VM VL
VL VL
VL ST
ST ST
ST BF
BF BF
BF
Figure 4. Results for muscular onset for the comparisons between male - female, trained - untrained and right limb -left limb. All data shown as median and standard deviation. (A) It shows time of muscular onset for the right limb, for males and female. (B) It shows time of muscular onset for the left limb, for males and females. (C) It shows time of muscular onset for the right limb, for trained and untrained. (D) It shows time of muscular onset for the left limb, for trained and untrained. (E) It shows time of muscular onset for the right limb and left limb.
VM VL ST BF
Right Left
Table 4 A. Mean Values for time of Muscle Onset by gender, physical activity and both limbs.
Variable Indicator Limb MV Mean SD LV Mean SD ST Mean SD FB Mean SD
Sex
Male Right 97,57 12,01 97,42 13,19 104,74 16,83 105,07 8,12
Left 95,61 12,31 98,94 13,57 103,87 18,49 105,85 13,25
Female Right 102,0 15,07 101,72 13,12 100,64 10,89 111,12 17,81
Left 94,38 14,61 91,42 14,00 98,98 14,95 102,25 11,31
Level of physical activity
Tegner > 5 Right 100,45 12,32 99,43 12,20 104,32 15,85 105,83 9,29
Left 94,91 12,51 97,45 14,64 102,87 17,78 103,87 13,44
Tegner ≤ 5 Right 98,76 16,26 99,95 15,23 99,53 9,87 112,73 20,07
Left 95,06 15,32 90,83 12,54 98,63 14,90 104,23 10,46
Limb Left
Right 99,85 13,69 99,62 13,18 102,69 14,16 108,48 14,57
94,97 13,42 95,09 14,15 101,42 16,80 104,00 12,28
Values expressed in milliseconds. Abbreviations: SD: Standard Deviation. MV= Medial Vastus. LV= Lateral Vastus. ST= Semitendinosus. FB= Femoral Biceps.
Table 4 B. Comparison between Mean for time of Muscle Onset by differences between gender, physical activity and both limbs.
Evaluation Limb Muscle MD ES P. Value
Gender (Female – Male)
Right
MV 4,46 4,07 0,2858
LV 4,29 3,92 0,2287
ST - 4,10 4,27 0,6555
BF 6,04 4,66 0,3012
Left
MV - 1,23 4,09 0,7421
LV - 7,51 4,11 0,0357 *
ST - 4,89 5,07 0,4595
BF - 3,60 3,75 0,6269
Level of physical activity (Lower - higher)
Right
MV - 1,68 4,30 0,3487
LV 0,52 4,15 0,4504
ST - 4,79 4,49 0,1464
BF 6,90 4,72 0,0763
Left
MV 0,15 4,25 0,4860
LV - 6,62 4,34 0,0675
ST - 4,23 5,36 0,2175
BF 0,36 3,92 0,4631
Limb (right – left)
MV 4,88 2,87 0,0466 *
LV 4,52 2,88 0,0602
ST 1,26 3,31 0,3516
BF 4,47 2,96 0,0677
* P < 0,05. Abbreviations: MD= Mean Difference. ES= Error Standard. MV= Medial Vastus. LV= Lateral Vastus. ST= Semitendinosus. FB= Femoral Biceps.
CONCLUSION
Men presented better JPS and steadiness that women, which may be attributable to a higher laxity of women and higher muscle strength
REFERENCES
1. Riemann BL, Lephart SM. The sensorimotor system, part I: the physiologic basis of functional joint stability. J Athl Train. 2002;37(1):71.
2. Myers JB, Wassinger CA, Lephart SM. Sensorimotor contribution to shoulder stability: effect of injury and rehabilitation. Man Ther. 2006;11(3):197-201. 3. Nagai T, Sell TC, Abt JP, Lephart SM. Reliability, precision, and gender
diffe-rences in knee internal/external rotation proprioception measurements. Phys Ther Sport. 2012;13(4):233-237.
4. Muaidi Q, Nicholson L, Refshauge K. Do elite athletes exhibit enhanced proprio-ceptive acuity, range and strength of knee rotation compared with non-athletes? Scand J Med Sci Sports. 2009;19(1):103-112.
5. Tegner Y, Lysholm J. Rating systems in the evaluation of knee ligament injuries. Clin Orthop Relat Res. 1985;198:42-49.
6. Tracy BL, Enoka RM. Older adults are less steady during submaximal isometric contractions with the knee extensor muscles. J. Appl. Physiol. 2002;92(3):1004-1012.
7. Riemann BL, Myers JB, Lephart SM. Sensorimotor system measurement tech-niques. J Athl Train. 2002;37(1):85.
8. Hermens HJ, Freriks B, Merletti R, et al. European recommendations for surface electromyography. Roessingh Research and Development. 1999;8(2):13-54. 9. Karkousha RN. Sex differences of knee joint repositioning accuracy in healthy
adolescents. Bull Fac Phys Ther. 2016;21(1):56.
10. Lin C-H, Lien Y-H, Wang S-F, Tsauo J-Y. Hip and knee proprioception in elite, amateur, and novice tennis players. Am J Phys Med Rehabil. 2006;85(3):216-221.
of men, respectively. Subjects with higher training showed better JPS and steadiness values. This is consistent with the literature, where training results in sensorimotor adaptation.
11. Han J, Waddington G, Anson J, Adams R. Level of competitive success achie-ved by elite athletes and multi-joint proprioceptive ability. J Sci Med Sport. 2015;18(1):77-81.
12. Goble DJ, Brown SH. Upper limb asymmetries in the matching of proprioceptive versus visual targets. J Neurophysiol. 2008;99(6):3063-3074.
13. Naito E, Nakashima T, Kito T, Aramaki Y, Okada T, Sadato N. Human limb-specific and non-limb-specific brain representations during kinesthetic illusory movements of the upper and lower extremities. Eur J Neurosci. 2007;25(11):3476-3487. 14. Naito E, Roland PE, Grefkes C, et al. Dominance of the right hemisphere and
role of area 2 in human kinesthesia. J Neurophysiol. 2005;93(2):1020-1034. 15. Brown RE, Edwards DL, Jakobi JM. Sex differences in force steadiness in three
positions of the forearm. Eur J Appl Physiol. 2010;110(6):1251-1257. 16. Bilodeau M, Keen DA, Sweeney PJ, Shields RW, Enoka RM. Strength
trai-ning can improve steadiness in persons with essential tremor. Muscle Nerve. 2000;23(5):771-778.
17. Keen DA, Yue GH, Enoka RM. Training-related enhancement in the control of motor output in elderly humans. J Appl Physiol (1985). 1994;77(6):2648-2658. 18. Telianidis S, Perraton L, Clark RA, Pua Y-H, Fortin K, Bryant AL. Diminished
sub-maximal quadriceps force control in anterior cruciate ligament recons-tructed patients is related to quadriceps and hamstring muscle dyskinesia. J Electromyogr Kinesiol. 2014;24(4):513-519.