Food Science and Technology
DO:
D https://doi.org/10.1590/1678-457X.22017
OSSN 1678-457X (Dnline)
1 Introduction
According to Yangilar (2013), goat milk is an undeniable source of food, because it has beneficial effects for health maintenance, with physiological functions in the nutrition of children and the elderly. The nutritional properties of milk have motivated greater interest in its consumption as a functional food, making it a current trend of healthy food in developed countries (Bevilacqua et al., 2001; Dlalla et al., 2009). Ot is considered a source of protein of excellent quality, resulting from the proportion of essential amino acids that compose the goat milk, in addition to being highly digestible due to the higher percentage of fat globules with a diameter of less than 1.5 µm (Furtado, 1985; Dlalla et al., 2009).
On recent years, the production and processing of goat milk into products of added value has been shown to provide an alternative food source for people with intolerance and allergies to cow milk, as demonstrated by Ribeiro & Ribeiro (2010). Several studies have reported on the development of dairy products with goat milk, such as cheeses (Sant’ana et al., 2013), fermented milk (Hanum et al, 2015; Paz et al., 2014; Ranadheera et al., 2012), and butter (Odoui et al., 2013).
However, there are few information about ‘dulce de leche’ production waking up interest in its production using goat milk.
‘Dulce de leche’ is a popular product in Latin American countries resulting from cooking milk with sugar until the desired concentration, to which other ingredients may be added, such as starches, in a proportion not exceeding 5 g/L of milk (Brasil, 1997; Ranalli et al., 2012). According to Silva et al. (2014), the use of starch in ‘dulce de leche’ may contribute to its consistency and efficiency by the retention of water, helping to control the crystallisation of lactose, which confers a sandy soil texture to the final product.
Due to the processing characteristics, there are many variations of the ingredients used in processing ‘dulce de leche’. Thus, the application of other components, in addition to the technical properties of this product, can provide nutritionally balanced food. Studies conducted by Capitanni et al. (2013), Reyes-Caudillo et al. (2008) and Salgado-Cruz et al. (2013) have demonstrated that chia (Salvia hispanica L.) presents soluble fibres, with an analogue behaviour to multiple hydrocolloids, presenting gelling properties and a stabiliser, which is of great interest in the development of new formulations of products. Another factor of great prominence in this oleaginous seed is the high content of polyunsaturated fatty acids (PUFA), particularly the alpha-linolenic acid precursor of the omega-3series, in addition to the high amount of protein, minerals, and polyphenols (Capitanni et al., 2013; Reyes-Caudillo et al., 2008; Simopoulos, 2011).
Influences of chia flour and the concentration of total solids on the characteristics of
‘dulce de leche’ from goat milk
Marcia Alves CHAVES1*, Aloísio Henrique Pereira de SDUZA2, Eliane CDLLA3, Paulo Rodrigo Stival BOTTENCCDURT4, Makoto MATSUSHOTA5
Received 24 July, 2017 Accepted 15 Oct., 2017
1Programa de Pós-graduação em Ciência de Alimentos – PPC, Universidade Estadual de Maringá – UEM, Maringá, PR, Brazil 2Instituto Federal do Mato Grosso do Sul – IFMS, Coxim, MS, Brazil
3Programa de Pós-graduação em Tecnologia de Alimentos – PPGTA, Universidade Tecnológica Federal do Paraná – UTFPR, Medianeira, PR, Brazil 4Departamento Acadêmico de Química – DAQUI, Universidade Tecnológica Federal do Paraná – UTFPR, Medianeira, PR, Brazil
5Departamento de Química – DQI, Universidade Estadual de Maringá – UEM, Maringá, PR, Brazil *Corresponding author: marcia_alves_chaves@hotmail.com
Abstract
A factorial categorical design totalling six treatments was applied to investigate the influence of the substitution of corn starch with whole and partially defatted chia flour under the technical characteristics (centesimal composition, instrumental analyses, and sensory evaluation) and nutritional disorders (composition of fatty acids and index of the nutritional quality of the lipid fraction) of ‘dulce de leche’ concentrated to 72 and 78 °B. The treatments with chia flour concentrated to 72 °B showed higher moisture content and lower compression force, and when the concentration range increased to 78 °B, the levels of total lipids amounted up to 1.40 times when compared to treatment with corn starch. The polyunsaturated fatty acids, particularly omega-3 and omega-6 levels, were higher in treatments with chia flour on both tracks of concentration, allowing a reduction in the atherogenic index and thrombogenic index effects and the n-6/n-3 ratio. The treatments of ‘dulce de leche’ with a lower concentration of soluble solids obtained greater acceptance and consumer purchase intention. The application of whole chia flour in small proportions and in the concentration of 72 °B was the most appropriate under the studied conditions, showing improvement in the nutritional quality and with good technical aspects of candy made with goat milk.
Keywords:Salvia hispanica L.; polyunsaturated fatty acids; alpha-linolenic acids; thickening agent.
Noting the strong tendency to consume foods with functional properties, the objective of this study was to develop formulations of ‘dulce de leche’ from goat milk using whole chia flour (FCO) and partially defatted chia flour (FCPD) in place of corn starch (AM) in order to analyse the best point of concentration of total solids (72 and 78 °B) in the technical aspects (instrumental analyses, centesimal composition, and sensory analysis) and nutritional disorders (composition of fatty acids and index of the nutritional quality of the lipid fraction) of this product.
2 Materials and methods
In natura goat milk (3.87 g/100 g of fat) from the Saanen
breed was obtained from a rural producer (Otaipulandia, Parana State, Brazil) according to the norms of good farming practices. Subsequently, the milk was subjected to heat treatment in pasteurised plates (72-75 °C/15-20 s) and stored on a camera at 5 °C ± 1 °C. The fully and partially defatted chia flour was acquired from Giroil Agro Ltd (Santo Angelo, Rio Grande do Sul State, Brazil). The other ingredients used in the preparation of the ‘dulce de leche’ (sucrose, glucose syrup, AM and sodium bicarbonate) were purchased at a local market (Medianeira, Paraná State, Brazil).
2.1 Randomised factorial design
A statistical design was used to investigate the influence of the thickener agents, FCO and FCPD in place of AM, commonly used in processing on the characteristics of the ‘dulce de leche’ from goat milk submitted to two tracks of concentration: 72 and 78 °B (Table 1). The value of each thickener was fixed at 1 g/L of milk.
2.2 Product development
For the preparation of the product, homogenized sucrose (450 g) and bicarbonate of soda (4.2 g) were added to the milk (3L) until reaching the concentration of 60ºB. Glucose syrup (6 g) and thickening agent (FCO, FCPD, or AM) were added at 68 °B. The concentration process continued until the conditions stipulated (Table 1) being the product packaged (75 °C ± 1 °C) in polypropylene packaging. The ‘dulce de leche’ was kept at a temperature of 25 °C ± 2 °C for 7 days until analysis, simulating commercial storage.
2.3 Concentration of soluble solids content and centesimal composition
The concentration of soluble solids was determined by a refractometer (model OTT-6313, mark Kiltler, São Paulo, Brazil). The levels of moisture, ash, and protein (conversion factor of total nitrogen 6.38) were determined in accordance with Cunniff (1998). The total lipids were extracted by the technique of Bligh & Dyer (1959), and the total carbohydrates (CT) were calculated by Equation 1.
( )
CT 100= − moisture ash+ +protein+total lipids (1)
2.4 Instrumental texture and energy value
The analysis was performed with texturometer equipment (model Stable Micro Systems, mark TA.HD plus, Surrey, England). The ‘dulce de leche’ was evaluated in its own package (capacity of 200 g), and the following parameters were adopted for the tests: pre-test speed: 2.0 mm/s-1; test speed: 1.0 mm/s-1; post-test speed: 2.0 mm/s-1; distance: 10.0 mm; time: 5.0 s; strength of contact: 5.0 g; probe: acrylic cylinder of 20.0 mm (P20). The result of the parameter of compression force was expressed in grams (g). For calculation of the energy value, a ‘dulce de leche’ mass of approximately 0.5 g was conducted to the calorimetry bomb (model C-200, mark Oka Works, Staufen, Germany) and the found values were expressed in Kcal/100 g.
2.5 Colour parameters
The colour of the ‘dulce de leche’ was determined using colourimeter equipment (model Chroma Metter CR-400s, mark Konica Minolta, Dsaka, Japan).The coordinates of the COE/LAB were L* (brightness), a* [shades of red (a+) to green (a-)], and b*
[shade of yellow (b+) the blue (b-)]. The numerical values of a* and
b* were used to calculate the hue angle (hue°), which indicates the colour tone and chroma (C*), which indicates the colour saturation of the sample, as shown in Equations 2 and 3, respectively.
(
)
1 * *
º tg b / a
h = − (2)
( )
2 * 2 *(a ) b
C= + (3)
The coordinates of L*, a*, and b* can calculate the ΔE*, which indicates the difference in the ‘perception’ of colour, including the brightness, tone, and saturation of the tests prepared with chia flour compared to AM in the respective concentration band. The value of ΔE* was calculated by Equation 4.
( ) ( ) ( )
* 2 * 2 * 2*
E L a b
∆ = ∆ + ∆ + ∆ (4)
Where ΔL*=L* (standard test with AM) - L (test with FCO and FCPD); Δa*=a* (standard test with AM) –a* (test with FCO and FCPD); Δb*=b* (standard test with AM) - b (test with FCO and FCPD). According to Cecchini et al. (2011), the greatest value of ΔE* is the biggest difference between two colours, according to the following description: unnoticeable (ΔE*<1), minimal (1≤ ΔE*<2), only noticeable (2≤ ΔE*<3), noticeable (3≤ ΔE*<5), strong difference (5≤ ΔE*<12), different colour (ΔE*≥12). Table 1. Randomized factorial design used for ‘dulce de leche’ from
goat milk.
Thickening agent Simbol Unit Level
-1 +1
Corn starch (g/L) AM °B 72 78
Chia whole flour (g/L) FCO °B 72 78
Chia flour partially defatted (g/L) FCPD °B 72 78
2.6 Composition of fatty acids
The treatments of ‘dulce de leche’ suffered derivatization, and the methyl esters of the fatty acids were separated in a gas chromatograph (model 3380, mark Varian, USA) equipped with a fused silica capillary column (FAME, CP 7420-Select). The flow of gases was 1.4 mL/min-1 for the carrier gas (H
2), 30 mL/min -1
for the auxiliary gas (N2), and 30 and 300 mL/min
-1 for the
gases of the flame, hydrogen and synthetic air, respectively. The temperature of the injector and detector was kept at 235 °C. The column temperature was maintained at 65 °C for 4 min, reaching 4 °C min up to 185 °C and maintained for 5 min, then elevated from 185 °C to 10 °C min up to 225 °C and maintained for 10 min. The fatty acids were identified through the use of a mixture of methyl esters, and the retention times were compared (Sigma, USA). The normalized peak areas were determined through the software Star 5.0 (Varian, USA), and the concentrations were expressed in g of fatty acid per 100 g of lipid (g/100 g).
2.7 Index of nutritional quality of the lipid fraction
The atherogenic index (OAT) and thrombogenic index (OT) effects were calculated according to Equations 5 and 6, proposed by Ulbricht & Southgate (1991).
( )
(
)
( )IAT=12 : 0+ 4x1 4 : 0 +16 : 0/ AGMI+ − + −n 6 n 3 (5)
( )
( ) ( ) ( )
IT=14 : 0 16 : 0 18 : 0) / [ 0.5x AGMI+ + +(0.5x n−6 +3x n− +3 n−3 /n−6
(6)
Where: AGMO = monounsaturated fatty acids; n-3 = Dmega 3 and n-6 = Dmega 6
The reason for hypocholesterolemic and cholesterolemic fatty acids was calculated according to Equation 7, proposed by Santos-Silva et al. (2002).
( ) ( )
HH=18 :1n− +9 18 : 2n− +6 18 : 3n−3 / 14 : 0 16 : 0+ (7)
2.8 Sensory analysis
The sensory evaluation was performed after ethical approval (CAAE no. 02186412.2.0000.0104) from the State University of Maringa (Maringá, Paraná State, Brazil). The treatments of ‘dulce de leche’ were coded with a three-digit random number and served monadically in an approximate amount of 25 g, accompanied with salty crackers, a glass of water, and an evaluation sheet. A total of
80 non-trained judges were recruited to perform the acceptance test, in which the attributes of flavour, odour, colour, texture, appearance, and overall impression were evaluated through a nine-point hedonic scale, where ‘9’ corresponds to the option ‘O liked a lot’ and ‘1 to the option ‘O really disliked’, according to Faria & Yotsuyanagi (2008). The intention to purchase was determined using a five-point scale, where ‘1’ was ‘certainly not buying’ and ‘5’ was ‘certainly buying’. The acceptability index (OA) was calculated according to Equation 8.
( )
IA % =A x1 00 / B (8)
Where: A = average score obtained for the product and B= maximum score given to the product. The OA with a good effect is considered ≥70% (Lawless & Heymann, 1999).
2.9 Statistical analysis
The averages of the triplicate samples were subjected to analysis of variance and when a significant difference at the 5% level of probability was detected, the Tukey test was applied through the Statistic program, version 7.0 (Statsoft, 2007).
3 Results and Discussion
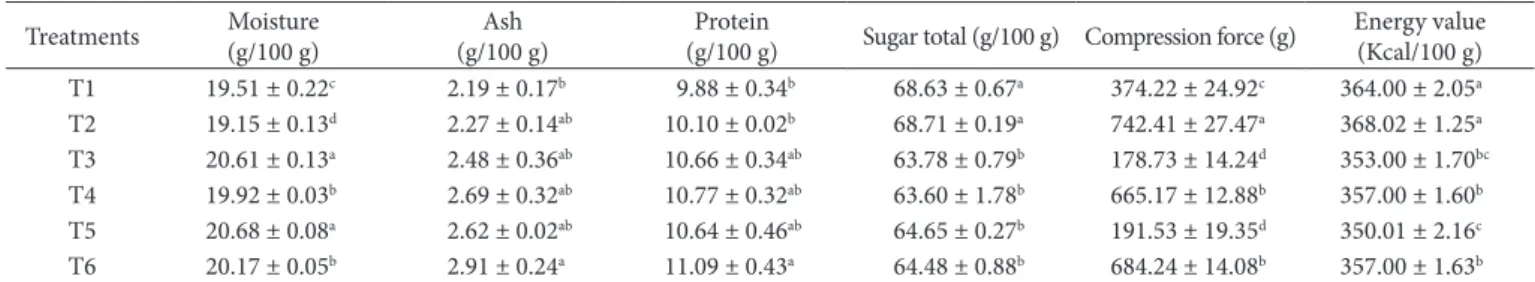
The analysis of variance showed a significant difference in moisture content (p < 0.05), as shown in Table 2. The highest averages occurred in treatments with added FCO with lower concentrations of soluble solids (T3 and T5). Due to the increase in the evaporation process (78 °B), the treatments with FCO and FCPD differed from those submitted to 72 °B, with slightly lower moisture content. However, these values in T4 and T6 still remained higher than those treatments with AM in both concentrations. According to Muñoz et al. (2012), the fibres present in chia seeds are able to retain 27 times more water than their own weight, which explains the higher moisture content in ‘dulce de leche’ with fully and partially defatted chia flour. The results of moisture content also influenced the instrumental texture, reducing the firmness in the treatments with chia flour.
The treatments of ‘dulce de leche’ with AM (T1 and T2) differed among themselves and from the others (p<0.05) in the parameter of compression force (Table 2). The lowest values found in treatments T3, T4, T5, and T6 may be related to the intrinsic composition of chia flour, which probably absorbed a greater quantity of water due to the presence of fibres, leading to a less consistent look in the ‘dulce de leche’. The range of concentration
Table 2. Centesimal composition, compression force and energy value of treatments of ‘dulce de leche’ from goat milk.
Treatments Moisture (g/100 g)
Ash (g/100 g)
Protein
(g/100 g) Sugar total (g/100 g) Compression force (g)
also influenced the instrumental texture of ‘dulce de leche’, with greater compression forces in the treatments concentrated to 78 °B. This factor recurred in the sensory analysis, in which the largest concentration of ‘dulce de leche’ had the lowest averages for the attribute of texture.
Regarding the ash content, only the treatments T1 and T6 were statistically different (p < 0.05), being observed the highest average for the ‘dulce de leche’ added of FCPD, concentrated at 78 °B. Although not significant, with the reduction in moisture content and increase of soluble solids, there was an increase in ash content when compared with the same thickening agent.
The protein levels remained higher in T6, differing from the treatments with the addition of AM (p < 0.05). The results of the present study were higher than those found in the literature (Gaze et al., 2015; Madrona et al., 2009; Silva et al., 2014). Because of the lower proportion of moisture and total lipids in treatments with corn starch, it was observed increase in total carbohydrates in T1 and T2, with the highest results and differing statistically from the others (p < 0.05). However, when comparing the same type of thickening, increase in the concentration of soluble solids content from 72 to 78 °B did not influence the carbohydrate content in the treatments with FCO and FCPD.
Regarding the content of total lipids (Table 3), the treatments T3 and T6 showed no statistical differences between them (p < 0.05) and remained higher in the two tracks of concentration studied.
The amount of lipids in ‘dulce de leche’ at 78 °B increased by 1.40 and 1.26 times in T4 and T6, respectively, when compared to treatment with AM (T2). The increase in the lipid content can be observed when analysing the concentrations of PUFA, which were higher in treatments containing FCO, especially by increasing fatty alpha-linolenic acids in the treatment with FCO when compared to the others (FCPD and AM). This simultaneous increase of 5.75 and 4.70 times the value of omega-3 in relation to the ‘dulce de leche’ with AM provided reduction in the ratio
n-6/n-3 by almost six times in treatment T3.
According to Simopoulos (2011), the reason n-6/n-3 in western feeding is around 15-20/1 and the addition of small doses of FCO and FCPD could contribute to the reduction of this index to values close to the recommended 1-2/1. Ratnayake & Galli (2009) also reported that an imbalance in the intake of n-6/n-3 is associated with conditions of myocardial infarction, hypercholesterolaemia, increased LDL cholesterol and blood pressure, formation of atheromatous plaque, dyslipidemia among other diseases.
Table 3. Composition of fatty acids (g/100 g of fatty acids) and index of nutritional quality of the lipid fraction of treatments of ‘dulce de leche’ from goat.
Fattyacid T1 T2 T3 T4 T5 T6
4:0 0.37 ± 0.02 0.35 ± 0.01 0.38 ± 0.04 0.41 ± 0.03 0.45 ± 0.02 0.43 ± 0.03
6:0 1.02 ± 0.06 0.99 ± 0.01 1.06 ± 0.06 1.13 ± 0.07 1.22 ± 0.02 1.20 ± 0.03
8:0 2.13 ± 0.09 2.06 ± 0.01 2.13 ± 0.06 2.22 ± 0.08 2.35 ± 0.06 2.32 ± 0.00
10:0 10.40 ± 0.34 10.16 ± 0.04 10.31 ± 0.31 10.44 ± 0.14 10.84 ± 0.28 10.74 ± 0.09
11:0 0.27 ± 0.01 0.29 ± 0.02 0.27 ± 0.01 0.29 ± 0.01 0.29 ± 0.01 0.28 ± 0.00
12:0 5.84 ± 0.10 5.77 ± 0.05 5.06 ± 0.84 5.73 ± 0.00 5.79 ± 0.04 5.80 ± 0.02
14:0 11.44 ± 0.11 11.53 ± 0.08 11.45 ± 0.14 11.28 ± 0.06 11.15 ± 0.08 11.21 ± 0.07
15:0 0.57 ± 0.01 0.59 ± 0.02 0.56 ± 0.00 0.57 ± 0.01 0.57 ± 0.01 0.57 ± 0.01
15:1 0.84 ± 0.05 0.81 ± 0.02 0.79 ± 0.02 0.79 ± 0.01 0.78 ± 0.02 0.79 ± 0.01
16:0 28.69 ± 0.25 29.10 ± 0.13 28.73 ± 0.21 28.34 ± 0.18 27.93 ± 0.20 28.05 ± 0.02
16:1 1.23 ± 0.04 1.16 ± 0.02 1.14 ± 0.03 1.14 ± 0.01 1.18 ± 0.01 1.15 ± 0.01
17:0 0.75 ± 0.01 0.84 ± 0.04 0.78 ± 0.02 0.77 ± 0.00 0.77 ± 0.01 0.76 ± 0.02
18:0 7.19 ± 0.15 7.20 ± 0.09 7.17 ± 0.04 7.22 ± 0.02 7.22 ± 0.10 7.27 ± 0.05
18:1n-9t 1.88 ± 0.10 1.90 ± 0.13 1.82 ± 0.04 1.80 ± 0.03 1.85 ± 0.06 1.83 ± 0.11 18:1n-9c 22.61 ± 0.14 22.84 ± 0.06 22.40 ± 0.07 22.36 ± 0.01 22.33 ± 0.06 22.57 ± 0.12
20:0 0.90 ± 0.01 0.89 ± 0.01 0.90 ± 0.01 0.92 ± 0.01 0.95 ± 0.02 0.91 ± 0.02
Total lipids 4.84 ± 0.28c 4.94 ± 0.11bc 6.57 ± 0.37a 6.89 ± 0.87a 6.02 ± 0.11ab 6.22 ± 0.30a SCFA 13.94 ± 0.52ab 13.56 ± 0.04b 13.88 ± 0.41ab 14.19 ± 0.32ab 14.86 ± 0.33a 14.69 ± 0.04a SFA 69.69 ± 0.34a 69.56 ± 0.19a 68.79 ± 0.16b 69.31 ± 0.09ab 69.51 ± 0.24a 69.55 ± 0.03a MUFA 26.60 ± 0.22a 26.71 ± 0.14a 26.15 ± 0.15b 26.09 ± 0.06b 26.15 ± 0.09b 26.34 ± 0.01ab
PUFA 3.01 ± 0.03d 2.98 ± 0.07d 4.20 ± 0.03a 3.91 ± 0.04b 3.33 ± 0.07c 3.28 ± 0.02c 18:2n-6 (n-6) 2.81 ± 0.03b 2.78 ± 0.05b 3.05 ± 0.02a 2.97 ± 0.03a 2.83 ± 0.05b 2.83 ± 0.02b 18:3n-3 (n-3) 0.20 ± 0.01d 0.20 ± 0.03d 1.15 ± 0.05a 0.94 ± 0.00b 0.50 ± 0.02c 0.45 ± 0.00c
n-6/ n-3 14.02 ± 0.97a 14.36 ± 2.00a 2.65 ± 0.12c 3.15 ± 0.03c 5.64 ± 0.21bc 6.24 ± 0.00b OAT 2.72 ± 0.03a 2.72 ± 0.02a 2.62 ± 0.01b 2.64 ± 0.01b 2.66 ± 0.01b 2.66 ± 0.01b OT 3.08 ± 0.01a 3.09 ± 0.03a 2.57 ± 0.03d 2.65 ± 0.01c 2.86 ± 0.02b 2.89 ± 0.01b H/H 0.64 ± 0.00b 0.64 ± 0.00b 0.66 ± 0.00a 0.66 ± 0.00a 0.66 ± 0.00a 0.66 ± 0.01a SCFA= Short-Chain Fatty Acids; SFA= Saturated Fatty Acids; MUFA= Monounsaturated Fatty Acids; PUFA= Polyunsaturated Fatty Acids; 18:2n-6 (n6): Linoleic acid (omega-6); 18:3n-3
(n-3)= Linolenic acid (omega-3); n-6/n-3: Ratio omega-6/omega-3; OAT= Atherogenic Ondex; OT= Thrombogenic Ondex; HH=Ratio Hypocholesterolaemic FattyAcids/Hypercholesterolemic
Regarding the OAT and OT (Table 3), the treatments with FCO and FCPD presented lower values when compared to treatment with AM. For the OT, it was also noted that the treatments with FCO differed among themselves and the others (p < 0.05), and the lowest average for this index occurred in T3. This result is associated with a greater concentration of fatty acid alpha-linolenic acid, which has an antithrombogenic effect superior to omega 6 fatty acids. According to Sousa Bentes et al. (2009), there are no recommended values for the OAT and OT in dairy products; therefore, it is considered that the lower the occurrence of these values, the more favourable the profile of fatty acids on human health.
The same is true for why hypocholesteromic and hypercholesterolemic fatty acids are not prescribed as a reference value for dairy products. The literature uses as a standard of comparison the value 2.0, assigned to meat products; however, in the present study the rates remained below 1.0 for all treatments, but were slightly higher in ‘dulce de leche’ with FCO and FCPD. This result with low H/H is influenced by the high content of myristic (14:0) and palmitic acid (16:0), which represent more than 55% of the total fatty acids in the treatment of ‘dulce de leche’. As for the other fatty acids, significant concentrations (13.56 to 14.86 g/100 g lipids) of short-chain fatty acids (4:0 to 10:0) are noted that are characteristic of goat milk, as demonstrated by Molina et al. (2015).
On the same way, the treatments T3 to T6 showed the lowest values of total energy, differing from T1 and T2 (Table 2). As mentioned, chia flour has a high fibre content that is not digested and absorbed by the gastrointestinal system, thus not counting as an energy source for the body (Stauffer, 1997). The substitution of corn starch with Partially defatted chia flour reduced 14 kcal/100 g in T5, which represents a decrease of 84 Kcal/month for an individual who consumes a daily portion
of 20 g of ‘dulce de leche’. Ot appears that the quantity of FCO and FCPD (1 g/L) applied to the ‘dulce de leche’ was enough to promote beneficial effects on the composition of the product, enabling improvement in the nutritional quality even in foods with high energy demand such as ‘dulce de leche’. Regarding the colour parameters (Table 4), the treatments did not differ (p < 0.05) in
L*, a*, and b*, featuring a tint in the region between red (a* +) and yellow (b*+) with values of the hue angle situated between 66.02 and 67.24 hue. Note that the ‘dulce de leche’ showed a dark colour (L*<50) and values of C* between 25.97 and 31.01, demonstrating a more intense colour. The treatments with chia flour did not differ significantly among themselves (p < 0.05) for the parameter ΔE*, and when compared to treatments with AM the colour difference was noticeable; colour distinctions were also identified during the sensory analysis. Evaluating the low luminosity, the slope of the hue angle, and the chromaticity of
a* and b* positive, it can be assumed that the combination of these parameters resulted in ‘dulce de leche’ with a brown colour, characteristic of this product, due to reactions during cooking, enhanced by the addition of sodium bicarbonate.
On the sensorial analysis (Table 5), the attributes of taste, odour, and overall evaluation showed no significant differences among treatments (p < 0.05). On the colour and appearance attributes, the average achieved in treatments T3, T4, T5, and T6 may have been influenced by the presence of dark spots due to the low solubility of FCO during processing of ‘dulce de leche’, indicated by some judges as appearing burned. For the texture, the treatments with different types of thickener subjected to the same conditions of concentration showed no difference between them (p<0.05). The same effect was observed in the evaluation of instrumental texture, in which the compression force was smaller at 72ºB. This allows verification that the chia flour in the used proportions did not influence the texture assigned to the ‘dulce de leche’ by the judges.
Table 4. Color parameters of treatments of ‘dulce de leche’ from goat milk.
Treatments Color parameters
L* a* b* hue° C* ΔE*
T1 43.18 ± 1.04a 12.78 ± 0.57a 25.91 ± 0.19a 66.08 ± 1.28a 25.97 ± 1.05b -T2 41.80 ± 0.95a 12.91 ± 0.91a 24.70 ± 0.81a 66.02 ± 0.63a 31.01 ± 0.74a -T3 43.06 ± 0.21a 13.33 ± 0.23a 25.07 ± 0.78a 67.24 ± 0.95a 27.86 ± 1.85ab 3.97 ± 1.18a T4 42.17 ± 0.99a 13.97 ± 1.57a 24.46 ± 1.70a 66.22 ± 0.38a 29.33 ± 1.77ab 2.42 ± 2.03a T5 43.28 ± 0.84a 13.72 ± 0.20a 25.03 ± 0.23a 67.15 ± 0.47a 28.24 ± 0.79ab 3.27 ± 0.68a T6 42.78 ± 0.28a 13.89 ± 0.59a 24.68 ± 0.81a 66.90 ± 1.07a 29.04 ± 0.27ab 2.48 ± 0.90a Means followed by the same letter in the column do not differ by Tukey´s test (p < 0.05).
Table 5. Sensory atributes of treatments of ‘dulce de leche’ from goat milk.
Treatments Color Flavor Ddor Texture Appearance Global evaluation OA (%)
The OA remained above the recommended value for the six treatments in all attributes analyzed, with emphasis on the global assessment, exceeding 80% acceptance (Table 5).For the purchase intention, the judges also attributed higher notes to the treatments concentrated to 72 °B. When comparing the different thickeners under the same conditions of concentration, the sum of notes 4 (possibly buy) and 5 (certainly would buy) remained higher in T1 (72.50%), T3 (58.72%), and T5 (61.25%) when compared to T2 (62.50%), T4 (51.25%), and T6 (53.75%). These results demonstrate that the type of thickener used would not be a determining factor in the acquisition of ‘dulce de leche’, because, for the 6 treatments, only 1 g/L of thickening agent was used. According to the judges, the most relevant aspect is the concentration range, which probably led to an increase in consistency by removal of water during the evaporation process to 78 °B, with a decrease in consumer acceptance. Konkel et al. (2004) indicated that high concentrations of starch in commercial milk jam showed lower average acceptance when compared to milk jams with quantities of starch within the legal limits (maximum of 5 g/L).
4 Conclusion
The addition of 1 g/L of fully and partially defatted chia enabled the development of ‘dulce de leche’ with an increment of mono- and polyunsaturated fatty acids, with omega-3 and omega-6, reducing the n-6/n-3 ratio, the OAT and OT effects, and the energy value. The treatments with FCO and FCPD also showed higher moisture content, reflecting in lower compression force on instrumental analysis of texture. The treatments concentrated at 72 °B were also considered of better sensorial acceptance by consumers. The chia flour proved difficult to solubilise, which was noticeable in the colour parameters and sensory analysis when compared to treatment with AM. The OA was greater than 70% in six treatments in all evaluated attributes. Therefore, the use of chia is promising, mainly in the form of a thickening agent up to the concentration of 72 °B in ‘dulce de leche’ from goat milk.
Acknowledgements
To the State University of Maringá and Federal Technological University of Paraná for making the resources and technology available to support the development of this research.
References
Bevilacqua, C., Martin, P., Candalh, C., Fauquant, J., Piot, M., Roucayrol, A. M., Pilla, F., & Heyman, M. (2001). Goat’s milk of defective as1 -casein genotype decreases intestinal and systemic sensitisation to b-lactoglobulin in guinea pigs. The Journal of Dairy Research, 68(2), 217-227. PMid:11504386. http://dx.doi.org/10.1017/S0022029901004861. Bligh, E. G., & Dyer, W. J. (1959). A rapid method of total lipid extraction and purification. Canadian Journal of Biochemistry and Physiology, 37(8), 911-917. PMid:13671378. http://dx.doi.org/10.1139/o59-099. Brasil, Ministério da Agricultura, Pecuária e Abastecimento. (1997, September 4). Dispõe sobre o Regulamento Técnico para Fixação de
Odentidade e Qualidade de Doce de Leite. (Portaria nº 354 de 04 de setembro de 1997). Diário Oficial [da] República Federativa do Brasil. Capitanni, M. O., Oxtaina, V. Y., Nolasco, S. M., & Tomás, M. C. (2013).
Microstructure, chemical composition and mucilage exudation of chia
(Salvia hispanica L.) nutlets from Argentina. Journal of Agricultural and Food Chemistry, 93(15), 3856-3862. PMid:23900918. http:// dx.doi.org/10.1002/jsfa.6327.
Cecchini, M., Contini, M., Massantini, R., Monarca, D., & Moscetti, R. (2011). Effects of controlled atmospheres and low temperature on storability of chestnuts manually and mechanically harvested. Postharvest Biology and Technology, 61(2), 131-136. http://dx.doi. org/10.1016/j.postharvbio.2011.03.001.
Cunniff, P. A. (1998). Official Methods of Analysis of AOAC International (16. ed.). Arlington: ADAC.
Faria, E. V., & Yotsuyanagi, K. (2008). Técnicas de análise sensorial (2. ed.). Campinas: OTAL.
Furtado, M. (1985). Fabricação de queijos de cabra (6. ed). São Paulo: Nobel S.A.
Gaze, L. V., Costa, M. P., Monteiro, M. L., Lavorato, J. A., Conte Júnior, C. A., Raices, R. S., Cruz, A. G., & Freitas, M. Q. (2015). Dulce de Leche, a typical product of Latin America: Characterisation
by physicochemical, optical and instrumental methods. Food
Chemistry, 169, 471-477. PMid:25236253. http://dx.doi.org/10.1016/j. foodchem.2014.08.017.
Hanum, Z., Sumantri, C., Purwantiningsih, Batubra, O., Taufik, E., Mitsunaga, T., Yamauachi, K., & Dgata, Y. (2015). Effectivity of
fermented goat milk added Lactobacillus plantarum asmelanin
inhibitor. Applied Research Journal, 1(5), 338-342.
Odoui, T., Rechak, H., & Zabayou, N. (2013). Microbial quality, physicochemical characteristics and fatty acid composition of a traditional butter made from goat milk. Annals Food Science and Technology, 14(1), 108-114. http://dx.doi.org/10.3989/gya.110209. Konkel, F. E., Dliveira, S. M. R., Simões, D. R. S., & Demiate, O. M.
(2004). Avaliação sensorial de doce de leite pastoso com diferentes concentrações de amido. Food Science and Technology (Campinas), 24(2), 249-254. http://dx.doi.org/10.1590/S0101-20612004000200015. Lawless, H. T., & Heymann, H. (1999). Sensory evaluation of food:
principles and practices. Gaithersburg: Aspen Publishers.
Madrona, G. S., Zotarelli, M. F., Bergamasco, R., & Branco, O. G. (2009). Study on the effect of the addition of whey in the sensorial quality of creamy dulce de leche. Food Science and Technology (Campinas), 29(4), 826-833. http://dx.doi.org/10.1590/S0101-20612009000400020. Molina, B., Alcalde, C. R., Hygino, B., Santos, S. M. A., Gomes, L. C., & Santos, G. T. (2015). Onclusion of protected fat in diets on
the milk production and composition of saanen goats. Ciência e
Agrotecnologia, 39(2), 164-172. http://dx.doi.org/10.1590/S1413-70542015000200008.
Muñoz, L. A., Aguilera, J. M., Rodriguez-Turienzo, B. L., Cobos, A. A., & Diaz, A. (2012). Characterization and microstructure of
films made from mucilage of Salvia hispanica and whey protein
concentrate. Journal of Food Engineering, 111(3), 511-518. http:// dx.doi.org/10.1016/j.jfoodeng.2012.02.031.
Dlalla, M., Ruiz-Lópoz, M. D., Navarro, M., Artacho, R., Cabrera, C., Giménez, R., Rodriguez, C., & Mingorance, R. (2009). Nitrogen fractions of Andalusian goat milk compared to similar types of commercial milk. Food Chemistry, 113(3), 835-838. http://dx.doi. org/10.1016/j.foodchem.2008.10.022.
Paz, N. F., Dliveira, E. G., Kairuz, M. S. N., & Ramón, A. N. (2014). Characterization of goat milk and potentially symbiotic non-fat yogurt. Food Science and Technology (Campinas), 34(3), 629-635. http://dx.doi.org/10.1590/1678-457x.6409.
135(3), 1411-1418. PMid:22953874. http://dx.doi.org/10.1016/j. foodchem.2012.06.025.
Ranalli, N., Andrés, S. C., & Califano, A. N. (2012). Physicochemical and rheological characterization of “Dulce de Leche”. Journal of Texture Studies, 43(2), 115-123. http://dx.doi.org/10.1111/j.1745-4603.2011.00321.x.
Ratnayake, W. M., & Galli, C. (2009). Fat and fatty acid terminology, methods of analysis and fat digestion and metabolism: a background review paper. Annals of Nutrition & Metabolism, 55(1-3), 8-43. PMid:19752534. http://dx.doi.org/10.1159/000228994.
Reyes-Caudillo, E., Tecante, A., & Valdivia-López, M. A. (2008). Dietary fibre content and antioxidant activity of phenolic compounds present in Mexican chia (Salvia hispanica L.) seeds. Food Chemistry, 107(2), 656-673. http://dx.doi.org/10.1016/j.foodchem.2007.08.062. Ribeiro, A. C., & Ribeiro, S. D. A. (2010). Specialty products made
from goat milk. Small Ruminant Research, 89(2-3), 225-233. http:// dx.doi.org/10.1016/j.smallrumres.2009.12.048.
Salgado-Cruz, M. P., Calderón-Domíngueza, G., Chanona-Péreza, J., Farrera-Rebolloa, R. R., Méndez-Méndezb, J. V., & Díaz-Ramíreza, M. (2013). Chia (Salvia hispanica L.) seed mucilage release characterisation. A microstructural and image analysis study. Industrial Crops and Products, 51, 453-462. http://dx.doi.org/10.1016/j.indcrop.2013.09.036. Sant’ana, A. M., Bezerril, F. F., Madruga, M. S., Batista, A. S., Magnani, M., Souza, E. L., & Queiroga, R. C. (2013). Nutritional and sensory characteristics of Minas fresh cheese made with goat milk, cow milk, or a mixture of both. Journal of Dairy Science, 96(12), 7442-7453. PMid:24140324. http://dx.doi.org/10.3168/jds.2013-6915.
Santos-Silva, J., Bessa, R. J. B., & Santos-Silva, F. (2002). Effect of genotype, feeding system and slaughter weight on the quality of light lambs: OO. Fatty acid composition of meat. Livestock Production Science, 77(2-3), 187-194. http://dx.doi.org/10.1016/S0301-6226(02)00059-3. Silva, F. L., Ferreira, H. A. L., Souza, A. B., Almeida, D. F., Stephani, R., Pirozi, M. R., Carvalho, A. F., & Perrone, O. T. (2014). Production of dulce de leche: the effect of starch addition. LWT - Food Science and Technology, 62(1), 1-7. http://dx.doi.org/10.1016/j.lwt.2014.10.062. Simopoulos, A. P. (2011). Evolutionary aspects of diet: the omega-6/ omega-3 ratio and the brain. Molecular Neurobiology, 44(2), 203-215. PMid:21279554. http://dx.doi.org/10.1007/s12035-010-8162-0. Sousa-Bentes, A., Souza, H.L., Simões, M. G., & Mendonça, X. M. F. D. (2009). Caracterização física e química e perfil lipídico de três espécies de peixes amazônicos. Revista Brasileira de Tecnologia Agroindustrial, 3(2), 97-108. http://dx.doi.org/10.3895/S1981-36862009000200011.
Statsoft. (2007). Statistica: data analysis software system, version 7.0. Tulsa: Statsoft Onc.
Stauffer, C. E. (1997). Principles of dough formation. On S. P. Cauvan & L. S. Young (Eds.), Technology of bread making (pp. 262-295). London: Blackie Academicand Professional.
Ulbricht, T. L. V. & Southgate, D.A.T. (1991). Coronary heart disease: seven dietary factors. Lancet, 338(8773), 985-992.