Universidade de Brasília
Instituto de Ciências Biológicas
Programa de Pós-Graduação em Ecologia
Répteis Squamata endêmicos do Cerrado: Perdas de
hábitat e conservação em cenários futuros
Pietro Longo Hollanda de Mello
Brasília-DF
Universidade de Brasília
Instituto de Ciências Biológicas
Programa de Pós-Graduação em Ecologia
Répteis Squamata endêmicos do Cerrado: Perdas de
hábitat e conservação em cenários futuros
Orientador: Dr. Cristiano de Campos Nogueira
Dissertação apresentada ao Instituto de
Ciências Biológicas da Universidade de
Brasília como parte dos requisitos necessários
à obtenção do título de Mestre em Ecologia.
Brasília-DF
Pietro Longo Hollanda de Mello
Répteis Squamata endêmicos do Cerrado: perdas de hábitat e conservação em cenários
futuros. Dissertação realizada com o apoio da Coordenação de Aperfeiçoamento de Pessoal
de Nível Superior (CAPES) e aprovada junto ao Programa de Pós-Graduação em Ecologia da
Universidade de Brasília como requisito para obtenção do título de Mestre em Ecologia.
Comissão Examinadora:
_______________________________________
Prof. Dr. Cristiano de Campos Nogueira
Presidente/Orientador
Eco/UnB
___________________________________ ___________________________________
Prof. Dr. Reuber Albuquerque Brandão Profª. Drª. Paula Hanna Valdujo
Membro Titular
Membro Titular
Zoo/UnB WWF
______________________________________
Profª. Drª. Lilian Gimenes Giugliano
Membro Suplente
BioAni/UnB
À minha mãe e ao meu pai,
Obrigado por tudo, amo vocês.
“
I've found it is the small
everyday deeds of ordinary
folk that keep the darkness at
bay... small acts of kindness,
and love.”
AGRADECIMENTOS
Agradeço à minha mãe Rosany e meu pai Fernando por tudo, nuncas os deixarei e eles nunca me deixarão.
Agradeço por estar vivo e pela oportunidade de conhecer as pessoas maravilhosas que me cercam e ter a capacidade de aprender, ensinar e lutar pelo que eu penso estar correto. Como não sei bem se há algo além do que vivemos aqui, mas sinto que estamos todos unidos de alguma maneira, escolho agradecer à Deus por essa benção, seja qual for sua forma ou religião.
Agradeço à minha família toda, tios, tias, primos e primas e especialmente aos meus avôs Mario e Fernando, minhas avós Mafalda e Yvone, ao meu Tio Paulo e à minha afilhada Bianca pelo apoio.
Agradeço à minha namorada Sofia e aos meus amigos do SCAP (Marcos, Guth, André, Filipe, Brito, Rafael, Elias, Diója, Diogo, Radan, João, Tiago e Vitor) pelo apoio incondicional em todos os momentos, sem vocês, talvez tivesse enlouquecido, vocês foram e serão sempre cruciais para minha vida.
Agradeço aos meus amigos Gabriel Lott, Eduardo Pedra, Pabllo Candeira, Guilherme Carneiro e Nathália Lott por estarem comigo desde o começo do Mestrado e também me apoiarem sempre.
Agradeço aos meus amigos de Foz do Iguaçu por sempre estarem comigo: Marcel, Thiago Novaes, Thiago Pimenta e Nelson Scardua. Agradeço também por ter morado em Foz, acredito que devo ao contato intenso com a natureza que lá tive o fato de ter escolhido ser Biólogo.
Agradeço aos meus colegas de curso que entraram comigo por fazerem essa jornada comigo. Agradeço principalmente ao Brito, Thiago Filadelfo, Vivian, Alan, Pedrom Guth e Gabriel pelos momentos de conversa e relaxamento nesses dois anos.
Agradeço a todos os colegas da UNEMAT pela oportunidade de ficar meses no campo com vocês. Infelizmente um deles passou desta vida muito jovem, uma pessoa à quem devo conversas e divagações muito agradáveis, Liandre,você foi e continua sendo uma grande amiga, mesmo em pouco tempo. Fique em paz.
Agradeço aos meus amigos da Coleção Herpetológica da Universidade de Brasília pela companhia nos campos e fora deles, pelas conversas e pelos momentos de relaxamento, além do incrível profissionalismo e organização. Agradeço com maior ênfase ao Leonardo, à Jéssica, à Isis, ao Guth, ao Josué, às Anas, ao Carlos, ao Fabricius, ao Renan, ao Guarino, à Cecília e ao Santos.
Agradeço ao meu orientador Cristiano de Campos Nogueira, que apesar da distância se mostrou compreensivo e me auxiliou e orientou durante momentos críticos do trabalho, espero que possamos continuar a trabalhar juntos futuramente.
Agradeço ao Prof. Dr. Ricardo B. Machado pelo auxílio na dissertação e pela oportunidade de trabalhar em Co-autoria com o mesmo no artigo que será oriundo desta dissertação.
Agradeço à banca convidada (Prof. Dr. Reuber Brandão, Profª. Drª. Paula Valdujo, Profª. Drª. Lilian Giugliano) por aceitarem ao convite. Respeito e admiro estes profissionais e acredito que com o auxílio dos mesmos essa dissertação ganhará muito.
Agradeço a todos os professores que ministraram aulas para mim e para os meus colegas durante o curso.
Agradeço ao Prof. Dr. Reuber Brandão e ao Prof. Dr. Guarino Colli pelas oportunidades de monitoria em matérias por eles ministradas.
Agradeço ao Yuri e ao Josué pelo apoio no uso de programas de distribuição e de construção de mapas.
Agradeço à Universidade de Brasília não apenas pela oportunidade de fazer o Mestrado na mesma, mas também pela graduação. Esta Universidade me formou como profissional qualificado em Ciências Biológicas.
Agradeço ao IB, a todo secretariado, tanto da graduação, quanto da Pós-Graduação em Ecologia, principalmente à Vanessa que sanou tantas dúvidas e foi sempre solicita, não apenas comigo, mas com todos que conheço.
Agradeço à Profª. Drª. Ivone Diniz e ao Prof. Dr. Emerson Vieira pelo curso de Pós-Graduação em Ecologia ser recentemente reconhecido com Conceito 6 na CAPES.
ÍNDICE
Introdução geral ...1
Referências...5
Article ...11
Abstract ...12
Introduction ……….12
Methods ...14
Study area……….……….14
Data Sources ……….………15
Model construction of land coverage modification….……….……….……15
Estimating species ranges……….……….16
Identifying threatened species……….………..………17
Biogeographical patterns……….………..18
Biogeographical patterns and habitat loss……….………18
Priority areas for conservation………..……….19
Results ...19
Updated range maps, projected area losses and extinction risk reassessment………...19
Biogeographical patterns, habitat loss and protected area coverage……….20
Priority areas for conservation………..……….20
Discussion ...21
A heterogeneously threatened region……….………...21
Priority conservation areas ……….………..23
References ...24
Tables ...33
Figures ...35
Supporting Informations ...41
Data S1 ...42
Supporting references ...43
INTRODUÇÃO GERAL
1
Com pouco mais de 2 milhões de km², aproximadamente 20% da superfície do país e 12% da cobertura
2
continental, o Cerrado é o segundo maior domínio fitogeográfico brasileiro (Eiten, 1972; Ab’Saber, 1977; Ratter
3
et al., 1997; Oliveira-Filho & Ratter, 2002; Silva & Bates, 2002). Dominado por uma vegetação aberta e 4
savânica, possui solos empobrecidos, além de uma proeminente estratificação horizontal de suas fitofisionomias
5
(Oliveira-Filho & Ratter, 2002). Em duas décadas 340 novas espécies de vertebrados foram descritas para a
6
região (Machado et al., 2009), eno último grande inventário de Squamata no Cerrado foi identificada a segunda 7
maior proporção de endemismo entre os Tetrapoda, com um total 267 espécies, sendo 103 destas (39%)
8
endêmicas (Nogueira et al., 2011). 9
No cenário global contemporâneo de elevadas ameaças a espécies e investimentos relativamente baixos
10
em conservação (Pimm et al., 1995) o Cerrado figura entre as 34 áreas apontadas como hotspots globais (Myers 11
et al., 2000; Myers, 2003; Mittermeier et al., 2004), i.e. áreas que apresentam concentrações excepcionais de 12
espécies endêmicas, sofrendo com perdas expressivasde hábitat (Myers et al., 2000). Único hotspot savânico do 13
planeta, o Cerrado é apontado como uma das áreas prioritárias para investimentos em conservação global
14
(Myers et al., 2000). Ainda assim a região encontra-se cada vez mais ameaçada pela perda de sua cobertura 15
original (Machado et al., 2004; Klink & Machado, 2005), onde grupos com distribuições regionalizadas e 16
elevados níveis de endemismo, e.g. Squamata (Nogueira et al., 2011), podem sofrer ainda mais com as perdas 17
não homogêneas dentro do domínio (Klink & Moreira, 2002; Silva & Bates, 2002; Machado et al., 2004). 18
Como indicado em Colli et al. (2002), a maior parte dos estudos iniciais sobre diversidade da 19
herpetofauna do Cerrado descreveu assembleias pobres (Vanzolini, 1948, 1976, 1988; Vitt, 1991; Vitt &
20
Caldwell, 1993), dominadas por espécies generalistas, compartilhadas com a Caatinga semiárida e com o Chaco
21
(Vanzolini, 1963, 1976, 1988). Todavia, novos dados e interpretações descrevem um domínio com uma
22
diversidade horizontal de hábitats que abriga uma herpetofauna única, diversa e com espécies restritas a distintas
23
porções e formações fitofisionômicas (Colli et al., 2002; Nogueira et al., 2009, 2011; Valdujo et al., 2012). Em 24
trabalhos recentes, padrões biogeográficos temporais e espaciais começaram a ser destacados (Werneck & Colli,
25
2006; Costa et al., 2007), abrindo possibilidades para análises mais profundas da história das faunas de 26
Squamata do Cerrado (Nogueira et al., 2011). 27
Contrastando com este aumento no número de espécies identificadas para Squamata no Cerrado, na
28
última década houve a diminuição da cobertura total de vegetação natural do Cerrado (Klink & Machado, 2005).
Mais de 50% de sua área original já foi desmatada (MMA, 2011),devido principalmente à expansão do
30
agronegócio(Alho & Martins, 1995; Ratter et al., 1997; Klink & Moreira, 2002).Concomitantemente, unidades 31
de conservação de proteção integral, no Cerrado são pequenas e concentradas em poucas regiões, cobrindo
32
menos de 2% do domínio até o ano de 2004 (Klink & Machado, 2005).
33
Da mesma forma que no Cerrado, elevadas taxas de perda de áreas naturais vêm acontecendo em todo
34
o globo, associados a um aumento do risco de extinção de espécies (Wilcox & Murphy, 1985; Tilman et al., 35
1994; Sala et al., 2000; Brooks et al., 2002). Lamentavelmente, nosso conhecimento sobre a biodiversidade do 36
planeta ainda é inadequado, com estimativas globais variando em ordens de magnitude, e muito da diversidade
37
que conhecemos ainda a ser formalmente catalogada, i.e. Impedimento Linneano (Brown & Lomolino, 1998; 38
Whittaker et al., 2005). Ademais, dentre as espécies que conhecemos, também temos, para vários taxa, um 39
conhecimento inadequado de suas distribuições globais, regionais e até mesmo locais, um problema denominado
40
por Lomolino (2004) como Impedimento Wallaceano . Neste cenário, Whittaker et al. (2005) evidenciaram a 41
“Biogeografia da Conservação”, uma vertente dos estudos biogeográficos que busca aplicar princípios, teorias e
42
análises biogeográficas - relativos às dinâmicas distribucionais de táxons individual e coletivamente – a
43
problemas referentes à conservação da biodiversidade.
44
Deste modo, em face ao elevado ritmo de perda de hábitat e à falta de tempo hábil para um
45
levantamento e acompanhamento para diagnose de todas as espécies nos seus respectivos ambientes, a utilização
46
de dados de coleções e modelos de distribuição potencial apresenta-se como opção pouco dispendiosa e também
47
eficiente em iniciativas para estudos de padrões gerais biogeográficos e de conservação (Ferrier, 2002; Loiselle
48
et al., 2003; Raxworthy et al., 2003; Kadmon et al., 2004; Soberón & Peterson, 2004; Guisan & Thuiller, 2005; 49
Drew, 2011). O desenvolvimento de modelos de distribuição de espécies é acompanhado por uma produção
50
constante de artigos abordando novas metodologias, vieses e soluções para seus problemas (Peterson & Cohoon,
51
1999; Graham et al., 2004; Phillips et al., 2004; Hernandez et al., 2006; Peterson, 2006), além de revisões 52
comparativas quanto à eficácia de uma ou outra abordagem (e.g. Guisan & Zimmermann, 2000; Elith et al., 53
2006).
54
Embasado na biogeografia da conservação, que tem como uma das suas principais ferramentas a
55
utilização de dados computadorizados e ferramentas analíticas para auxiliar na solução de problemas ligados à
56
conservação da biodiversidade (Whittaker et al., 2005), busquei neste estudo avaliar os impactos atuais e 57
futuros da perda de hábitat sobre a diversidade e distribuição dos répteis Squamata endêmicos do Cerrado. Meu
objetivo central é avaliar como estes cenários de perda interferirão no grau de risco de extinção de cada espécie,
59
classificando cada espécie de acordo com as categorias de ameaça da União Internacional Para Conservação da
60
Natureza - IUCN (IUCN, 2010; Bird et al., 2011). 61
Para tal, elaborei mapas atualizados de distribuição para todas 105 espécies de Squamata endêmicos do
62
Cerrado por meio de modelos de distribuição espacial (Species distribution models - SDM) (ver Guisan & 63
Zimmermann, 2000; Elith et al., 2006) ou mapas de micro bacias quando para representar a distribuição das 64
espécies raras e com poucos registros de ocorrência (ver Nogueira et al., 2010). Os mapeamentos partiram de 65
uma base de registros previamente revisada contendo dados de coleção e fontes bibliográficas seguras (ver 66
Nogueira et al., 2011). Os mapas de distribuição produzidos foram cruzados com projeções futuras para 67
remanescentes de áreas nativas do Cerrado em dois cenários distintos, um no qual as taxas atuais são mantidas
68
sem intervenção ou controle governamental (cenário BAU –Business as Usual), e outro construído a partir da 69
ação governamental para redução das taxas de desmatamento (cenário GOV –Governance). Cada cenário foi 70
ainda estudado em dois intervalos de tempo: de 2010 a 2020 e de 2010 a 2030. Como demandado pela IUCN,
71
além dos diferentes cenários para inserção de margem de incerteza na análise, revisei todas as espécies
72
utilizando os critérios A e B, dependentes de dados de distribuição espacial (IUCN, 2010).
73
Frente aos resultados, fiz a diagnose da distribuição das espécies ameaçadas revisadas neste trabalho
74
frente aos padrões de ameaça impostos pelo desmatamento. A partir desta identifiquei três tipos áreas
75
prioritárias à conservação: áreas de crise (pontos de alta diversidade que provavelmente serão perdidos nos
76
próximos dez anos), áreas de refúgio (pontos de alta diversidade, mas que deverão ser mantidos nos próximos
77
dez anos) e áreas altamente insubstituíveis (cf. Bird et al., 2011). 78
O segundo objetivo do trabalho é calcado em uma das constatações centrais da biogeografia da
79
conservação: tanto espécies quanto ameaças não estão distribuídas ao acaso no espaço (Whittaker et al., 2005; 80
Ladle & Whitakker, 2011). Para grupos de Squamata endêmicos do Cerrado, análises recentes detectaram níveis
81
significativos de regionalização, formando sete conjuntos de espécies co-distribuídas e regionalizadas (Nogueira
82
et al., 2011). Desta forma testei se a perda de hábitat se dá de maneira aleatória no Cerrado através destes 83
conjuntos regionais de espécies endêmicas. Com este objetivo comparei as perdas de hábitat das espécies de
84
Squamata endêmicos do Cerrado entre e dentro de cada um dos elementos bióticos (EB) (Guedes et al., 2014). 85
Esta análise foi construída a partir da intersecção das áreas de distribuição de cada uma das espécies
86
pertencentes a cada EB com as perdas de superfície do domínio ocorridas até 2010. Por fim, as perdas sofridas
dentro e entre cada EB foram comparadas via teste de Kruskall-Wallis, utilizando cada espécie como uma
88
amostra distinta das perdas para cada EB. No trabalho assumi que diferenças significativas para o teste entre
89
quaisquer dois EBs representam perdas diferenciadas entre regiões dentro do Cerrado. Verifiquei também a
90
representatividade das unidades de conservação de proteção integral frente aos padrões de regionalização de
91
Squamata do Cerrado, testando se a proteção se dá de modo aleatório nos diferentes EBs (cf. Guedes et al., 92
2014).
93
Escolhi utilizar a análise de EB como metodologia de agrupamento de espécies devido à sua
94
estruturação metodológica. A análise de EB é um método relativamente recente de detecção de padrões
95
biogeográficos que testa duas predições centrais do modelo de diversificação vicariante (Hausdorf, 2002;
96
Hausdorf & Hennig, 2003), um dos processos tidos como principais na distribuição da diversidade biológica do
97
planeta (Croizat et al., 1974; Crisci, 2001; Hausdorf & Hennig, 2004). Segundo a análise, se processos 98
vicariantes foram importantes no passado, devemos observar duas características principais no conjunto de
99
distribuições presentes numa dada região ou área: (1) grupos de espécies significativamente co-distribuídas
100
(EB), cujas distribuições são mais próximas entre si do que com outros grupos de espécies, devem existir e ser
101
detectáveis, como assinaturas de processos históricos de segregação de biotas; e (2) espécies filogeneticamente
102
próximas deverão compor EB distintos, como resultado da segregação histórica (Hausdorf, 2002; Hausdorf &
103
Hennig, 2003).
104
Deste modo, EB podem ser interpretados não apenas como um mero padrão espacial de regionalização,
105
mas também como o resultado de processos históricos de segregação vicariante, causada pelo surgimento de
106
barreiras biogeográficas históricas (Hausdorf, 2002). Portanto, ao analisarmos as perdas de hábitat e a
107
distribuição de unidades de conservação de proteção integral sobre EB estamos não apenas considerando a
108
proteção de padrões regionais, mas principalmente, a proteção de processos históricos geradores de
109
biodiversidade que se manifestam através dos conjuntos de espécies significativamente regionalizados (e.g. 110
Guedes et al., 2014). 111
Como último passo do trabalho, para identificar eventuais diferenças na distribuição da cobertura de
112
áreas de conservação permanente através do domínio do Cerrado, realizei outras duas análises: (a) verifiquei a
113
cobertura das unidades de conservação de proteção integral frente a cada uma das áreas prioritárias à
114
conservação; (b) comparei a cobertura das mesmas entre cada um dos diferentes EB distribuídos pelo domínio.
Esta dissertação tem seu único capítulo estruturado em formato de artigo a ser submetido para o
116
periódico Diversity and Distributions em co-autoria com meu orientador, Cristiano de C. Nogueira e e o
117
Prof.Dr.Ricardo B. Machado, pesquisador e docente da Universidade de Brasília. Todas suas citações, tabelas,
118
figuras e lista de referências bibliográficas seguem o formato exigido pelo periódico. O Apêndice “Appendix
119
S1” foi separado em três partes para facilitar sua visualização.
120
REFERÊNCIAS
121
Ab’Saber, A.N. (1977) Os domínios morfocliáticos da América do Sul: Primeira aproximação. Geomorfologia, 122
52, 1-22
123
Alho, C.J.R., Martins E.S. (1995) Bit by bit the Cerrado loses space. Brasília, DF Brazil: WWF
124
Bird, J.P., Buchanan, G.M., Lees, A.C., Clay, R.P., Develey, P.F., Yépez, I & Butchart, H.M. (2011) Integrating
125
spatially explicit projections into extinction risk assessments: A reassessment of Amazonian avifauna
126
incorporating projected deforestation. Diversity and distributions, 1-9 127
Brooks, T.M., Mittermeier, R.A., Mittermeier, C.G., Fonseca, G.A.B., Rylands, A.B., Konstant, W.R., Flick, P.,
128
Pilgrim, J., Oldfield, S., Magin, G. & Hilton-Taylor, C. (2002) Habitat loss and extinction in the
129
hotspots of biodiversity, Conservation Biology. 16, 909-923. 130
Brown, J.H., Lomolino, M.V. (1998) Biogeography, 2nd ed. Sinauer Associates, Sunderland, MA, 691pp. 131
Colli, G.R., Bastos, R.P. & Araújo, A.F.B. (2002) The characters and dynamics of the Cerrado herpetofauna.
132
The Cerrados of Brazil: Ecology and Natural History of a Neotropical Savanna (ed. by P.S. Oliveira and
133
R.J. Marquis), pp. 223-241. Columbia University Press, New York. 134
Costa, G.C., Nogueira, C., Machado, R.B. & Colli, G.R. (2007) Squamate richness in the Brazilian Cerrado and
135
its environmental-climatic associations. Diversity and Distributions, 13, 714-724. 136
Crisci, J.V. (2001) The voice of historical biogeography. Journal of Biogeography, 28, 157-168. 137
Croizat, L., Nelson, G. & Rosen, D.R.(1974) Centers of origin and related concepts. Systematic Zoology, 23, 138
265-287.
139
Drew, J. (2011) The role of natural history institutions and bioinformatics in conservation biology. Conservation 140
Eiten, G. (1972) The Cerrado vegetation of Brazil. The Botanical Review, 38, 201-341 142
Elith, J., Graham, C.H., Anderson, R.P., Dudik, M., Ferrier, S., Guisan, A., Hijmans, R.J., Huettmann, F.,
143
Leathwick, J.R., Lehmann, A., Li, J., Lohmann, L.G., Loiselle, B.A., Manion, G., Moritz, C., Nakamura,
144
M., Nakazawa, Y., Overton, J.M., Peterson, A.T., Phillips, S.J., Richardson, K., Scachetti-Pereira, R.,
145
Schapire, R.E., Soberon, J., Williams, S., Wisz, M.S. & Zimmermann, N.E. (2006) Novel methods
146
improve prediction of species’ distributions from occurrence data. Ecography, 29, 129–151 147
Ferrier, S. (2002) Mapping spatial pattern in biodiversity for regional conservation planning: Where to from
148
here? Systematic Biology, 51, 331-363. 149
Graham, C.H., Ferrier, S., Huettman, F., Moritz, C. & Peterson, A.T. (2004) New developments in
museum-150
based informatics and applications in biodiversity analysis. Trends in Ecology & Evolution, 19, 497-503. 151
Guedes, T.B., Sawaya, R.J. & Nogueira, C.C. (2014) Biogeography, vicariance, and conservation of snakes of
152
the neglected and endangered Caatinga region, Northeastern Brazil. Journal of Biogeography. 153
Guisan, A. & Zimmermann, N.E. (2000) Predictive habitat distribution models in ecology. Ecology Modelling, 154
135, 147-186.
155
Guisan, A. & Thuiller, W. (2005) Predicting species distribution: offering more than simple habitat models.
156
Ecology Letters, 8, 993-1009. 157
Hausdorf, B. (2002) Units in biogeography. Systematic Zoology, 51, 648-652. 158
Hausdorf, B. & Hennig, C. (2003) Biotic element analysis in biogeography. Systematic Biology, 52, 717-723.
159
Hausdorf, B. & Hennig, C. (2004) Distance-based parametric bootstrap tests for clustering of species ranges.
160
Computational Statistics and Data Analysis, 45, 875–895. 161
Hernandez, P.A., Graham, C.H., Master, L.L. & Albert, D.L. (2006) The effect of samples size and species
162
characteristics on performance of different species distribution modeling methods. Ecography, 29, 773-163
785.
164
IUCN (2010) Guidelines for using the IUCN Red List Categories and Criteria: version 8.1. IUCN Species
165
Survival Commission, International Union for the Conservation of Nature, Gland, Switzerland and
166
Cambridge, UK.
Kadmon, R., Farber, O. & Danin, A. (2004) Effect of roadside bias on the accuracy of predictive maps produces
168
by bioclimatic models. Ecological Applications, 14, 401-413. 169
Klink, C.A. & Moreira, A.G. (2002) Past and current human occupation, and land use. The Cerrados of Brazil: 170
Ecology and Natural History of a Neotropical Savanna (ed. by P.S. Oliveira and R.J.Marquis), pp.69-171
88. Columbia University Press, New York, New York.
172
Klink, C.A. & Machado, R.B. (2005) Conservation of the Brazilian Cerrado. Conservation Biology, 19, 707-173
713.
174
Ladle, R.J. & Whittaker, R.J. (2011) Conservation biogeography,. Oxford: Wiley-Blackwell, New York. 175
Loiselle, B.A., Howell, C.A., Graham, C.H., Goerck, J.M., Brooks, T., Smith, G.S. & Williams, P.H. (2003)
176
Avoiding pitfalls of using species distribution models in conservation planning. Conservation Biology, 177
17, 1591-1600.
178
Lomolino, M.V. (2004) Conservation biogeography. Frontiers of Biogeography: New Directions in the 179
Geography of nature (ed. by M.V. Lomolino and L.R. Heaney). Sinauer Associates, Sunderland, 180
Massachusetts.
181
Machado, R.B., Ramos Neto, M.B., Pereira, P., Caldas, E., Gonçalves, D, Santos, N., Tabor, K. & Steininger,
182
M. (2004) Estimativas de perda da área do Cerrado brasileiro. Conservation International do Brasil, 183
Brasília (in Portuguese).
184
Machado, R.B., Aguiar, L.S., Castro, A.A.J.F., Nogueira, C.C. & Ramos Neto, M.B. (2009) Caracterização da
185
fauna e flora do Cerrado. Savanas: Desafios e Estratégias para o Equilíbrio entre Sociedade, 186
Agronegócio e Recursos Naturais (ed. By F.G. Faleiro and A.L. Farias Neto). pp.295-300, Embrapa 187
Cerrados, Planaltina, Brazil.
188
Mittermeier, R.A., Robles Gil, P., Hoffmann, M. et al. (2004) Hotspots Revised, Mexico City, CEMEX. 189
MMA (2011) Monitoramento do desmatamento nos biomas brasileiros por satélite, acordo de cooperação
190
técnica MMA/IBAMA, monitoramento do bioma Cerrado 2009-2010
191
Myers, N., Mittermeier, R.A., Mittermeier, C.G., da Fonseca, G.A.B. & Kent, J. (2000) Biodiversity hotspots
192
Myers (2003) Biodiversity hotspots revised. BioScience, 53, 916-917. 194
Nogueira, C., Colli, G.R. & Martins, M. (2009) Local richness and distribution of the lizard fauna in natural
195
habitat mosaics of the Brazilian Cerrado. Austral Ecology, 34, 83-96. 196
Nogueira C., Buckup, P.A., Menezes, N.A., Oyakawa, O.T., Kasecker, T.P., Ramos Neto, M.B. & Silva, J.M.S.
197
(2010) Restricted-range fishes and the conservation of brazilian freshwaters. Plos one, 5(6), e11390 198
Nogueira, C., Ribeiro, S, Costa, G.C. & Colli, G.R. (2011) Vicariance and endemism in a Neotropical savanna
199
hotspot: Distribution patterns of Cerrado squamate reptiles. Journal of Biogeography, 1-16. 200
Oliveira-Filho, P.S. & Ratter, J.A. (2002) Vegetation Physiognomies and woody flora of the Cerrado Biome.
201
The Cerrados of Brazil: Ecology and Natural History of a Neotropical Savanna. (ed. by P.S. Oliveira 202
and R.J. Marquis). Columbia University Press, New York.
203
Peterson, A.T. (2006) Uses and requirements of ecological niche models and related distributional models.
204
Biodiversity Informatics, 3, 59-72. 205
Peterson, A.C. & Cohoon, K.C. (1999) Sensitivity of distributional prediction algorithms to geographic data
206
completeness. Ecological Modelling, 117, 159-164. 207
Phillips, S.J., Dudik, M. & Shapire, R.E. (2004) A maximum entropy approach to species distribution modeling. 208
Proceedings of the 21st international conference on machine learning (ed. by Greiner, R. & 209
Schuurmans, D.) pp.655-662. ACM Press Banff, Canada.
210
Pimm, S.L., Russell, G.J., Gittleman, J.L. & Brooks, T.M. (1995) The future of biodiversity. Science, 269, 347-211
350.
212
Ratter, J.A., Ribeiro, J.F. & Bridgewater, S. (1997) The Brazilian Cerrado vegetation and threats to its
213
biodiversity. Annals of Botany, 80, 223-230. 214
Raxworthy,C., Martinez-Meyer, E., Horning, N., Nussbaum, R.A., Schneider, G.E., Ortega-Huerta, M.A. &
215
Peterson, T. (2003) Predicting distributions of known and unknown reptiles species in Madagascar.
216
Nature, 426, 837-841. 217
Sala, O.E., Chaping, F.S.I, Armesto, J.J., Berlow, E., Bloomfield, J., Dirzo, R., Huber-Sanwald, E., Huenneke,
218
L.F., Jackson, R.B., Kinzig, A., Leemans, R., Lodge, D.M., Mooney, H.A., Oetersheld, M., Poff, N.L.,
Sykes, M.T., Walker, B.H., Walker, M., Wall, D.H. (2000) Global biodiversity scenarios for the year
220
2100. Science, 287, 1770-1774. 221
Silva, J.M.C. & Bates, J.M. (2002) Biogeographic patterns and conservation in the South American Cerrado: A
222
tropical savanna hotspot. BioScience, 52, 225-233.
223
Soberón, J. & Peterson, A.T. (2004) Biodiversity informatics: Managing and applying primary biodiversity data.
224
Philosophical Transactions of the Royal Society of London Series B, Biological Sciences, 359, 689-698. 225
Tilman, D., May, R.M., Lehman, C.L. & Nowak, M.A. (1994) Habitat destruction and the extinction debt.
226
Letters to Nature, 371, 65-66. 227
Valdujo P.H., Silvano, D.L., Colli, G. & Martins, M. (2012) Anuran species composition and distribution
228
patterns in Brazilian Cerrado, a Neotropical hotspot. South American Journal of Herpetology, 7, 63-78. 229
Vanzolini, P.E. (1948) Notas sobre os ofídios e lagartos da Cachoeira de Emas, no município de Pirassununga,
230
estado de São Paulo. Revista Brasileira de Biologia., 8, 377-400. 231
Vanzolini, P.E. (1963) Problemas Faunísticos do Cerrado. Simpósio sobre o Cerrado (ed. M. Ferri) pp.307-20. 232
Editora da Universidade de São Paulo, São Paulo. 233
Vanzolini, P.E. (1976) On the lizards of a cerrado-caatinga contact, evolutionary and zoogeographical
234
implications (Sauria). Papéis Avulsos de Zoologia São Paulo, 29, 111-119. 235
Vanzolini, P.E. (1988) Distribution patterns of South American lizards. Proceedings of a Workshop on 236
Neotropical Distribution Patterns (ed. by P.E. Vanzolini and W.R. Heyer) pp. 317-343. Academia 237
Brasileira de Ciências, Rio de Janeiro.
238
Vitt, L.J. (1991) An introduction to the ecology of Cerrado lizards. Journal of Herpetology, 25, 79-90. 239
Vitt, L.J. & Caldwell, J.P. (1993) Ecological observations on Cerrado lizards in Rondônia, Brazil. Journal of 240
Herpetology, 27, 46-52. 241
Werneck, F.P. & Colli, G.R. (2006) The lizard assemblage from seasonally dry tropical forest enclaves in the
242
Whittaker, R.J., Araújo, M.B., Jepson, P., Ladle, R.J., Watson, J.E.M. & Willis, K.J. (2005) Conservation
244
biogeography: Assessment and prospect. Diversity and Distributions, 11, 3-23. 245
Wilcox B.A. & Murphy, D.D. (1985) Conservation Strategy: The effects of fragmentation on extinction. The 246
Article type: Biodiversity research
1
2
Habitat loss and conservation of Brazilian Cerrado endemic Squamate Reptiles
3
4
Pietro L.H. de Mello1, Ricardo B. Machado2 & Cristiano C. Nogueira2,3 5
6
¹ Programa de Pós-Graduação em Ecologia, Instituto de Ciências Biológicas (IB), Universidade de Brasília
7
(UnB), 70910-900, Brasília, DF, Brazil. Corresponding author: hollandademello@gmail.com
8
² Departamento de Zoologia, Instituto de Ciências Biológicas (IB), Universidade de Brasília (UnB), 70910-900,
9
Brasília, DF, Brazil.
10
³ Present adress: Museu de Zoologia da Universidade de São Paulo (MZUSP), Laboratório de Herpetologia.
11
Av.Nazaré, 481, Ipiranga, 04263-000, São Paulo, SP, Brazil.
ABSTRACT
13
Aim To assess extinction risk of Cerrado endemic Squamates based on spatially explicit scenarios of future
14
habitat loss; test if habitat losses pose significant, non-random threats to Cerrado biogeographical patterns; test
15
if biogeographical patterns and priority protection areas detected for Cerrado endemic Squamates are adequately
16
represented by the existing protected areas network.
17
Location Brazilian Cerrado.
18
Methods For all 105 Cerrado endemic Squamates we revised extinction risk estimates through inferred
19
population declines combining updated species distribution maps with spatially explicit future habitat loss
20
scenarios. We overlapped remaining species ranges in order to detect three major regions of conservation
21
concern indicating short and long term spatial priorities for conservation. Finally, we examined the overlap
22
between biogeographical units and spatial patterns of habitat loss and protected area coverage.
23
Results The number of threatened species rose from three (2.85% of total, current redlist) to at least 78 (74%).
24
Habitat loss and protected area coverage are significantly different between biotic elements; crisis and refugia
25
areas are located in the south-central region, while irreplaceable areas are scattered through Cerrado remaining
26
areas; all three priority regions are currently poorly protected, and the southern biotic element is less protected
27
than its northern counterparts.
28
Main conclusions The application of the IUCN Red List criteria here presented substantially raised the number
29
of accessed and threatened species, being recommended for other taxonomic groups in highly threatened and
30
still poorly studied regions. Important areas are not secured and biogeographical process and patterns may be
31
lost in the near future if proper action is not taken. There is an urgent need for expanding protected area cover
32
and to reduce the pace of deforestation in the Cerrado.
33
Keywords: Biodiversity, Conservation biogeography, Deforestation, Distribution patterns, IUCN status,
34
Species distribution models.
35
INTRODUCTION
36
Biodiversity and its threats are not randomly distributed throughout the world (Myers et al., 2000; 37
Whittaker et al., 2005; Ladle & Whittaker, 2011) and diverse approaches to planning global protection areas for 38
along with species diversity (Myers et al., 2000), due to the recent alarming rates of the former (Brooks et al., 40
2002; Fahrig, 2003), is one of them . As a response to such elevated habitat loss and its direct negative effects
41
on biodiversity (Wilcox & Murphy, 1985; Sala et al., 2000; Brooks et al., 2006; Collen et al., 2009; Bohm et 42
al., 2013), a new branch of biodiversity science has gained strength: Conservation Biogeography (Whittaker et 43
al., 2005, Ladle & Whittaker, 2011). 44
This new area merges the traditional biogeographical concern with species distribution through space
45
and time (Brown & Lomolino, 1998) with the application of biogeographical principles, theories and analyses to
46
present alternatives and solutions to the urgent problems related to the conservation of biodiversity (Whittaker et 47
al., 2005). Biogeographical units provide highly valuable information on what spatial portions of biodiversity 48
should be conserved (Crisci, 2001; Whittaker et al., 2005), and among the criteria for detecting areas of high 49
conservation value, endemism patterns stand out as both highly relevant and corresponding to biogeographic
50
questions (Pullin, 2002).
51
Noteworthy in this worldwide scenario of the biodiversity crisis (McKinney & Lockwood, 1999; Pimm
52
& Raven, 2000; Davies et al., 2006) is the Brazilian Cerrado and its endemic Squamate. As happens globally 53
biodiversity and its threats are not randomly distributed in the region (Myers et al., 2000; Whittaker et al., 2005; 54
Ladle & Whittaker, 2011), with deforestation following a south-north trend (Klink & Moreira, 2002; Silva &
55
Bates, 2002; Machado et al., 2004) and most of this conversion occurring in open, interfluvial savanna habitats 56
(Klink & Machado, 2005). Due to its high levels of vascular plant endemism (e.g. Ratter et al., 1997), and such 57
high percentages of habitat loss (Machado et al., 2004) the Cerrado region is the only savanna included among 58
the 34 hotspots of biodiversity (Myers et al., 2000; Myers, 2003; Mittermeier et al., 2004). 59
Recent studies have shown that the Cerrado harbours a rich (over 260 species) and highly endemic
60
Squamate fauna, with 103 endemic species, about 40% of total richness (Nogueira et al., 2011). This fauna is 61
now known to be dominated by species tightly associated to specific microhabitats (Gainsbury & Colli, 2003;
62
Mesquita et al., 2006), and unevenly distributed in habitat mosaics (Colli et al., 2002; Nogueira et al., 2005). 63
Observed regionalized, significant patterns of species co-ocurrence in the group agree with the prediction of the
64
vicariant model of diversification, indicating that current diversity and distributional patterns are a possible
65
result of a long history of allopatric diversification and in situ speciation (Nogueira et al., 2011). 66
However, despite advances in detecting biogeographical patterns in the Cerrado, we still know little
67
about the threat levels and future impacts of habitat loss on this previously poorly studied fauna. Even with
recent efforts to expand the coverage of threat assessments in Reptilia (Bohm et al., 2013) only twelve of the 69
103 Cerrado endemic Squamate species (Nogueira et al., 2011) had been assessed until January 2014 in the Red 70
List of Threatened Species - IUCN (IUCN, 2014). Three of them (Bachia bresslaui, Philodryas livida and 71
Tantilla boipiranga) were classified in threatened categories. Furthermore habitat loss, which is the single most 72
important threat to Reptiles worldwide (Gibbons et al., 2000, Vié et al., 2008; Collen et al., 2009; Bohm et al., 73
2013), tends to increase in Brazil due to the approval of the new National Forest Code (Brasil, 2012). The
74
coincidence of the group’s local richness, endemism and habitat loss in open interfluvial plateaus threatens to
75
erase ancient and highly complex evolutionary patterns and processes (Nogueira et al., 2011). 76
In this study, we aim to: reassess extinction risk of the Cerrado endemic Squamates (Nogueira et al., 77
2011) by inferring the population decline based on herein built projected deforestation estimates under
78
governance (GOV) and business as usual (BAU) scenarios, for two future time frames; evaluate the
79
conservation of biogeographical patterns and processes by contrasting regionalized species distributions with
80
satellite based habitat loss and protected area cover, searching for non-random patterns; test the hypothesis that
81
protected areas are randomly distributed across the Cerrado in order to verify if current protection areas
82
throughout the region representatively covers regions of Squamate biogeographical patterns and processes; and
83
based on revised distribution maps and future habitat loss patterns we map three types of spatial priorities in the
84
Cerrado (cf. Bird et al., 2011), namely: (a) crisis areas (b) refugia areas and (c) highly irreplaceable areas. These 85
three types of spatial priorities will enable us to: (1) evaluate the capacity of future remaining areas to buffer
86
against future loss; and (2) to detect priority sites for future expansion and management of the protected area
87
network in the face of rapid projected land coverage modifications.
88
METHODS
89
Study area
90
The Cerrado is the second largest South American domine of phytophisiognomies (Ab’Saber, 1977;
91
Ratter et al., 1997; Silva & Bates, 2002) covering 2.03 million km2, around 23% of the Brazilian territory. It is a 92
seasonally dry tropical savanna (Nimer, 1979), with two major geomorphological units (Silva, 1997; Silva et al., 93
2006): gently rolling or level headwater plateaus, dominated by open grassy savannas and grasslands; and
94
peripheral depressions that harbors a more complex matrix of savannas and semi decidous forests crossed by
95
widespread tracts of gallery forests along major drainage systems (Eiten, 1972; Cole, 1986; Oliveira-Filho &
96
Ratter, 2002). Detailed data on Cerrado ecology and natural history can be found in Oliveira & Marquis (2002).
Data sources
98
Prior to building each species’ potential distribution we used the Brazilian Biomes Map (IBGE, 2004)
99
to define approximate limits of the Brazilian Cerrado, and restricted all projections of land coverage
100
modifications and species distributions to these boundaries.Endemic species, or distributions in marginal and
101
peripheral Cerrado areas were not considered. Past land coverage modifications for the Cerrado (2002 and 2010)
102
were obtained from the Project of Satellite Deforestation Monitoring of Brazilian Biomes (PMDBBS, 2013).
103
Cerrado protected areas were defined as those in categories I-III in Dudley (2008) of the current Brazilian
104
protected area system (Brasil, 2000) to define strictly protection areas.
105
We downloaded all 19 climatic variables and altitude from the WorldClim project (Hijmans et 106
al,2005). To define which variables should be included in the model we built a correlation matrix (see Costa et 107
al., 2010), and retained only the following non correlated (r>0.9) layers: altitude (ALT), mean diurnal 108
temperature range (BIO2), isothermality (BIO3), temperature seasonality (BIO4), maximum temperature of
109
warmest month (BIO5), minimum temperature of the coldest month (BIO6), temperature annual range (BIO7),
110
mean temperature of wettest quarter (BIO8), mean temperature of the warmest quarter (BIO10), annual
111
precipitation (BIO12), precipitation of the driest month (BIO14), precipitation seasonality (BIO15),
112
precipitation of the wettest month (BIO16), precipitation of the warmest quarter (BIO18), and precipitation of
113
the coldest quarter (BIO19). To maintain consistency we represented all variables at 5 x 5 km spatial resolution,
114
and processed species distribution data and habitat loss in a geographical information system.
115
Endemic Squamate species detected in Nogueira et al.(2011) were mapped based on a revised database 116
of vouchered point locality records in zoological collections, and complemented by standardized fieldwork to
117
fill former sampling gaps (see Nogueira et al., 2009, 2011). This list was further updated with a compilation of 118
more recent literature records, from 2010 onwards (Appendix S1). Species names follow Bérnils & Costa
119
(2012). Current data on assessed species and their respective risk categories were obtained from through an
120
individual conference for each species on the online IUCN`s RedList, in January 2014 (IUCN, 2014).
121
Model construction of land coverage modification
122
Our land coverage modification model projected the natural coverage for the entire Cerrado from 2010
123
to 2020 and to 2030. We used the Land Change Modeler (LCM) available in Idrisi selva software (Eastman,
124
2011) to build two different scenarios: Business as usual (BAU) and Governance (GOV) on an yearly basis. We
created both scenarios using the euristic algoritm and a transition probability matrix based on the comparison of
126
the deforestation observed between 2002 and 2008 years. As explanatory variables, we used digital elevation
127
model and annual accumulated precipitations (Hijmans et al., 2005), proximity to roads, proximity to recent 128
deforested areas and proximity to cities (Brasil, 2013).
129
The BAU scenario represents a future situation for the natural coverage of the Cerrado when the
130
Government takes no intervention action. It means that Brazil will maintain the current deforestation rate,
131
estimated in 14,200 km2/year (Brasil, 2009), and no further protected area will be created on the Cerrado. On the 132
other hand, the GOV scenario assumes a total reduction on the deforestation rate on the priority areas for
133
biodiversity conservation as defined by Brasil (2006) and maintenance of all strict protection areas as they are
134
nowadays. The GOV scenario was built based on the UN’s Aichi biodiversity target 5 that expects that the rate
135
of loss of all natural habitats is at least halved by 2020 (CBD, 2013). Thus, in GOV scenario we assumed that
136
the probability of habitat loss was halved between 2008-2020 and 2020-2030, not allowing habitat loss in
137
permanent protection areas. Details about the assessment of models precision can be viewed in Faleiro et al. 138
(2013).
139
Estimating species ranges
140
We estimated species’ distribution through two different methods. For species with at least 11 locality
141
records, we produced species distribution models via Maxent (Phillips et al., 2004, 2006; Phillips & Dudik, 142
2008). Maxent is a presence-only, new generation distribution model (SDM) algorithm that has been shown to
143
outperform other modeling techniques (Phillips et al., 2004; Elith et al., 2006; Costa et al.,2010). To use all the 144
information available in our dataset, beyond using Maxent v.3.3.3k default program parameters (see Phillips & 145
Dudik, 2008), each species had ten different jackknifed replicates built under “randomseed” bootstrapping. By
146
selecting “randomseed” in Maxent we ordered the program to select a different random test/train partition and a
147
different random subset of the background each time the analysis ran. Model performance was verified through
148
AUC (Fielding & Bell, 1997; Manel et al., 2011, but see Luoto et al., 2005 and Peterson et al., 2008 for critics) 149
(see Data S1 for further details and threshold). 150
Although Maxent has been shown to have good performance with small samples (Elith et al., 2006; 151
Garcia, 2006; Phillips & Dudik, 2008; Costa et al., 2010) we obtained inconsistent model outputs for some of 152
our data. Consequently for species with ten or less locality records we mapped ranges according to the
153
group of all adjacent watersheds that were in contact with a 50km radius buffer centered in each georeferenced
155
collection point. Since watersheds are commonly divided in smaller components, their chosen order of
156
magnitude must be related to the research purposes: in this paper we use the 5th order Ottobasins. Ottobasins are 157
watersheds defined as part of the Brazilian National Hydrographic Division (Brasil, 2003), following the
158
Pfafstetter (1987) method. According to this classification, 1st order Ottobasins correspond to the ten largest 159
South American watersheds, the following order Ottobasin is always a subdivision of the preceding based on its
160
major tributaries from its mouth to its headwaters. We chose watersheds due to its awareness to regional
161
topographic characteristics (Nogueira et al., 2010). 162
Identifying threatened species
163
To assess extinction risk we used as a baseline each species’ distribution in 2010, based on PMDBBS
164
Cerrado reminiscent areas (PMDBBS, 2013). Projected changes in the area of natural vegetation cover were
165
converted into percentage declines, and equivalent population declines. We based projected population declines
166
on the Cerrado according to BAU and GOV scenarios and adjusted decline estimates incorporating uncertainty
167
in generation lengths and habitat type (see Data S1). Due to lack of information about generation length, which 168
is generally inferred or approximated for higher taxa in Squamate (Greene, 1997; Pianka & Vitt, 2003),
169
uncertainty was implemented by using two time frames: (1) 2010-2020, chosen as our default period, since most
170
endemic Squamate are small bodied , and species with such characteristics may show generation lenghts up to
171
ca. 3 years (Greene, 1997; Pianka & Vitt, 2003), fulfilling the the “ten years or three generations”
172
reccommendation, under criterion A4c (IUCN, 2010); and (2) 2010-2030, chosen with a more exploratory
173
purpose, aiming to show a possible risk trend to larger and longer living Squamate.
174
Habitat type uncertainty was implemented to account for the fact that species from open, interfluvial
175
areas are more impacted by habitat loss than forest species, as open interfluves are the main targets for
176
mechanized agriculture and cattle farming (Brasil, 1965, 2012; Klink & Machado, 2005). Moreover, Squamate
177
Reptiles are dominated by species with relatively low dispersal ability, small ranges (Gaston, 1996) and with
178
high habitat and microhabitat fidelity (Greene, 1997; Pianka & Vitt, 2003). Open area species or species with
179
lack of proper information had a 1:1 estimated habitat/population loss. For forest, generalist and riparian species
180
a 1:0.8 estimated habitat/population loss was implemented (Appendix S1). The 0.2 difference between forest
181
and riparian species is based in our assumption that all possible available open areas would eventually be
182
converted to agriculture (Klink & Machado, 2005), and therefore species typical of open habitat would suffer a
bigger impact than forest and riparian ones. Habitat preferences for each species were obtained in Nogueira et 184
al. (2011). 185
The same analysis was implemented between the years 2000-2010 in order to compare if such threats
186
were already menacing the Cerrado endemic Squamate fauna in the recent past. Species were majorly
187
reassigned to criterion A4c, based on an inferred population decline through projected habitat loss (IUCN, 2010;
188
Bird et al., 2011) in a time period including both the past and the future and B1ab(i,iii) for expected remaning 189
area coverage (IUCN,2001) (see Data S1 for further details). Revised categories were assigned where the 190
registered rate of decline warranted species uplisting in relation to previous classifications in different scenarios.
191
Biogeographical patterns
192
We analyzed the conservation of biogeographical patterns by comparing habitat loss among species
193
ranges within and among biotic elements (BE) (Hausdorf, 2002). The BE analysis was implemented in Nogueira
194
et al.(2011) to the endemic Squamate location dataset. Biotic element analysis is a method for detecting 195
biogeographical patterns that tests two central predictions of the vicariant model (Hausdorf, 2002; Hausdorf &
196
Hennig, 2003). According to the analysis, if vicariant processes were important in the past: (a) we should
197
observe species groups significantly co-distributed (Biotic elements, BE) with distributions, which must exist
198
and be detectable, closer to one another than to other species groups; and (b) philogenetically close species must
199
compose diferent BE, as a result of historical segregation (Hausdorf, 2002; Hausdorf & Hennig, 2003). The
200
seven proposed BE (Nogueira et al., 2011) are widespread throughout the Cerrado. 201
Percentages of habitat loss for each species in the BE were obtained by clipping projected original
202
distributions (totally conserved) with the remaining areas obtained in PMDBBS’s 2010 maps (PMDBBS, 2013),
203
and with 2020 spatially explicit projections. As most species forming BE are narrow ranged and known from
204
limited records we estimated distribution areas for each of the 49 species forming BE (Nogueira et al.,2011) 205
using the watershed approach. We opted not to use the Maxent approach in this analysis because it could
over-206
predict a potential distribution in regions disconnected from point localities (Loiselle et al., 2003; Eken et al., 207
2004), an undesired result in our biogeographical analysis. All spatial analysis was performed using ArcGis
208
9.3.1 (ESRI, 2009) and Xtools Pro10.
209
Biogeographical patterns and habitat loss
To calculate differences within BE rates of expected and observed habitat loss for each species within
211
each BE were compared by Kolmogorov-Smirnoff tests (see Crawley, 2007). Each species’ expected habitat 212
loss was calculated as: (each species estimated range) x (the averaged percentage of habitat loss of all species
213
within its BE) (Guedes et al., 2014). Observed and expected habitat loss values in all analysis were logit 214
transformed (see Warton & Hui, 2011) in R’s package car (R Core Team, 2013). Observed habitat loss and 215
protected area coverage was compared among BE by Kruskal-Wallis (Hollander & Wolf, 1973) and multiple
216
comparison tests (see Siegel & Castellan, 1988) via package pgirmess in R (R Core Team, 2012). To test if the 217
mapping technique had an effect on the result of habitat loss estimates we built Maxent and Watershed
218
estimated species distribution areas for all species with 11 or more locality points and compared their results in
219
habitat losses through Kruskal-Wallis test (Hollander & Wolf, 1973). We considered a significance level of 0.05
220
for all statistical analyses.
221
Priority areas for conservation
222
Priority areas for conservation were identified sensu Bird et al. (2011): (1) Crisis areas – all species 223
remaining areas in 2010 were overlaid and we selected the top 10% pixels with highest diversity expected to be
224
lost in the next 10 years; (2) Refugia – as in Crisis areas, but with the top 10% pixels with highest diversity not
225
expected to be lost within the next 10 years; (3) Highly irreplaceable areas – the value of each 5km² pixel to
226
each species was calculated as 1/[total extent of suitable habitat in 2010], and these values were summed for all
227
species occurring in each pixel to assess aggregate pixel irreplaceability. We compared the distribution of crisis
228
areas, refugia and highly irreplaceable areas with the distribution of current permanent protected areas (PAs).
229
RESULTS
230
Updated range maps, projected area losses and extinction risk reassessment
231
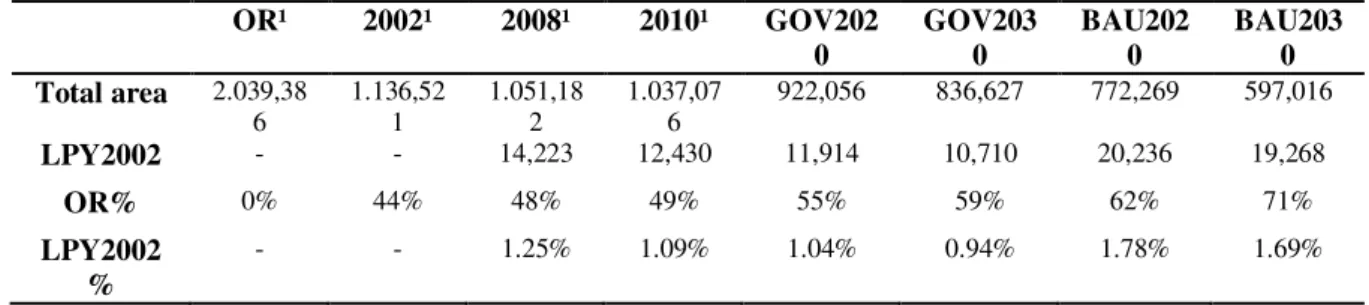
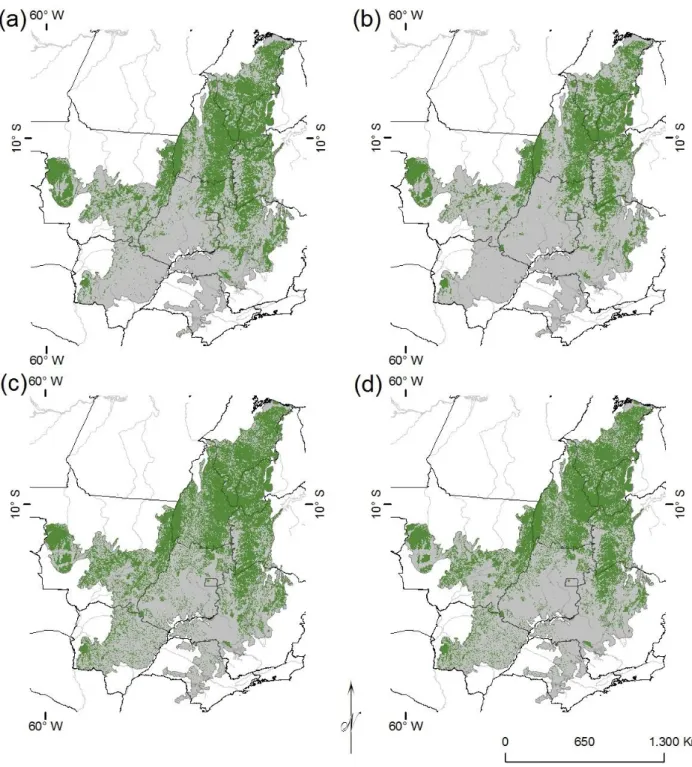
Based on our projections, remaining areas are expected to have been reduced respectively 55 and 62%
232
in 2020 under BAU and GOV scenarios in comparison to its original coverage (Fig. 1). We expect a minimum
233
loss of 0.94% per year through GOV 2030 scenario and a maximum of 1.78% to our BAU 2020 scenario (Table
234
1). There is no significant difference for species’ habitat loss between Maxent and watershed approaches when
235
both are built for the same species (Kruskall-Wallis = 1.6396, df=1, P = 0,2004). 236
In our reassessment between 2010 and 2020 under both IUCN criteria “A” and “B”, and incorporating
237
variation in population responses to fragmentation depending upon habitat type, 88 species (83.80%) were
classified in threatened categories under GOV scenario and 90 (85.71%) under BAU scenario. Reassessed
239
categories for both scenarios accounting for different uncertainties are available in Fig. 2. Among the seven
240
species assessed as Critically Endangered (CR) in BAU 2020 scenario (Amphisbaena sanctaeritae, Bothrops 241
itapetiningae, Liotyphlops schubartii, Phalotris multipunctatus, P.lativittatus, Philodryas livida and Trilepida 242
koppesi), four of them (Amphisbaena sanctaeritae, Phalotris multipunctatus, Philodryas livida and Trilepida 243
koppesi) are part of the southern located Paraná-Paraguay BE (Fig. 3), and the other three are not part of any BE 244
(Nogueira et al., 2011). Losses per species between its original coverage and 2010 ranged from 3% to 99% in 245
the same taxa throughout the region (Appendix S1). For Maxent modelled species all AUC values were above
246
0.75, considered as good model performance (Elith, 2002).
247
Biogeographical patterns, habitat loss and protected area coverage
248
No significant differences between observed and expected habitat loss among species within each BE
249
were detected (Appendix S2). Habitat loss, however, was significantly different among BE (Kruskall-Wallis =
250
25.9405, df = 6,P <0.005) (Table 2), with percentage of losses in BE 3 (Paraná-Paraguay) being significantly 251
different than those in BE 1 (Tocantins-Serra Geral, obs. df. = 31.48, critical dif. = 19.76) and BE 2
(Paraguay-252
Guaporé, obs. dif = 24.35, critical dif = 22.97) (Fig 3.a), a pattern expected to continue in our projected BAU
253
2020 scenario (Kruskall-Wallis = 31.7341, df = 6,P < 0.0005; Tocantins-Serra Geral, obs.dif = 32.59, critical dif 254
= 20.79; Paraguay-Guaporé, obs.dif = 31.83, critical dif = 24.17) (Fig. 3b). In general, species in BE were
255
poorly covered by protected areas, with an average of 2% PA coverage (Appendix S3). Additionally, PA
256
distribution was significantly different between BE 1 (Tocantins-Serra Geral) and 3 (Paraná-Paraguay)
257
(Kruskall-Wallis = 15.0397, df = 6, P < 0.05; obs.dif = 22.47, critical dif = 19.76), where the first has the most 258
coverage and the second one has the least coverage (Fig. 3c).
259
Priority areas for conservation
260
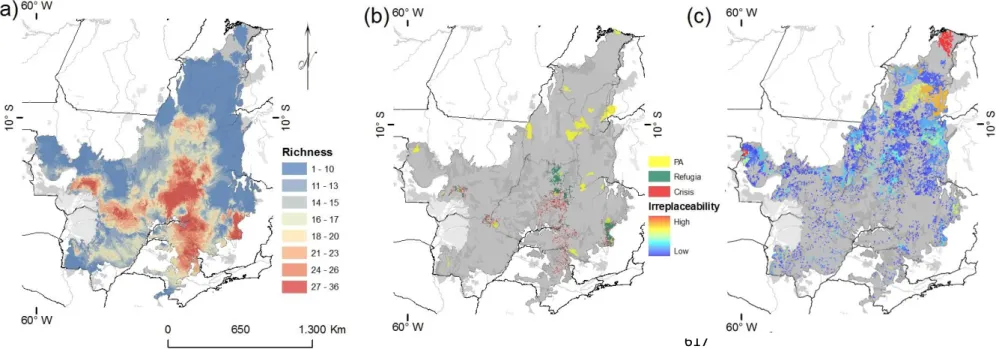
Endemic Squamates have higher richness in the central part of the Cerrado, with secondary peaks in the
261
southern and western parts (Fig. 5a). Crisis areas (Fig. 5b) occur solely as an extense narrow line from central
262
Cerrado (from the surroundings of Brasilia) to Northern São Paulo state and are close to Refugia areas in an area
263
west of the Espinhaço range, another area close to Chapada dos Guimarães plateau, and inthe surroundings of
264
the Emas National Park, near the frontier among Goiás, Mato Grosso and Mato Grosso do Sul states. Refugia
265
areas are also foundaround the Chapada dos Veadeiros region (North of Brasília). Highly irreplaceable areas are
266
scattered (Fig. 5c) throughout the region. Irreplaceability areas have the largest continuous area in the Northern
Maranhão state, with secondary regions in Northeastern (Bahia and Piauí) Cerrado and a highly irreplaceable
268
spot in the Western-most part of the region (Western Mato Grosso). Currently, protected areas cover only 1% of
269
Crisis areas, 11% of Refugia areas and 5% of highly irreplaceable areas.
270
DISCUSSION
271
A heterogeneously threatened region
272
High richness of Cerrado endemic Squamate in the South-Central portion of the region is shared with
273
multiple groups: small mammals (Faleiro et al., 2013), amphibians (Bini et al., 2006),and birds (Diniz-Filho et 274
al., 2009). This pattern and other high richness areas at the westernmost portion of the region in Mato Grosso, 275
close to the Pantanal and the Amazon Forest, and around the Emas National Park, one of the key conservation
276
areas in the Cerrado (Redford, 1985), are also shared among our data and Costa et al. (2007) results for both 277
endemic and non-endemic Squamate species. However a herein high endemic richness area (Fig. 5) overlaping
278
with the Espinhaço range was not among Costa et al. (2007) highest richness values. 279
The Espinhaço range is a region that also holds high endemism for birds (Silva, 1997), and amphibians
280
(Valdujo et al., 2012), and is an elevated metamorphic ridge that acts as a geographical barrier between the 281
Atlantic Forest and the Brazilian open formations (Ab’Saber, 1977), coupled with a massive environmental
282
heterogeneity. Since Squamate endemism has been suggested to be influenced by historical factors (Vitt et al., 283
2003; Mesquita et al., 2006; Nogueira et al., 2011) it is no surprise to find a high diversity of endemism in such 284
topographically and ecologically complex regions.
285
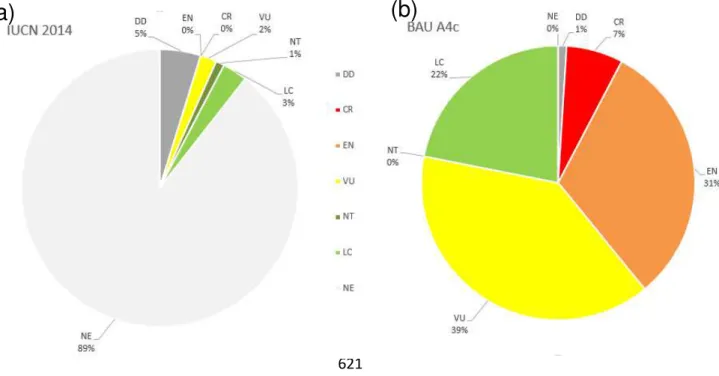
When we incorporated future projected population declines to our distribution models, we revealed that
286
Cerrado endemic Squamate are highly threatened, with an alarming raise in species numbers for threatened
287
categories and species uplisting (Appendix S4). Our data point in the same way of a connection between habitat
288
and species losses (Wilcox & Murphy, 1985; Brooks et al., 2002), the number of endangered species raised 289
from 2 (2.86%) to 78 (74.29% of total) (Fig. 6) in our most conservative approach, where IUCN’s B category is
290
not considered and we account for uncertainty in population responses to fragmentation depending upon habitat
291
type. Such relation was already expected, because Squamate Reptiles are highly sensible to area loss (Gibbons
292
et al., 2000; Collen et al., 2009; Bohm et al., 2013), Reptiles have been pointed out as more vulnerable to 293
In our reassessment we classified some species in higher risk categories in GOV than in BAU scenarios
295
(Appendix S1). This is a consequence of the different metrics and assumptions when building GOV and BAU
296
scenarios. The BAU scenario estimates a maintainance in previous patterns of habitat loss (2002-2008), while in
297
the GOV scenario registered habitat loss is projected to be halved, irrespectively of what is happening nearby
298
the region. For example, an area isolated from roads and cities with 10000 ha may be expected to lose 1200 ha
299
in the next ten years in the BAU scenario, however if the region held a previous loss of 3000 ha, a future loss of
300
1500 ha will be predicted under the GOV scenario (50% of reduction), therefore surpassing the loss expected
301
under BAU.
302
Sadly, the raise in species uplisting to threatened categories when extending deforesting to a wider time
303
frame (20 years), indicates that the longer is a species generation length, theoretically the higher its extinction
304
risk in the Cerrado (Fig. 2). Ten years ago the Cerrado has been projected disappear in 2030 if no proper actions
305
are taken (Machado et al., 2004), and our data still point in the same catastrophic direction (Table 1). As this 306
relation between species projected distributions and habitat losses was evident under both Watershed or Maxent
307
mapping procedures, with no significant difference between total area lost, we conclude that as proposed by
308
Nogueira et al. (2011), this uplisting is not a consequence of the chosen model or mapping technique, but rather 309
the result of spatial coincidence of local richness, endemism and high levels of habitat loss.Such coincidence is
310
clearly perceptible when we take in account that most reaclassified threatened species, including all CR, are
311
concentrated in the southern part of the Cerrado. A consequence of the high richness in endemics with narrow
312
modeled distributions in the Parana-Paraguay headwaters (Fig. 3), coupled with a high regional habitat loss,
313
projected to continue in the future(Fig. 1).
314
Differences in future habitat loss within higher taxa depending on where each species’ distribution was
315
located, and the significantly diverging registered habitat losses among Tocantins-Serra Geral and
Paraguay-316
Guaporé BEs from the Paraná-Paraguay BE (Fig. 4, Table 2) indicates that: the latter BE, located in the
317
Southern region of the Cerrado, was and possibily will continue to be more heavily affected by deforestation
318
(only 34% of BE 3 original coverage remains);and the Northern and North-Western parts of the ecoregion suffer
319
less with this particular menace (81% of BE 1 original area still remains).
320
We chose species within BE for verifying loss patterns in the Cerrado so we could observe the effects
321
of deforestation in biogeographical patterns (Carvalho et al., 2011). The most emperilled detected BE has also 322
the least protection by conservation units, while the least emperilled BE has the highest protection among all