Evolution and patterns of global health financing 1995–2014:
development assistance for health, and government, prepaid
private, and out-of-pocket health spending in 184 countries
Global Burden of Disease Health Financing Collaborator Network*
Summary
Background An adequate amount of prepaid resources for health is important to ensure access to health services and for the pursuit of universal health coverage. Previous studies on global health financing have described the relationship between economic development and health financing. In this study, we further explore global health financing trends and examine how the sources of funds used, types of services purchased, and development assistance for health disbursed change with economic development. We also identify countries that deviate from the trends.
Methods We estimated national health spending by type of care and by source, including development assistance for health, based on a diverse set of data including programme reports, budget data, national estimates, and 964 National Health Accounts. These data represent health spending for 184 countries from 1995 through 2014. We converted these data into a common inflation-adjusted and purchasing power-adjusted currency, and used non-linear regression methods to model the relationship between health financing, time, and economic development.
Findings Between 1995 and 2014, economic development was positively associated with total health spending and a shift away from a reliance on development assistance and out-of-pocket (OOP) towards government spending. The largest absolute increase in spending was in high-income countries, which increased to purchasing power-adjusted $5221 per capita based on an annual growth rate of 3·0%. The largest health spending growth rates were in upper-middle-income (5·9) and lower-middle-income groups (5·0), which both increased spending at more than 5% per year, and spent $914 and $267 per capita in 2014, respectively. Spending in low-income countries grew nearly as fast, at 4·6%, and health spending increased from $51 to $120 per capita. In 2014, 59·2% of all health spending was financed by the government, although in low-income and lower-middle-income countries, 29·1% and 58·0% of spending was OOP spending and 35·7% and 3·0% of spending was development assistance. Recent growth in development assistance for health has been tepid; between 2010 and 2016, it grew annually at 1·8%, and reached US$37·6 billion in 2016. Nonetheless, there is a great deal of variation revolving around these averages. 29 countries spend at least 50% more than expected per capita, based on their level of economic development alone, whereas 11 countries spend less than 50% their expected amount.
Interpretation Health spending remains disparate, with low-income and lower-middle-income countries increasing spending in absolute terms the least, and relying heavily on OOP spending and development assistance. Moreover, tremendous variation shows that neither time nor economic development guarantee adequate prepaid health resources, which are vital for the pursuit of universal health coverage.
Funding The Bill & Melinda Gates Foundation.
Copyright © The Author(s). Published by Elsevier Ltd. This is an Open Access article under the CC BY 4.0 license.
Introduction
Substantial disparities characterise the amount of resources spent on health globally.1 In many
low-income countries, per capita spending remains less than $100 per year, and inadequate resources prevent people from accessing quality health care. By contrast, in many high-income countries, annual health spending has ballooned to higher than $5000 per capita. These divergent contexts are reflected in the thrust of public policy, with calls to rein in health spending growth in high-income countries, and appeals to mobilise more resources for health in low-income and middle-income countries.2–8
Notwithstanding these disparities, certain trends underpin health spending worldwide.9–11 The health
financing transition is defined by changes in the level and composition of health spending. These changes are associated with economic development. More specifically, the health financing transition has two key features, observed across countries and across time: (1) as countries experience economic development, they spend more per capita on health; and (2) less of that spending is out-of-pocket (OOP).12–14 It has been theorised that both features
of the health financing transition are driven by per capita income growth, technological advances, maturation of health financing system, greater government fiscal
Lancet 2017; 389: 1981–2004
Published Online
April 19, 2017 http://dx.doi.org/10.1016/ S0140-6736(17)30874-7 This online publication has been corrected. The corrected version first appeared at thelancet.com on May 18, 2017
SeeComment page 1955 *Collaborators listed at the end of the Article
Correspondence to: Dr Joseph L Dieleman, 2301 Fifth Avenue, Suite 600, Seattle, WA 98121, USA [email protected]
capacity, introduction of social health insurance, and population ageing, all associated with socioeconomic development. The first feature—increasing spending on health per capita—is important because it leads to more resources for health, which can lead to improved access to higher quality health services. The second feature—the declining share of health spending that is OOP—is important because high OOP payments can deter use of health-care services, which can lead to poor health outcomes and medical impoverishment.15–21
Changes in a country’s reliance on development assistance for health is also related to economic development. Development assistance for health tends to be phased out as countries develop economically, especially when measured as a share of total health spending. Eligibility criteria set by donors, such as the Global Fund
for AIDS, Tuberculosis, and Malaria (the Global Fund), the World Bank’s International Development Association, and Gavi, the Vaccine Alliance (Gavi), are linked to gross national income thresholds.22 At a certain level of economic
development, countries become ineligible to receive development assistance for health.
To explore the global health financing landscape and the patterns described by the health financing transition framework, this study examines spending on health in 184 countries over a 20-year period, 1995 to 2014. These data capture the distinct health spending trends of low-income, middle-low-income, and high-income countries. We track total health spending and health spending disaggregated by the source of the funds—spending originating from governments, development partners, OOP, and prepaid private pools, such as private insurance.
Research in context
Evidence before this study
Understanding how national health spending in total, and disaggregated into government, prepaid private, out-of-pocket (OOP), and development assistance for health, is associated with economic development is important for assessing progress and determining fiscally appropriate financing targets. Deviation from these trends can be used to identify opportunities for increased focus and attention from development partners and domestic governments. Adequate health financing that is prepaid, rather than OOP, is crucial for the pursuit of universal health coverage.
Several studies have tracked national health spending patterns over time. Typically, these studies are descriptive (cross-sectional and time series) and focus on trends in growth in health spending and its determinants. A key piece of research on this topic was completed by Fan and Savedoff. They explored spending in 126 countries spanning 15 years and identified key patterns in how growth in health spending evolves over time, especially in relation to per capita income. They used the term ‘‘health financing transition’’ to characterise two observed patterns: as income rises, (1) health spending per capita tends to rise, and (2) the share of health payments that are OOP tends to decrease.
Added value of this study
This research expands what is known about the health financing transition and the availability of prepaid health resources in three distinct ways. First, this research provides a more comprehensive perspective on the health financing patterns associated with economic development. Previously our research on this topic has focused on development assistance for health. In this research we combine these data with domestic spending estimates to generate a panel of data spanning 20 years and 184 countries. Along with development assistance for health, this research measures government health spending that is domestically generated, prepaid private health spending, and out-of-pocket health spending. Second, we use non-linear methods to assess important non-linear variation across time and levels of economic development.
These trends allow us to explore how health spending from development partners fit with the health financing transition framework. This addition is crucial to explore the effect that the transition away from a reliance on development assistance for health has on health-system financing. Relative to previous research, this work extends the analysis to use more comprehensive data that focuses on the source of the health spending, uses robust non-linear estimation methods, and highlights both trends and deviations from those trends for 184 countries. Third, we explore how the types of health-related goods and services purchased by each country evolve with economic development.
Implications of all the available evidence
The findings from this study expand the understanding of the health financing transition. We measure health financing trends associated with economic development: health spending increases exponentially, while the share of total health spending that is OOP declines, especially at the highest income levels. The share of financing from development assistance for health, on average, declines before government spending becomes the dominant funding source, leaving a period in the transition where countries often rely heavily on both OOP and government spending. The share of spending on each type of goods and service is relatively stable across the development spectrum with substantive emergence of long-term care spending at the highest income levels. Despite the health financing trends associated with economic development, tremendous variation exists and suggests that neither time nor economic development guarantee adequate prepaid health resources will be available. Deviations from the health spending trends can identify health financing opportunities.
To highlight changes in the mix of goods and services purchased, health spending has also been disaggregated by type of goods and services purchased, such as inpatient, outpatient, and pharmaceutical spending. Our analyses focus on patterns associated with economic development and, importantly, highlight deviations from observed trends. We also assess how development assistance for health is disbursed globally and discuss how development assistance for health is a part of and affects the health financing transition. These data span from 1990 to 2016, and highlight the sources and development agencies that provide development assistance for health. Primary health focus areas and recipient regions targeted by the development assistance is also tracked to show who is receiving development assistance for health and what focus areas are being prioritised.
Methods
Total health spending and government, prepaid private, and out-of-pocket health spending
Health spending stems from four sources: the government, which includes general government budgets and social health insurance; prepaid private spending, which includes private insurance and non-governmental organisation spending; OOP payments; and development assistance for health. The sum of these sources make up total health-care spending. Government, prepaid private, and OOP spending data were extracted from the WHO Global Health Observatory.These data measure the sum of all outlays for health maintenance, restoration, or enhancement paid for in cash or supplied in kind.23 This excludes indirect health
spending, such as lost wages due to illness or transportation costs; spending on informal care, such as care provided by a family member; spending on traditional healers; and illegal so-called black market or under the table transactions, such as bribes. Spending estimates were extracted in national currency units and divided by gross domestic product (GDP), also reported in national currency units and reported by WHO. This fraction was multiplied by GDP per capita reported in inflation-adjusted 2015 PPP $.24
WHO data tracks spending by agent, such that it is unclear if government and prepaid private spending were sourced domestically. To differentiate between domestically and internationally financed spending, development assistance for health provided to the government was removed from WHO’s government spending estimates and development assistance for health provided to non-government providers or organisations was removed from WHO’s prepaid private estimates.25
For the 184 countries, between 1995 and 2014, 1·7%, 14·8%, and 1·7% of the government, prepaid private, and OOP health spending estimates were missing, respectively. These estimates were imputed in R using Amelia II: A program for missing data (version 1.7.4), and more information about these methods is provided in the appendix (p 19).26 The result of this approach is four
mutually exclusive, collectively exhaustive spending
estimates by source and time—government as source, prepaid private (excluding donor financing), OOP health spending, and development assistance for health. These four series were summed to form annual estimates of total health spending for each of the 184 countries, from 1995 through 2014.
Development assistance for health
Development assistance for health is the financial and in-kind resources transferred from development agencies to low-income and middle-low-income countries with the primary purpose of maintaining or improving health.27 Many of the
methods used to estimate development assistance for health have been used and published previously, although the input data and some methods have been updated and improved for this study.25,27,28 These estimates are based on data from all
publicly available databases tracking development assistance, including project-level records from the Organisation for Economic Co-operation and Development (OECD) and other development agencies, such as the World Bank, the Global Fund, Gavi, and the Bill & Melinda Gates Foundation. In addition, audited budget statements and annual reports are used to estimate development assistance for health through 2016. When disbursement data were not available, commitment data are adjusted to reflect disbursements. Disbursements are tracked comprehensively from source to disbursing agency, also known as the disbursing channel, to recipient to avoid double counting associated with development agencies transferring resources among themselves. These data are disaggregated based on the source of development assistance for health, disbursing channel, health focus area, and country recipient. Development assistance for health is disaggregated by health focus area— newborn and child health, maternal health, HIV/AIDS, malaria, tuberculosis, non-communicable diseases, other infectious diseases, health system strengthening, which includes discretionary grants to the health sector, and other and unallocable—and tracks disbursements from 1990 to 2016. Other includes projects that are for health projects that do not fit into any of the other health focus areas, while unallocable development assistance for health is that that does not have sufficient data to be disaggregated by health focus area. A more thorough presentation of these methods and explanation on how these methods defer from past research is provided in the appendix (p 41).
The Institute for Health Metrics and Evaluation’s (IHME) development assistance for health database further disaggregates funds based on whether they are expected to be channelled to the recipient country’s government, or are provided to non-governmental providers or organisations.29 Development assistance for
health estimates are reported in 2015 US$, and were converted into 2015 purchasing-power-adjusted US$ to reflect the purchasing power of development assistance for health in the recipient country. Purchasing power parity exchange rates were based on data from the International Monetary Fund (IMF), World Bank, and WHO.
See Online for appendix For WHO Global Health Observatory see http://www. who.int/gho/en/
Health spending by types of goods and services
Total health spending was also disaggregated by type of goods and services, such as inpatient or outpatient care. For this purpose, we collected all available National Health Account (NHA) reports. NHAs track health spending using an agreed upon accounting framework developed by the OECD, WHO, and Eurostat. The standards were first codified in 2001, but then updated in 2011 to what is now known as the System of Health Accounts (SHA) 2011.30,31 A systematic review located,
extracted, and published data from 872 reports spanning 1996 to 2010.32 We added to this review by
searching WHO, OECD, and Eurostat databases, and Google for search terms “National Health Account” and “System of Health Account”, which identified 178 additional NHAs. The newly collected reports are primarily from more recent years.
We mapped estimates based on NHA 2001 standards to SHA 2011 with methods described in the appendix (p 20). Because the NHA 2001 and SHA 2011 standards for tracking spending on some preventive health services were irreconcilable, we include only the spending on immunisations and early disease detection. Excluded categories contain spending on education and counselling programmes, epidemiological surveillance, and disaster preparedness.
Of the 1050 NHA reports identified for this research, only 964 NHA reports included the necessary data (specific information about the exclusion criterion used to determine the set of used NHAs outlined in the appendix [p 20]). These 964 reports span 108 countries and range from 1995 to 2014. From these, we extracted total and government health spending by type of goods and services, and aggregated spending into eight categories: inpatient curative and rehabilitative care; day and outpatient curative and rehabilitative care; long-term care; ancillary services; medical goods, which includes pharmaceuticals; governance and health-system and financing administration; immunisation and early disease detection programmes; and other care. Estimates by type of service were generated as a share of both total health spending and total government health spending. Other care is a residual category that includes all health spending not included in the other categories.
Gross domestic product data
GDP data spanning 1995 to 2015 were based on data collected from the International Monetary Fund, World Bank, the UN, the Maddison Project, and Penn World Tables database.33–36 These data were combined using
regression methods and previously developed for producing a complete GDP time series.24 GDP data were
reported in inflation-adjusted 2015 PPP $.
Spending by income groups and geographic regions We report estimates aggregated by FY2016 World Bank income groups and Global Burden of Disease (GBD)
super regions.37,38 World Bank income groups are four
mutually exclusive categories assigned by the World Bank and based on gross national income. GBD super regions are seven mutually exclusive categories based on geography and cause of death patterns. Spending estimates were constructed to reflect the group or region as a whole. For example, the group’s health spending per capita is the group’s total spending divided by total population. Similarly, the group’s government health spending as a share of total spending was the group’s total government spending divided by the group’s total health spending.
Statistical analyses
We completed three primary analyses. For all three analyses, we used multivariate penalised spline regression to allow for flexible and non-linear model fit across all 184 countries and 20 years of data.39 First, we regressed the natural log of
total health spending per capita on the natural log of GDP per capita and time. Second, we regressed four health spending by source fractions—development assistance for health and government, prepaid private, and OOP health spending—on GDP per capita and time. Third, we regressed the eight health spending by type of goods and services fractions—inpatient curative and rehabilitative care, day and outpatient curative and rehabilitative care, long-term care, ancillary services, medical goods, governance and health-system and financing admin-istration, immunisation and early disease detection programmes, and other care—on GDP per capita and time. For the second and third analyses, the spending fractions (by source and by type) were each measured as a share of total health spending and centre log-ratio transformed, while GDP per capita was natural log transformed.40 To
estimate uncertainty, the underlying data was bootstrapped 1000 times, and all regressions were completed independently on each of the 1000 bootstrap samples.41,42
Robustness checks included in the appendix (p 29) reinforce our qualitative conclusions, and use subsets of our data and also rely on the Socio-demographic Index and the Human Development Index, both of which track additional dimensions related to socioeconomic development, rather than simply GDP per capita which tracks economic development.
To measure countries’ 2014 health spending relative to the expected value as determined by the fitted trend, we extracted the estimated country-year and year-specific residual (or error) from the regression analyses. The residuals measure the difference between the actual 2014 spending levels and the expected 2014 spending levels predicted by the model relative only to the country’s GDP per capita. The residual measures the effect of country characteristics not included in the model, such as health burden, health-system policies, prices, and society’s willingness to spend on health.
development. To test these we used ordinary least squares to regress the natural log of health spending per capita on the natural log of GDP per capita. More details on all estimation are included in the appendix (p 4).
Role of the funding source
The funder of this study had no role in the study design, data collection, data analysis, data interpretation, or writing of the report. All authors had full access to the data in the study and JLD and CJLM
Total health spending per capita ($)
Total health expenditure per GDP (%)
Domestic government health spending per total health spending (%)
Prepaid private spending per total health spending (%)
Out-of-pocket spending per total health spending (%)
Development assistance for health per total health spending (%)
Annualised rate of change in total health spending per capita, 1995–2014 (%) Global
Total 1279 (33 to 9237) 8·3% (1·9 to 39·3) 59·2% (0·0 to 95·5) 17·4% (0·0 to 64·8) 22·8% (2·4 to 76·6) 0·6% (0·0 to 92·3) 3·3% (–3·0 to 19·7)
Income group
High income 5221 (853 to 9237) 11·7% (2·2 to 16·6) 63·4% (42·4 to 93·9) 22·7% (0·0 to 38·8) 13·9% (2·4 to 55·7) 0·0% (0·0 to 0·1) 3·0% (–1·1 to 7·6) Upper-middle income 914 (228 to 1980) 5·9% (2·3 to 17·2) 57·2% (19·4 to 95·5) 8·7% (0·0 to 44·2) 33·8% (4·4 to 74·2) 0·3% (0·0 to 23·2) 5·9% (–3·0 to 17·0) Lower-middle income 267 (92 to 791) 4·3% (1·9 to 16·1) 35·9% (0·0 to 87·2) 3·1% (0·0 to 10·2) 58·0% (2·8 to 76·6) 3·0% (0·2 to 92·3) 5·0% (–1·4 to 9·4) Low income 120 (33 to 347) 7·3% (3·6 to 39·3) 18·0% (0·0 to 48·5) 17·2% (0·0 to 64·8) 29·1% (7·8 to 54·1) 35·7% (12·9 to 92·2) 4·6% (–3·0 to 19·7)
GBD super region
Central Europe, eastern Europe, and central Asia
1364 (200 to 2845) 6·7% (2·3 to 10·3) 58·5% (19·4 to 84·8) 2·8% (0·0 to 18·9) 38·5% (11·2 to 74·2) 0·3% (0·0 to 13·7) 4·9% (1·4–9·6)
Global Burden of Disease high income
5460 (1322 to 9237) 12·3% (2·6 to 16·6) 62·8 %(42·4 to 93·9) 23·4% (0·0 to 38·8) 13·8% (5·3 to 55·7) 0·0% (0·0 to 0·0) 2·9% (–0·6to7·6) Latin America
and Caribbean
1082 (154 to 1996) 7·3% (4·3 to 11·1) 51·6% (0·0 to 95·5) 16·1% (0·0 to 29·6) 31·7% (4·4 to 64·3) 0·7% (0·0 to 40·8) 3·3% (–1·8 to 8·5)
North Africa and Middle East
870 (159 to 2663) 5·2% (2·2 to 9·7) 60·1% (14·3 to 91·8) 4·3% (0·0 to 14·9) 34·9% (5·9 to 76·6) 0·7% (0·0 to 30·9) 4·9% (–1·4 to 9·0)
South Asia 223 (92 to 279) 4·2% (2·7 to 5·8) 31·0% (22·7 to 70·7) 2·6% (0·0 to 6·1) 64·7% (25·1 to 65·6) 1·7% (0·7 to 17·8) 5·8% (2·0 to 6·4) Southeast Asia,
east Asia, and Oceania
588 (105 to 1980) 4·8% (1·9 to 17·2) 58·6% (0·0 to 93·6) 5·2% (0·0 to 10·2) 35·7% (2·4 to 65·4) 0·5% (0·0 to 92·3) 8·9% (–3·0 to 11·0)
Sub-Saharan Africa 218 (33 to 1411) 5·9% (3·0 to 39·3) 33·5% (0·0 to 80·7) 20·8% (0·0 to 64·8) 29·2% (5·1 to 70·1) 16·6% (0·1 to 92·2) 3·2% (–3·0 to 19·7)
Country
Afghanistan 159 9·7% 15·0% 0·0% 54·1% 30·9% 5·5%
Albania 642 5·9% 48·3% 0·0% 49·8% 1·9% 4·2%
Algeria 1004 7·2% 72·7% 0·7% 26·5% 0·0% 6·0%
Andorra 5723 8·1% 78·0% 6·0% 15·9% 0·0% 2·5%
Angola 228 3·0% 70·0% 0·0% 26·6% 3·4% 1·5%%
Antigua and Barbuda 1213 5·5% 68·3% 8·0% 23·7% 0·0% 3·0%
Argentina 1322 4·8% 55·8% 13·2% 30·9% 0·0% –0·6%
Armenia 395 4·5% 40·6% 3·0% 52·8% 3·6% 4·9%
Australia 4032 9·0% 70·4% 9·9% 19·7% 0·0% 3·3%
Austria 5471 11·2% 78·0% 5·8% 16·2% 0·0% 2·6%
Azerbaijan 1030 5·9% 20·9% 4·3% 74·2% 0·6% 9·6%
Bahrain 2258 4·8% 65·3% 10·6% 24·1% 0·0% 2·2%
Bangladesh 92 2·9% 22·7% 0·0% 65·6% 11·7% 3·2%
Barbados 1116 7·5% 63·5% 6·6% 29·9% 0·0% 2·0%
Belarus 1093 5·6% 66·9% 0·1% 32·6% 0·4% 4·0%
Belgium 4751 10·6% 77·9% 4·3% 17·8% 0·0% 3·3%
Belize 503 5·8% 64·7% 9·5% 23·0% 2·9% 2·8%
Benin 105 5·1% 35·0% 0·0% 35·5% 29·6% 2·0%
Bhutan 279 3·6% 70·7% 0·0% 25·1% 4·2% 4·0%
Bolivia 404 6·3% 70·2% 3·4% 23·1% 3·3% 5·2%
Bosnia and Herzegovina
992 9·5% 70·0% 0·0% 28·0% 2·0% 8·8%
Botswana 903 5·5% 49·9% 35·0% 5·1% 10·0% 5·1%
Brazil 1357 8·3% 45·9% 28·5% 25·5% 0·1% 3·3%
Total health spending per capita ($)
Total health expenditure per gross domestic product (%)
Domestic government health spending per total health spending (%)
Prepaid private spending per total health spending (%)
Out-of-pocket spending per total health spending (%)
Development assistance for health per total health spending (%)
Annualised rate of change in total health spending per capita, 1995–2014 (%)
(Continued from the previous page)
Brunei 1811 2·6% 93·9% 0·1% 6·0% 0·0% –0·4%
Bulgaria 1490 8·4% 54·7% 0·9% 44·3% 0·2% 6·3%
Burkina Faso 83 5·0% 35·8% 0·0% 38·6% 25·6% 2·8%
Burundi 65 8·3% 23·7% 0·0% 19·1% 57·2% 3·2%
Cambodia 209 6·4% 14·2% 0·0% 65·4% 20·4% 4·1%
Cameroon 116 4·0% 17·0% 3·5% 68·5% 10·9% 1·3%
Canada 4576 10·3% 72·1% 14·1% 13·8% 0·0% 2·4%
Cape Verde 318 4·8% 58·4% 0·1% 22·2% 19·2% 4·1%
Central African Republic
35 5·7% 9·0% 0·0% 34·2% 56·7% –1·3%
Chad 89 3·8% 48·5% 1·3% 37·2% 12·9% 0·6%
Chile 1780 7·8% 49·5% 19·0% 31·5% 0·0% 4·1%
China 697 5·1% 60·3% 5·0% 34·6% 0·0% 10·4%
Colombia 975 7·2% 71·9% 9·5% 15·3% 3·2% 2·7%
Comoros 111 7·1% 22·1% 20·1% 42·8% 14·9% –1·2%
Costa Rica 1418 9·3% 73·1% 1·8% 25·0% 0·0% 4·6%
Côte d’Ivoire 179 5·3% 22·1% 8·2% 54·6% 15·1% 0·2%
Croatia 1734 7·8% 81·9% 6·9% 11·2% 0·0% 3·5%
Cuba 1706 11·1% 95·5% 0·0% 4·4% 0·2% 8·5%
Cyprus 2019 7·2% 46·0% 4·4% 49·6% 0·0% 3·0%
Czech Republic 2384 7·4% 84·8% 0·8% 14·4% 0·0% 2·8%
DR Congo 46 4·5% 21·3% 0·0% 37·4% 41·3% 2·9%
Denmark 5075 10·8% 84·8% 1·9% 13·4% 0·0% 2·8%
Djibouti 357 10·9% 58·3% 0·0% 34·6% 7·1% 5·3%
Dominica 599 5·5% 68·7% 3·0% 28·3% 0·0% 1·1%
Dominican Republic 601 4·4% 63·4% 11·4% 21·0% 4·2% 3·0%
Ecuador 1071 9·2% 48·8% 2·2% 48·5% 0·5% 8·0%
Egypt 581 5·4% 39·9% 1·5% 58·3% 0·2% 5·5%
El Salvador 567 6·8% 64·7% 4·9% 28·8% 1·6% 3·3%
Equatorial Guinea 1411 3·7% 79·2% 0·0% 20·7% 0·1% 17·0%
Eritrea 59 5·1% 23·4% 0·0% 35·2% 41·4% –1·1%
Estonia 1830 6·4% 79·0% 0·3% 20·8% 0·0% 5·1%
Ethiopia 85 5·5% 26·9% 0·0% 28·4% 44·7% 7·6%
Federated States of Micronesia
490 16·1% 0·0% 0·0% 7·7% 92·3% 2·9%
Fiji 399 4·5% 63·8% 7·5% 23·0% 5·7% 3·3%
Finland 3935 9·3% 78·0% 3·1% 18·9% 0·0% 3·1%
France 4589 11·3% 79·9% 13·6% 6·5% 0·0% 2·0%
Gabon 612 3·4% 67·4% 8·8% 22·0% 1·8% 0·0%
Georgia 700 7·3% 19·4% 18·9% 59·1% 2·6% 9·3%
Germany 5356 11·2% 77·3% 9·4% 13·3% 0·0% 2·6%
Ghana 146 3·5% 52·8% 3·1% 27·1% 17·0% 4·3%
Greece 2170 8·1% 61·7% 3·4% 34·9% 0·0% 0·9%
Grenada 737 6·1% 46·6% 2·0% 51·2% 0·2% 2·0%
Guatemala 466 6·2% 36·9% 8·2% 52·1% 2·8% 3·9%
Guinea 101 7·4% 20·4% 0·0% 34·5% 45·1% 3·5%
Guinea-Bissau 77 5·3% 6·0% 0·0% 52·1% 41·9% –3·0%
Guyana 438 5·4% 53·5% 2·9% 36·5% 7·1% 3·2%
Haiti 154 8·9% 0·0% 29·6% 29·6% 40·8% –1·8%
Total health spending per capita ($)
Total health expenditure per gross domestic product (%)
Domestic government health spending per total health spending (%)
Prepaid private spending per total health spending (%)
Out-of-pocket spending per total health spending (%)
Development assistance for health per total health spending (%)
Annualised rate of change in total health spending per capita, 1995–2014 (%)
(Continued from the previous page)
Honduras 420 8·8% 47·2% 5·0% 43·3% 4·6% 4·4%
Hungary 1855 7·2% 68·1% 4·4% 27·5% 0·0% 2·5%
Iceland 3959 8·7% 82·3% 0·0% 17·7% 0·0% 2·3%
India 253 4·5% 31·3% 2·4% 65·6% 0·7% 6·4%
Indonesia 265 2·5% 42·7% 2·7% 53·5% 1·1% 5·2%
Iran 1073 6·5% 43·8% 5·3% 50·8% 0·0% 6·2%
Iraq 828 5·7% 58·2% 3·0% 38·4% 0·5% 7·5%
Ireland 4006 7·6% 67·6% 14·3% 18·1% 0·0% 4·6%
Israel 2722 7·7% 61·5% 11·2% 27·3% 0·0% 1·9%
Italy 3311 9·0% 77·4% 0·9% 21·7% 0·0% 1·8%
Jamaica 477 5·4% 50·5% 19·4% 27·8% 2·3% 1·7%
Japan 3816 10·2% 83·6% 2·4% 13·9% 0·0% 3·0%
Jordan 839 7·4% 66·8% 8·0% 21·1% 4·1% 2·7%
Kazakhstan 1143 4·3% 54·4% 0·0% 45·3% 0·3% 5·8%
Kenya 197 6·4% 37·8% 3·8% 23·4% 35·0% 3·4%
Kiribati 168 9·6% 79·3% 0·0% 2·8% 17·9% 0·3%
Kuwait 2075 3·0% 85·9% 1·3% 12·7% 0·0% –1·1%
Kyrgyzstan 236 6·9% 47·7% 1·3% 37·3% 13·7% 3·1%
Laos 113 2·0% 28·3% 0·4% 36·6% 34·7% 1·8%
Latvia 1427 5·9% 63·2% 1·7% 35·1% 0·0% 5·5%
Lebanon 1060 6·4% 47·6% 14·9% 36·4% 1·1% –1·2%
Lesotho 319 11·6% 63·4% 0·3% 15·0% 21·3% 6·1%
Liberia 345 39·3% 0·0% 0·0% 7·8% 92·2% 19·7%
Libya 751 5·0% 73·5% 0·0% 26·5% 0·0% 0·0%
Lithuania 1830 6·5% 67·9% 0·8% 31·3% 0·0% 7·2%
Luxembourg 7105 6·9% 83·9% 5·5% 10·6% 0·0% 3·2%
Macedonia 887 6·5% 63·1% 0·0% 36·6% 0·3% 1·4%
Madagascar 52 3·7% 29·5% 0·0% 34·3% 36·2% –0·4%
Malawi 148 12·9% 33·5% 14·0% 9·3% 43·1% 5·5%
Malaysia 1047 4·1% 56·0% 8·1% 35·8% 0·0% 5·1%
Maldives 1980 13·5% 79·4% 2·0% 18·5% 0·0% 11·0%
Mali 162 7·4% 22·0% 10·9% 43·6% 23·5% 4·0%
Malta 3058 9·7% 69·2% 2·0% 28·9% 0·0% 5·5%
Marshall Islands 599 17·2% 62·9% 2·1% 11·8% 23·2% –3·0%
Mauritania 153 3·7% 44·5% 1·4% 44·7% 9·3% 0·7%
Mauritius 880 4·6% 50·8% 0·7% 48·0% 0·4% 4·8%
Mexico 1088 6·3% 51·7% 4·2% 44·0% 0·1% 2·9%
Moldova 527 10·3% 47·2% 8·2% 38·3% 6·3% 3·4%
Mongolia 575 4·7% 51·4% 0·9% 41·9% 5·8% 8·4%
Montenegro 1015 6·6% 55·3% 2·7% 41·4% 0·6% 3·4%
Morocco 505 5·9% 33·1% 7·6% 58·4% 0·9% 5·6%
Mozambique 92 7·8% 10·6% 0·6% 8·5% 80·2% 7·4%
Myanmar 121 2·5% 36·2% 0·0% 45·6% 18·2% 9·4%
Namibia 936 9·3% 53·5% 31·2% 6·9% 8·4% 5·2%
Nepal 138 5·8% 28·6% 5·9% 47·7% 17·8% 3·1%
Netherlands 5234 10·7% 88·4% 6·3% 5·3% 0·0% 3·9%
New Zealand 4050 11·0% 82·3% 6·6% 11·0% 0·0% 4·2%
Nicaragua 450 9·1% 50·9% 3·8% 37·3% 8·0% 3·6%
Total health spending per capita ($)
Total health expenditure per gross domestic product (%)
Domestic government health spending per total health spending (%)
Prepaid private spending per total health spending (%)
Out-of-pocket spending per total health spending (%)
Development assistance for health per total health spending (%)
Annualised rate of change in total health spending per capita, 1995–2014 (%)
(Continued from the previous page)
Niger 66 6·7% 26·3% 0·0% 49·5% 24·2% 0·6%
Nigeria 225 3·7% 22·1% 0·8% 70·1% 7·0% 7·5%
Norway 6537 10·0% 83·1% 3·7% 13·2% 0·0% 3·3%
Oman 1467 3·5% 91·8% 2·3% 5·9% 0·0% 1·6%
Pakistan 132 2·7% 32·1% 6·1% 55·4% 6·4% 2·0%
Panama 1743 8·0% 72·5% 4·5% 22·3% 0·8% 4·8%
Papua New Guinea 108 4·4% 60·1% 3·9% 10·1% 25·9% 3·5%
Paraguay 863 9·8% 45·6% 4·6% 49·3% 0·5% 4·7%
Peru 626 5·2% 63·3% 6·3% 30·0% 0·4% 4·4%
Philippines 330 4·7% 33·6% 10·2% 54·3% 1·9% 4·4%
Poland 1629 6·3% 71·4% 5·0% 23·6% 0·0% 5·0%
Portugal 2697 9·3% 66·6% 5·9% 27·6% 0·0% 3·3%
Qatar 2663 2·2% 85·7% 7·4% 6·9% 0·0% 0·7%
Congo (Brazzaville) 312 5·2% 80·7% 0·3% 17·4% 1·7% 4·5%
Romania 1077 5·5% 79·1% 0·4% 18·9% 1·6% 7·2%
Russia 1877 7·1% 51·8% 2·8% 45·5% 0·0% 5·4%
Rwanda 158 9·4% 0·0% 22·4% 22·6% 55·0% 7·9%
Saint Lucia 755 6·7% 49·2% 0·8% 45·6% 4·4% 1·4%
Saint Vincent and the Grenadines
917 8·8% 46·1% 2·0% 48·2% 3·6% 3·4%
Samoa 365 7·2% 87·2% 0·0% 5·9% 6·9% 4·5%
São Tomé and Príncipe
251 7·9% 31·1% 8·0% 11·9% 49·0% 1·9%
Saudi Arabia 2320 4·4% 78·7% 6·2% 15·1% 0·0% 5·0%
Senegal 121 5·2% 39·4% 0·0% 33·8% 26·9% 2·1%
Serbia 1392 10·3% 62·5% 0·3% 37·0% 0·1% 6·9%
Seychelles 853 3·3% 93·6% 4·0% 2·4% 0·1% –0·2%
Sierra Leone 255 13·5% 5·1% 9·2% 50·1% 35·6% 3·0%
Singapore 3981 4·8% 42·4% 1·9% 55·7% 0·0% 6·5%
Slovakia 2203 7·7% 76·3% 0·0% 23·7% 0·0% 5·1%
Slovenia 2845 9·1% 73·2% 14·5% 12·3% 0·0% 3·5%
Solomon Islands 107 5·8% 67·0% 0·0% 4·0% 29·1% 2·7%
Somalia 33 6·9% 25·0% 1·2% 28·5% 45·2% 1·9%
South Africa 1172 8·9% 47·0% 44·2% 6·4% 2·4% 2·1%
South Korea 2507 7·1% 56·0% 6·6% 37·4% 0·0% 7·6%
South Sudan 94 3·6% 21·0% 0·0% 40·7% 38·3% 1·8%
Spain 3096 9·0% 71·1% 4·8% 24·1% 0·0% 2·6%
Sri Lanka 402 3·5% 54·5% 1·0% 42·3% 2·1% 5·2%
Sudan 334 8·3% 20·4% 0·9% 76·6% 2·2% 9·0%
Suriname 731 4·3% 67·6% 15·5% 15·2% 1·7% 2·0%
Swaziland 745 9·5% 66·6% 8·4% 10·0% 15·0% 4·7%
Sweden 5446 11·8% 85·1% 0·6% 14·2% 0·0% 4·0%
Switzerland 7831 12·8% 60·3% 15·2% 24·5% 0·0% 3·2%
Syria 562 3·4% 44·5% 3·3% 51·6% 0·6% –1·4%
Tajikistan 200 7·3% 22·9% 8·7% 57·9% 10·6% 7·3%
Tanzania 166 6·4% 20·3% 17·1% 20·2% 42·4% 7·2%
Thailand 633 4·1% 78·7% 8·6% 12·1% 0·7% 3·7%
The Bahamas 1996 7·7% 45·9% 24·9% 29·2% 0·0% 1·2%
The Gambia 151 9·2% 47·4% 0·0% 13·6% 39·0% 5·8%
had final responsibility for the decision to submit for publication.
Results
Health spending in 2014
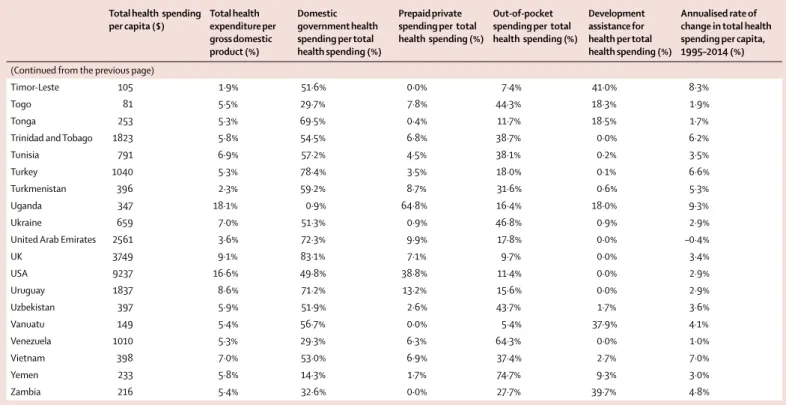
Table 1 shows that in 2014 health spending per capita across all countries was $1279. This spending was concentrated in high-income countries, and ranged from $33 in Somalia to $9237 in the USA. These extremes, which are reported using 2015 PPP $ to account for inflation and different prices across countries, highlight the tremendous variation in how much is spent on health around the world. Disparate spending levels also exist within World Bank income groups. In 2014, health spending across low-income countries was $120 per capita, but range from $33 (Somalia) to $347 (Uganda). Spending per capita across lower-middle-income countries was $267, but ranged from $92 (Bangladesh) to $791 (Tunisia), while spending per capita in upper-middle-income countries was $914, but ranged from $228 (Angola) to $1980 (Maldives). Finally, health spending per capita was $5221 in high-income countries, and ranged from $853 (Seychelles) to $9237 (USA). Geographic variation is also present when examined using GBD super regions.
Table 1 also highlights the sources of health financing in 2014. Globally, governments provided 59·2% of health
spending, while 17·4% of total health financing was prepaid private, 22·8% was OOP, and 0·6% was development assistance for health. In low-income countries, health spending was predominately financed by development assistance for health and OOP, constituting 35·7% and 29·1% of total health spending, respectively. However, the share of health financing sourced from OOP is largest in lower-middle-income countries, at 58·0%, where development assistance for health makes up a smaller share of total health spending than in low-income countries. Governments in upper-middle-income and high-income countries, by contrast, finance the bulk of health care and related activities, at 57·2% and 63·4%, respectively. Across all income groups, prepaid private health spending remained quite low. Within income groups, and also GBD super regions, the composition of sources financing the health system varied dramatically.
Health spending trends across time
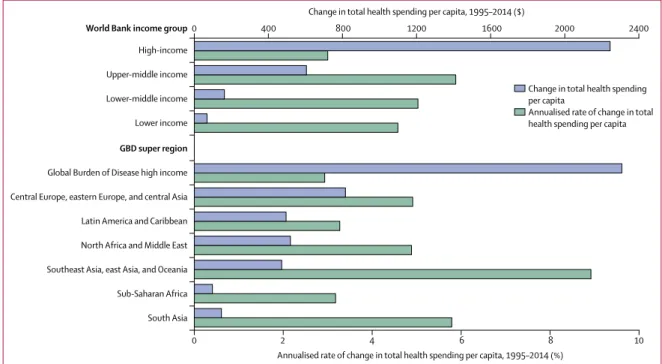
Figure 1 highlights how total health spending per capita has changed between 1995 and 2014. Upper-middle and lower-Upper-middle-income country groups have increased per capita health spending the fastest, with annualised growth rates of 5·9% and 5·0%, respectively. Over the course of 20 years, this has led to a near tripling of health spending per capita in upper-middle-income countries, from $309 to $914 per capita.
Total health spending per capita ($)
Total health expenditure per gross domestic product (%)
Domestic government health spending per total health spending (%)
Prepaid private spending per total health spending (%)
Out-of-pocket spending per total health spending (%)
Development assistance for health per total health spending (%)
Annualised rate of change in total health spending per capita, 1995–2014 (%)
(Continued from the previous page)
Timor-Leste 105 1·9% 51·6% 0·0% 7·4% 41·0% 8·3%
Togo 81 5·5% 29·7% 7·8% 44·3% 18·3% 1·9%
Tonga 253 5·3% 69·5% 0·4% 11·7% 18·5% 1·7%
Trinidad and Tobago 1823 5·8% 54·5% 6·8% 38·7% 0·0% 6·2%
Tunisia 791 6·9% 57·2% 4·5% 38·1% 0·2% 3·5%
Turkey 1040 5·3% 78·4% 3·5% 18·0% 0·1% 6·6%
Turkmenistan 396 2·3% 59·2% 8·7% 31·6% 0·6% 5·3%
Uganda 347 18·1% 0·9% 64·8% 16·4% 18·0% 9·3%
Ukraine 659 7·0% 51·3% 0·9% 46·8% 0·9% 2·9%
United Arab Emirates 2561 3·6% 72·3% 9·9% 17·8% 0·0% –0·4%
UK 3749 9·1% 83·1% 7·1% 9·7% 0·0% 3·4%
USA 9237 16·6% 49·8% 38·8% 11·4% 0·0% 2·9%
Uruguay 1837 8·6% 71·2% 13·2% 15·6% 0·0% 2·9%
Uzbekistan 397 5·9% 51·9% 2·6% 43·7% 1·7% 3·6%
Vanuatu 149 5·4% 56·7% 0·0% 5·4% 37·9% 4·1%
Venezuela 1010 5·3% 29·3% 6·3% 64·3% 0·0% 1·0%
Vietnam 398 7·0% 53·0% 6·9% 37·4% 2·7% 7·0%
Yemen 233 5·8% 14·3% 1·7% 74·7% 9·3% 3·0%
Zambia 216 5·4% 32·6% 0·0% 27·7% 39·7% 4·8%
Data in parenthesis are range within aggregate. Currency are 2015 purchasing power parity US$. GBD=Global Burden of Disease.
Spending in low-income countries grew at 4·6%, while the slowest growth was observed in high-income countries, which grew collectively at 3·0% per year. Despite this slower rate, the largest health spending increases in terms of dollar per capita increase was in high-income countries, which added $2244 per capita in spending. Upper-income and lower-income countries added $605 and $162 per capita respectively. Low-income countries, which spent very little in 1995, increased health spending by $69 per capita between 1995 and 2014. Liberia, Equatorial Guinea, and Maldives had the fastest per capita growth rates between 1995 and 2014 (table 1).
For high-income and middle-income countries, the growth in spending was driven by increases in government spending. For example, in high-income countries, 64·5% of the $2244 increase was due to increases in government spending. Conversely, the growth in low-income countries was driven by increases in development assistance for health (51·0% of absolute increase).
Although we observed increases in spending per capita between 1995 and 2014 in 170 of 184 countries, the multivariate penalised spline analysis shows that when controlling on GDP per capita, there was essentially no change in health spending across time at the median health spending per capita value (appendix p 36 illustrates this null finding).
Health spending trends and economic development Although time does not seem to be associated with health spending per capita, our trend analyses confirm the relationship between economic development and health
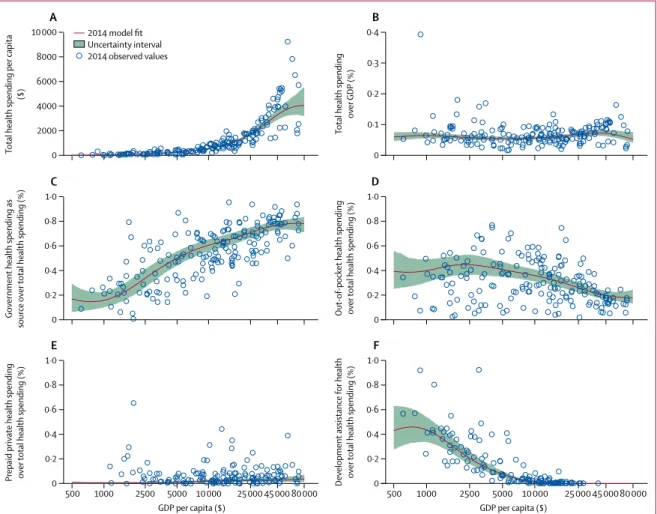
financing—total health spending increases with economic development, while the share of OOP financing decreases. These associations are represented in figure 2. Across countries, growth in GDP per capita was associated with exponential growth in total health spending per capita (figure 2A; appendix p 40; p<0·000).
Figure 2B shows that when measured as a share of GDP, there is not a robust relationship connecting economic development and spending. The estimated fit is nearly flat and there are countries with similar GDP per capita with disparate spending levels.
Figure 2C and 2D show that the share of health spending from the government increases with economic development, while the share that is OOP decreases. Prepaid private spending as a share of total spending is very small, on average, across all levels of economic development (figure 2E), while the share of health spending that is development assistance for health increases at the very lowest levels of GDP per capita and peaks at GDP per capita of $801 (figure 2F).
Figure 3 shows how the fraction of total health spending from governments, prepaid private, OOP, and development assistance for health evolve, on average, with economic development. On average, the proportion of total health spending sourced from governments rise as GDP per capita increases. At the 80th wealth percentile (GDP per capita of $27 617), trend analysis estimates that health spending is financed by the governments (72·2%), with only 24·9% sourced from OOP. At the 20th wealth percentile (GDP per capita of $2267), trend analysis estimates that OOP financing is 44·8% of total spending, while development assistance for health is 23·1%.
Sub-Saharan Africa
South Asia Southeast Asia, east Asia, and Oceania North Africa and Middle East Latin America and Caribbean Central Europe, eastern Europe, and central Asia Global Burden of Disease high income
GBD super region
Lower income Lower-middle income Upper-middle income High-income
World Bank income group
0 2 4 6 8 10
Annualised rate of change in total health spending per capita, 1995–2014 (%)
0 400 800 1200 1600 2000 2400
Change in total health spending per capita, 1995–2014 ($)
Change in total health spending per capita
Annualised rate of change in total health spending per capita
Figure 1: Changes in health spending by income group and Global Burden of Disease (GBD) super region, 1995–2014
Deviation from the health financing trends
Table 2 measures health spending relative to the modelled amount, which is based on country-specific and year-specific GDP per capita. The first column reports total health spending for 2014, which, as figure 2A shows, increases exponentially with GDP per capita. Countries such as Afghanistan, Brazil, France, Liberia, Uganda, and the USA spent more in 2014 than the modelled average, based on each country’s GDP per capita. On the other hand, countries such as Timor-Leste, Laos, and Turkmenistan spend 33·0%, 34·7%, and 35·6% of the expected amount.
Columns 2 to 5 of table 2 report the share of health spending financed by different sources relative to the expected amount. The results show that some countries deviate substantially from average trends. For government health spending, Rwanda, Liberia, and Federated States of Micronesia stand out as countries that finance a smaller share than expected relative to respective GDP per capita. On the other hand, Kiribati,
Solomon Islands, and The Gambia have governments that finance a greater share than expected. By contrast with the government health financing share, the OOP share of total health spending declines with economic
0 2000 4000 6000 8000 10 000
Total health spending per capita
($)
A
0 0·1 0·2 0·3 0·4
Total health spending
over
GDP (%)
B
0 0·2 0·4 0·6 0·8 1·0
0·2 0·4 0·6 0·8 1·0
Government health spending as
source
over
total health spending (%)
C
0
Out
-of-pocket health spendin
g
over
total health spending (%)
D
0 0·2 0·4 0·6 0·8 1·0
0·2 0·4 0·6 0·8 1·0
Prepaid private health spending over
total health spending (%)
E
0 Development assistance for health over
total health spending (%)
F
500 1000 2500 5000 10 000 25 000 45 000 80 000 GDP per capita ($)
500 1000 2500 5000 10 000 25 000 45 00080 000 GDP per capita ($)
2014 model fit Uncertainty interval 2014 observed values
Figure 2: Health spending by source (total health spending [A, B], government health spending [C]; out-of-pocket health spending [D]; prepaid private health spending [E], and development assistance for health [F]), 2014
Health spending relative to gross domestic product (GDP) per capita (reported in 2015 purchasing-power-parity [PPP] adjusted $). Although all countries and years of data were used for this analysis, the trend line reflects the 2014 model fit.
Government health spending Prepaid private spending Out-of-pocket spending Development assistance for health
0 20 40 60 80 100
Modelled proportion
of
total health
spending (%)
500 1000 2500 5000 10 000 25 000 50 000 120 000 Gross domestic product per capita (2015 PPP$)
Figure 3: Composition of health-care spending by source, 2014
Total health spending relative to modelled total health spending (%)
Share of total health spending that is from the government, relative to the modelled share (%)
Share of total health spending that is prepaid private, relative to the modelled share (%)
Share of total health spending that is out-of-pocket, relative to the modelled share (%)
Share of total health spending that is development assistance, relative to the modelled share (%)
Afghanistan 153·8% 64·0% 0·3% 123·7% 96·3%
Albania 99·5% 78·6% 0·6% 141·5% 170·3%
Algeria 118·0% 113·8% 30·3% 80·0% 8·8%
Andorra 141·7% 99·6% 167·6% 88·2% 0·0%
Angola 52·0% 122·2% 0·0% 70·3% 109·7%
Antigua and Barbuda 81·1% 98·7% 293·5% 84·8% 9·6%
Argentina 65·2% 77·2% 475·9% 124·3% 30·8%
Armenia 78·7% 69·0% 158·5% 142·9% 162·4%
Australia 121·3% 91·4% 333·2% 98·6% 0·0%
Austria 154·6% 100·6% 191·4% 83·2% 0·0%
Azerbaijan 91·3% 31·4% 164·4% 242·1% 263·9%
Bahrain 66·0% 84·5% 354·1% 121·9% 0·0%
Bangladesh 49·2% 56·7% 0·0% 149·9% 76·7%
Barbados 120·6% 98·2% 264·0% 92·2% 0·0%
Belarus 84·3% 98·7% 5·5% 111·0% 232·0%
Belgium 142·9% 101·2% 144·0% 88·9% 0·0%
Belize 100·1% 109·7% 498·3% 62·2% 131·1%
Benin 82·8% 120·8% 0·0% 79·3% 115·9%
Bhutan 62·9% 123·3% 0·0% 66·3% 137·8%
Bolivia 110·7% 128·8% 225·1% 59·0% 68·2%
Bosnia and Herzegovina 162·4% 114·9% 0·0% 78·6% 154·6%
Botswana 86·4% 75·9% 1352·6% 16·4% 3595·7%
Brazil 131·4% 70·0% 1104·9% 81·0% 33·1%
Brunei 45·0% 119·9% 2·8% 33·1% 0·0%
Bulgaria 130·6% 82·1% 33·2% 145·0% 72·0%
Burkina Faso 80·1% 152·7% 0·0% 88·2% 80·0%
Burundi 119·3% 161·9% 0·0% 49·3% 124·5%
Cambodia 109·2% 35·0% 0·0% 149·9% 137·0%
Cameroon 67·3% 45·1% 404·5% 155·1% 63·6%
Canada 138·7% 93·8% 475·0% 68·8% 0·0%
Cape Verde 83·0% 105·6% 9·4% 57·3% 446·0%
Central African Republic 77·4% 59·1% 0·0% 88·4% 125·3%
Chad 63·1% 151·3% 168·8% 83·1% 57·9%
Chile 111·6% 70·8% 693·3% 115·4% 3·3%
China 83·9% 94·7% 208·7% 103·9% 5·9%
Colombia 118·8% 113·1% 394·1% 46·0% 586·2%
Comoros 111·9% 99·1% 2797·1% 98·6% 44·5%
Congo 90·7% 150·8% 17·6% 44·0% 31·0%
Costa Rica 147·8% 112·5% 71·1% 78·0% 8·3%
Côte d’Ivoire 90·7% 53·6% 869·3% 125·5% 105·6%
Croatia 113·0% 117·9% 253·3% 40·5% 0·0%
Cuba 177·8% 146·9% 0·0% 13·7% 44·9%
Cyprus 98·4% 63·6% 157·4% 200·1% 0·0%
Czech Republic 98·4% 114·6% 28·1% 62·2% 0·0%
Congo (Brazzaville) 66·9% 134·1% 0·0% 93·5% 95·1%
Total health spending relative to modelled total health spending (%)
Share of total health spending that is from the government, relative to the modelled share (%)
Share of total health spending that is prepaid private, relative to the modelled share (%)
Share of total health spending that is out-of-pocket, relative to the modelled share (%)
Share of total health spending that is development assistance, relative to the modelled share (%)
(Continued from previous page)
Denmark 147·3% 109·7% 62·3% 67·9% 0·0%
Djibouti 186·7% 143·9% 0·0% 79·4% 47·5%
Dominica 92·9% 111·7% 135·8% 80·5% 3·5%
Dominican Republic 72·4% 99·4% 472·1% 63·1% 789·2%
Ecuador 153·4% 78·5% 96·8% 139·9% 59·0%
Egypt 91·0% 65·1% 68·6% 165·3% 20·8%
El Salvador 117·8% 110·7% 262·7% 77·3% 66·3%
Equatorial Guinea 48·7% 104·6% 0·0% 96·9% 480·8%
Eritrea 78·2% 136·8% 0·0% 86·0% 100·3%
Estonia 86·0% 108·6% 9·6% 85·0% 0·0%
Ethiopia 87·6% 122·7% 0·0% 65·6% 131·3%
Federated States of Micronesia
273·0% 0·0% 0·0% 17·5% 566·3%
Fiji 77·8% 107·8% 390·3% 62·4% 277·3%
Finland 124·2% 101·9% 105·6% 92·2% 0·0%
France 150·0% 104·9% 467·6% 31·1% 0·0%
Gabon 52·9% 101·1% 332·0% 72·4% 853·0%
Georgia 126·5% 32·3% 941·1% 162·8% 151·8%
Germany 154·4% 100·0% 311·0% 67·6% 0·0%
Ghana 61·0% 114·5% 286·3% 64·4% 159·6%
Greece 111·0% 85·8% 124·1% 138·0% 0·0%
Grenada 102·0% 74·5% 88·4% 148·8% 27·3%
Guatemala 108·6% 64·7% 477·2% 137·2% 85·3%
Guinea 115·4% 103·8% 0·0% 81·5% 120·9%
Guinea-Bissau 83·7% 29·2% 0·0% 121·8% 116·5%
Guyana 92·9% 92·0% 155·8% 97·7% 275·7%
Haiti 142·4% 0·0% 4032·0% 67·1% 133·3%
Honduras 153·3% 96·0% 413·0% 105·1% 54·1%
Hungary 99·8% 95·4% 159·5% 106·5% 0·0%
Iceland 118·2% 106·8% 0·0% 88·9% 0·0%
India 77·6% 59·5% 175·1% 164·5% 10·8%
Indonesia 42·5% 69·8% 124·6% 151·0% 93·9%
Iran 102·6% 66·6% 204·4% 162·2% 15·6%
Iraq 92·8% 90·4% 121·4% 117·3% 105·0%
Ireland 108·8% 86·9% 457·8% 94·9% 0·0%
Israel 101·9% 82·1% 393·6% 123·1% 0·0%
Italy 119·0% 102·7% 32·4% 99·7% 0·0%
Jamaica 92·9% 85·4% 1005·4% 75·5% 112·7%
Japan 134·4% 110·7% 84·7% 64·6% 0·0%
Jordan 124·4% 107·9% 358·9% 60·6% 422·4%
Kazakhstan 60·0% 75·9% 1·2% 177·3% 649·7%
Kenya 108·6% 96·8% 428·7% 53·2% 217·6%
Kiribati 154·9% 323·3% 0·0% 6·4% 58·3%
Kuwait 51·6% 109·7% 37·6% 70·3% 0·0%
Total health spending relative to modelled total health spending (%)
Share of total health spending that is from the government, relative to the modelled share (%)
Share of total health spending that is prepaid private, relative to the modelled share (%)
Share of total health spending that is out-of-pocket, relative to the modelled share (%)
Share of total health spending that is development assistance, relative to the modelled share (%)
(Continued from previous page)
Kyrgyzstan 117·6% 114·4% 139·3% 86·0% 98·0%
Laos 34·7% 53·7% 30·4% 91·8% 570·8%
Latvia 82·8% 89·5% 61·3% 132·4% 0·0%
Lebanon 100·1% 72·2% 574·1% 116·6% 422·6%
Lesotho 194·8% 175·0% 30·2% 33·8% 115·3%
Liberia 575·9% 0·0% 0·0% 20·0% 203·9%
Libya 80·2% 113·5% 0·2% 81·9% 8·3%
Lithuania 89·1% 93·8% 28·9% 126·3% 0·0%
Luxembourg 182·2% 108·5% 116·6% 59·1% 0·0%
Macedonia 106·8% 99·0% 0·0% 109·8% 63·2%
Madagascar 57·3% 146·3% 0·0% 80·4% 99·2%
Malawi 197·6% 197·2% 2043·1% 22·9% 104·1%
Malaysia 57·0% 78·6% 293·6% 138·4% 59·1%
Maldives 219·3% 123·2% 81·5% 56·8% 2·9%
Mali 121·0% 72·1% 1399·1% 97·2% 98·4%
Malta 130·7% 93·9% 70·4% 123·0% 0·0%
Marshall Islands 293·5% 149·1% 220·6% 27·2% 170·7%
Mauritania 64·0% 96·6% 128·7% 106·2% 87·6%
Mauritius 70·5% 75·4% 27·0% 161·6% 242·8%
Mexico 97·7% 77·9% 161·4% 142·9% 45·1%
Moldova 179·8% 93·3% 641·7% 94·2% 84·3%
Mongolia 78·7% 82·1% 37·5% 122·3% 752·2%
Montenegro 105·8% 85·0% 105·8% 129·1% 177·0%
Morocco 102·8% 56·4% 405·2% 157·4% 37·8%
Mozambique 119·0% 61·0% 93·7% 20·7% 196·6%
Myanmar 44·2% 73·7% 0·0% 110·7% 215·1%
Namibia 158·4% 88·2% 1495·1% 19·2% 600·0%
Nepal 95·9% 87·8% 732·5% 106·5% 81·7%
Netherlands 147·9% 114·1% 206·3% 27·3% 0·0%
New Zealand 145·5% 109·3% 231·1% 50·8% 0·0%
Nicaragua 157·9% 101·8% 306·9% 91·3% 101·0%
Niger 99·0% 168·1% 0·0% 124·4% 55·2%
Nigeria 65·6% 41·3% 53·1% 177·4% 127·5%
Norway 163·8% 106·1% 107·2% 72·6% 0·0%
Oman 46·3% 120·0% 76·9% 28·9% 0·0%
Pakistan 46·3% 64·2% 486·2% 135·6% 81·2%
Panama 116·5% 104·8% 163·9% 79·6% 758·5%
Papua New Guinea 73·5% 181·5% 488·4% 22·5% 121·6%
Paraguay 169·9% 77·2% 239·1% 133·7% 25·0%
Peru 87·6% 101·4% 276·0% 87·0% 48·7%
Philippines 80·9% 59·8% 614·9% 141·5% 50·7%
Poland 87·6% 100·0% 180·6% 91·6% 0·0%
Portugal 125·1% 91·4% 210·2% 113·5% 0·0%
Qatar 72·6% 112·2% 137·1% 37·8% 0·0%
Total health spending relative to modelled total health spending (%)
Share of total health spending that is from the government, relative to the modelled share (%)
Share of total health spending that is prepaid private, relative to the modelled share (%)
Share of total health spending that is out-of-pocket, relative to the modelled share (%)
Share of total health spending that is development assistance, relative to the modelled share (%)
(Continued from previous page)
Romania 84·1% 116·9% 15·1% 64·2% 1012·3%
Russia 98·5% 72·3% 100·0% 178·1% 0·0%
Rwanda 149·8% 0·0% 3072·2% 51·5% 174·6%
Saint Lucia 113·2% 79·7% 37·3% 130·3% 441·0%
Saint Vincent and the Grenadines
150·1% 75·7% 95·9% 135·3% 284·7%
Samoa 125·8% 173·2% 0·0% 14·5% 90·4%
Sao Tome and Principe 133·8% 77·6% 874·5% 27·2% 320·8%
Saudi Arabia 63·0% 101·2% 197·0% 79·4% 0·0%
Senegal 85·6% 122·7% 0·0% 75·3% 120·5%
Serbia 167·5% 98·1% 13·4% 111·2% 23·9%
Seychelles 46·5% 131·3% 143·3% 9·2% 181·7%
Sierra Leone 218·9% 19·2% 1235·0% 112·7% 125·6%
Singapore 98·1% 54·3% 47·7% 311·5% 0·0%
Slovakia 103·5% 104·9% 0·0% 97·1% 0·0%
Slovenia 120·2% 99·2% 516·1% 52·7% 0·0%
Solomon Islands 94·2% 260·3% 0·0% 9·0% 99·6%
Somalia 87·6% 142·7% 164·2% 72·2% 107·2%
South Africa 146·2% 74·0% 1850·3% 19·2% 411·3%
South Korea 93·9% 74·7% 233·0% 168·7% 0·0%
South Sudan 61·1% 61·1% 0·0% 91·1% 190·8%
Spain 118·4% 95·1% 170·8% 107·6% 0·0%
Sri Lanka 58·9% 88·0% 45·8% 121·5% 229·0%
Sudan 143·6% 44·8% 80·1% 180·9% 19·7%
Suriname 66·5% 102·1% 592·7% 49·1% 716·5%
Swaziland 164·8% 115·5% 473·5% 26·6% 519·4%
Sweden 160·3% 110·3% 20·8% 71·9% 0·0%
Switzerland 199·2% 77·1% 452·0% 133·2% 0·0%
Syria 53·1% 67·6% 127·1% 165·3% 216·1%
Tajikistan 123·6% 63·6% 1024·3% 130·3% 56·5%
Tanzania 107·3% 58·5% 2069·5% 45·2% 213·9%
Thailand 65·2% 120·9% 337·4% 37·7% 195·2%
The Bahamas 107·4% 64·3% 899·4% 113·4% 0·0%
The Gambia 145·7% 202·4% 0·0% 31·1% 121·6%
Timor-Leste 33·0% 99·1% 0·0% 18·6% 634·8%
Togo 86·0% 140·6% 1091·4% 103·0% 51·9%
Tonga 92·3% 141·4% 32·8% 28·4% 217·7%
Trinidad and Tobago 77·9% 74·0% 242·1% 164·9% 0·0%
Tunisia 117·2% 92·4% 202·5% 109·3% 18·0%
Turkey 80·2% 115·7% 130·9% 61·3% 35·7%
Turkmenistan 35·6% 89·2% 331·7% 102·5% 238·5%
Uganda 293·2% 3·3% 8624·8% 36·7% 64·8%
Ukraine 120·5% 85·8% 45·9% 128·7% 53·6%
United Arab Emirates 63·4% 92·4% 273·9% 98·6% 0·0%
development. Surrounding the modelled average, however, is a great deal of variation. Countries such as Afghanistan, Sudan, and Nigeria, spend more through OOP than expected. Conversely, countries such as Congo (Brazzaville), Algeria, South Africa, and France
have a disproportionally smaller OOP share of total health spending.
Column 5 of table 2 reports the share of health spending that is from development partners, in this case measured relative to expected spending. As shown in figure 2F, development assistance for health as a share of total health spending actually increases with GDP per capita for the countries with the smallest GDP per capita; a number of countries, such as Niger, which has a very low GDP per capita, receive very little development assistance for health. Relative to the expected amount, countries such as Botswana, Romania, and Gabon finance a greater share of their health spending using development assistance funds than would otherwise be expected. On the other hand, countries such as Cameroon and Sudan finance their health spending with less development assistance funds than would be expected based on their GDP per capita.
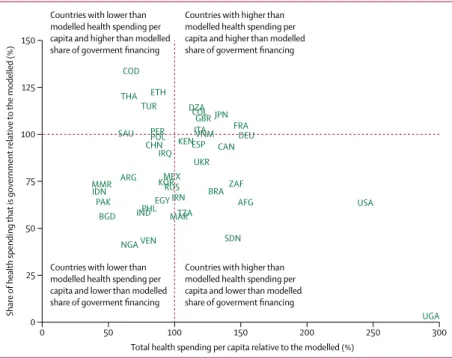
Figure 4 shows total health spending and the share that is government health spending, both relative to the modelled amount, based solely on GDP per capita. Countries such as Algeria and Japan have greater than modelled health spending per capita and greater than modelled share of financing from government. Countries such as Uganda and the USA have greater than modelled health spending per capita, but less than modelled share of financing from government. Conversely, countries such as Ethiopia and Thailand, have less health spending per capita than modelled, but higher than modelled share of financing from government, and countries such as India, Indonesia, and Philippines have less health spending per capita than modelled and lower than modelled share of financing from government.
Trends in development assistance for health
Figures 5 and 6 highlight important trends related to development assistance for health, reported in 2015 US $. In 2016, total development assistance for health
Total health spending relative to modelled total health spending (%)
Share of total health spending that is from the government, relative to the modelled share (%)
Share of total health spending that is prepaid private, relative to the modelled share (%)
Share of total health spending that is out-of-pocket, relative to the modelled share (%)
Share of total health spending that is development assistance, relative to the modelled share (%)
(Continued from previous page)
UK 121·4% 109·0% 244·6% 46·9% 0·0%
USA 243·7% 63·8% 1211·9% 60·7% 0·0%
Uruguay 126·1% 103·3% 485·1% 55·2% 6·8%
Uzbekistan 102·4% 93·5% 165·1% 113·0% 41·6%
Vanuatu 90·0% 155·2% 0·0% 12·2% 208·0%
Venezuela 79·9% 43·4% 236·0% 217·4% 1·5%
Vietnam 121·9% 100·8% 494·6% 93·7% 44·3%
Yemen 100·2% 31·5% 161·1% 176·4% 83·5%
Zambia 93·7% 72·1% 0·0% 65·3% 351·9%
Table 2: Health spending relative to expected health spending, 2014
0 50 100 150 200 250 300
0 25 50 75 100 125 150
Share
of health spending
that is government relative
to
the modelled (%)
Total health spending per capita relative to the modelled (%) Countries with lower than
modelled health spending per capita and lower than modelled share of goverment financing
Countries with higher than modelled health spending per capita and lower than modelled share of goverment financing Countries with lower than
modelled health spending per capita and higher than modelled share of goverment financing
Countries with higher than modelled health spending per capita and higher than modelled share of goverment financing
COD
THA ETH
TUR
SAU PERPOL CHN
IRQ KENESP CAN
VNM ITA DZACOL
GBR JPN FRA
DEU
UKR
BRAZAF
AFG TZA
MAR EGY IRN RUS KORMEX ARG MMR IDN
PAK
BGD INDPHL
VEN
NGA SDN
USA
UGA
Figure 4: Observed government and total health spending relative to modelled spending, 2014
amounted to US$37·6 billion. Figure 5 shows the most recent growth rates in the disbursement of development assistance for health (figure 5A), and recent disbursements disaggregated by channel of assistance (figure 5B). In the 1990s, total development assistance for health grew at an annualised rate of 4·6%. During the first decade of the millennium, development assistance
for health grew at an annualised rate of 11·3%, with especially large annualised growth for target areas associated with the Millennium Development Goals. Annualised growth between 2000 and 2009 was the highest for malaria, tuberculosis, and HIV/AIDS. Since 2010, total development assistance for health has grown at an annualised growth rate of 1·8%, with
Regional development banks World Bank
US foundations International NGOs US NGOs and foundations The Bill & Melinda Gates Foundation Global Fund
Gavi WHO
UNICEF, UNFPA, UNAIDS, and PAHO Other bilateral aid agencies Australia bilateral Canada bilateral France bilateral Germany bilateral UK bilateral US bilateral
–5 0 5 10 15 20 25 30 35
Annualised rate of change (%) A
Health sector support Non-communicable diseases Other infectious diseases Maternal health Newborn and child health Malaria Tuberculosis HIV/AIDS Total development assistance for health
1990–99 2000–09 2010–16
1990 1991 1992 1993 1994 1995 1996 1997 19981999 2000 200120022003 200420052006 20072008 2009 2010 2011 2012 2013 20142015* 2016*
0 2 4 6 8 10 12 14 16 18 20 22 24 26 28 30 32 34 36 38 B
Billions
of 2015
US$
Year
Figure 5: Changes in development assistance for health disbursements, 1990–2016
reductions in spending (–1·4%) for the largest health focus area, which is HIV/AIDS.
Between 1995 and 2014, $423·0 billion of development assistance for health was disbursed to low-income and middle-income countries (figure 6). 27·0% of develop-ment assistance for health went to sub-Saharan Africa, whereas 7·9% flowed to Latin America and the
Caribbean. Across health focus areas, 24·0% of development assistance for health focused on HIV/AIDS, while child and maternal health projects received 14·8% and 11·3% of funding, respectively. The majorityof the resources were provided by national treasuries, including the USA at 34·0% and the UK at 10·9%, of total development assistance for health in 2016. Major shares
Source Channel Health focus area GBD recipient region
Australia $6·9b Canada $11·4b France $16·0b
Germany $17·4b
UK $31·8b
USA $133·9b
Australia $3·9b
HIV/AIDS $101·4b
Southeast Asia, east Asia, and Oceania* $27·9b
Central Europe, eastern Europe, and Central Asia $10·6b
Latin America and Caribbean $33·4b
North Africa and Middle East $12·3b
South Asia $31·4b
Sub-Saharan Africa $113·6b
Global initiatives $59·3b
Unallocable $133·6b Malaria
$19·7b
Tuberculosis $12·8b
Other infectious diseases $16·2b
Newborn and child health $62·4b
Maternal health $47·7b
Non-communicable diseases $5·4b
Health sector support $49·8b
Other health focus areas $90·5b
Unallocable $16·2b Canada
$4·8b France $7·0b Germany $8·4b
UK $15·1b
USA $75·3b
Other bilateral aid agencies $36·2b
European Commission $7·8b
UNICEF, UNFPA, UNAIDS, and PAHO $31·7b
WHO $31·9b
Development banks $50·3b
NGOs and foundations $96·0b
The Bill & Melinda Gates Foundation $13·8b
Global fund $29·9b
Gavi $10·0b Other governments
$87·7b
Private philanthropy $45·7b
The Bill & Melinda Gates Foundation $19·6b
Other sources $51·7b
Figure 6: Flow of developmental assistance for health for all funds dispersed, 1995–2014
of development assistance for health also flowed through multilateral development agencies, such as the World Bank and WHO, which disbursed 5·1% and 5·8%, respectively, and private-public partnerships, such as the Global Fund and Gavi, who disbursed 9·9% and 4·9%, respectively, in 2016.
Health spending by type of goods and service
Figure 7 shows that spending by type of goods and service was relatively constant across different levels of economic development. At the median GDP per capita ($8346), 29·0% of total spending was on inpatient curative and rehabilitative care, 30·6% is on day and outpatient curative and rehabilitative care, and 23·5% is on medical goods, which include pharmaceuticals, in 2014 (figure 7A). These values drop marginally at the highest values of GDP per capita, where long-term care is more prominent.
Government spending by type of goods and service is very similar to total spending (figure 7B), although the government spends less on medical goods, in particular above the median GDP capita, and slightly more on immunisations and early disease detection at the very lowest levels of GDP per capita.
Discussion
This study identifies health spending trends and country-specific deviations for 184 nations from 1995 to 2014. The findings show that, on average, economic development is associated with increases in health spending per person and decreases in the share of spending that is financed OOP. In addition to this, we show that development assistance for health also fits neatly into the framework outlined in the health financing transition—like OOP health spending, the share of health financing from development partners decreases precipitously with economic development.
Figure 3 highlights three distinct health financing stages that emerge along the spectrum of economic development. In the first stage, health financing is dominated by development assistance for health and OOP. In the second stage, development assistance for health subsides, and the primary sources of health-care financing are OOP and domestic government spending. Finally, the third stage includes countries with the highest GDP per capita, which tend to finance health care using government spending. While these stages are conceptually clear, and are neatly shown in figure 3, it is important to note the great deal of variation that exists around these trends. While the empirical evidence supporting the health financing transition is robust on average, many counter-examples exists. Some upper-middle-income countries such as Angola and Turkmenistan spent only $228 and $396, respectively, per capita on health in 2014. Similarly, some lower-middle-income countries such as Sudan and Federated States of Micronesia rely heavily on OOP and development assistance for health. Despite the clear and intuitive trends articulated by the health financing transition, an important conclusion of this research is that country-specific characteristics are central to health financing, and that time and economic development do not guarantee a transition towards adequate prepaid spending needed to support universal health coverage. The trends shown here are encouraging, although substantive deviation from the trends are in some cases worrisome.
At the nexus of economic development and health financing are concerns related to what some have called the missing middle. This missing middle concept, which has been debated, asserts that in the process of transitioning from low-income to middle-income status, countries receive less development assistance for health although they are not yet able to domestically raise sufficient government
0 25 50 75 100
Modelled proportion
of
total
health-care financing (%)
Gross domestic product per capita A
0 25 50 75 100
Modelled proportion
of governmen
t
financing schemes (%)
Gross domestic product per capita B
Inpatient care, curative and rehabilitative Long-term care
Medical goods
Governance, health system, and financing administration
Day and outpatient care, curative and rehabilitative Ancillary services
Immunisation and early disease detection Other
500 1000 2500 5000 10000 25 000 50 000 120 000 500 1000 2500 5000 10000 25 000 50 000 120 000
Figure 7: Composition of health spending by type of goods and services, 2014